# The Hidden Chemistry Equation That Makes Your Water Filter, Gas Mask, and Blood Filter Work
Every time you flip on a gas stove, breathe through a respirator, or take a pharmaceutical pill, the same invisible equation is working. Molecules are sticking to surfaces — not through chemical bonding, but through a gentler physical adhesion. The strength of that adhesion, and how it changes as more molecules pile on, is described by a set of mathematical curves called **adsorption isotherms**.
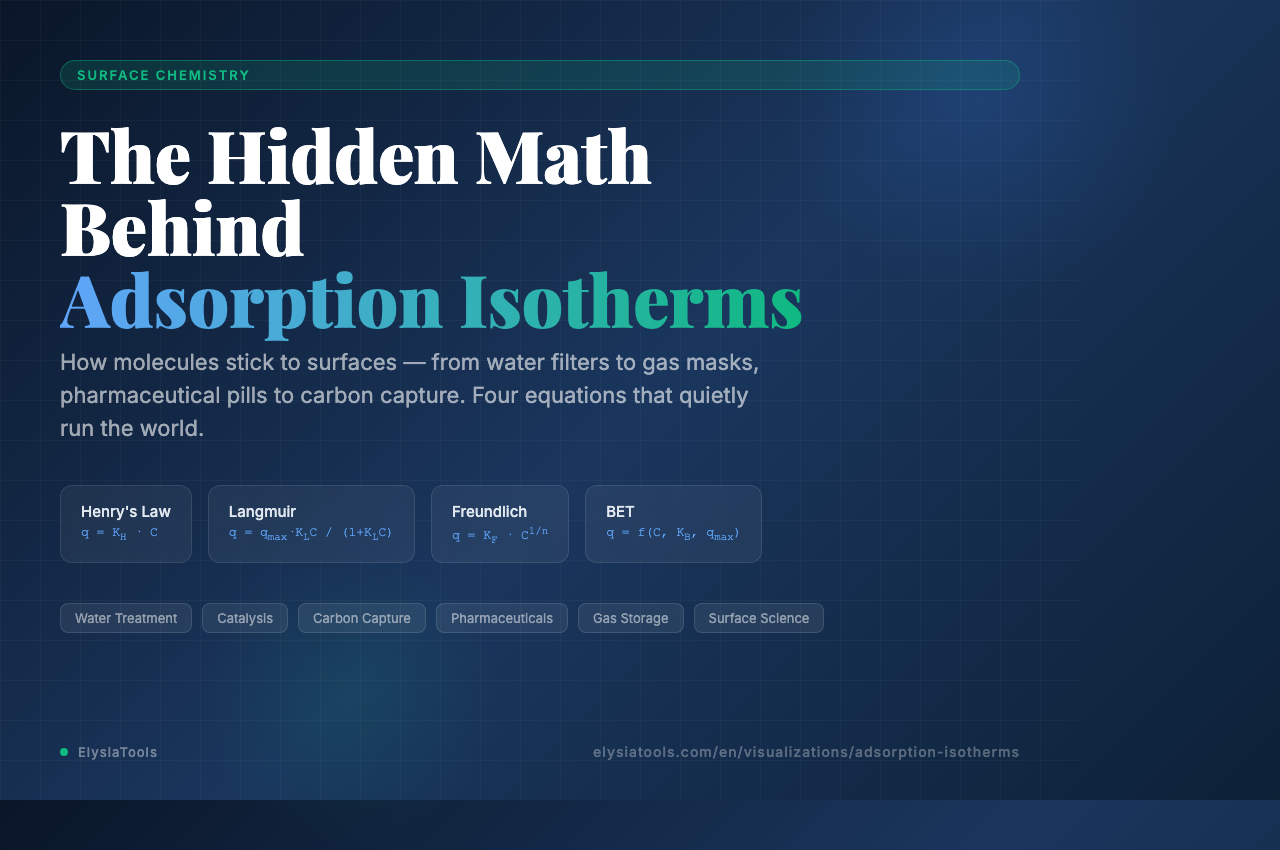
These curves were worked out across the early 20th century by researchers who needed to understand why charcoal worked so well at cleaning air, why certain catalysts accelerated chemical reactions, and how gas molecules arranged themselves inside porous materials. The equations they derived — Langmuir, Freundlich, BET, and Henry’s law — are still used today to design everything from industrial gas separation units to the controlled-release mechanism in your medication.
The [Adsorption Isotherms visualization at ElysiaTools](https://elysiatools.com/en/visualizations/adsorption-isotherms) lets you explore all four models interactively, adjusting parameters and watching how the curves shift in real time.
## The Basic Premise: Why Molecules Stick
When a gas or liquid molecule collides with a solid surface, it can either bounce off or stick. Whether it sticks depends on the energy of the interaction. Physical adsorption (physisorption) involves weak van der Waals forces — the same forces that make geckos climb walls and that cause condensation on cold surfaces. The heat released is small, 10–40 kilojoules per mole, and the process is generally reversible. Chemical adsorption (chemisorption) involves actual chemical bond formation, releasing much more heat (40–800 kJ/mol) and being far more specific about which molecules will stick.
The word *isotherm* simply means “constant temperature.” All adsorption measurements are made at fixed temperature, because temperature changes everything about how molecules behave on surfaces. Measure at 25°C versus 200°C and you get completely different curves.
## The Four Models
### Henry’s Law: Where Everything Starts
At extremely low concentrations — trace pollutants in parts-per-million, or gas dissolved at low partial pressure — the relationship between concentration and adsorption is perfectly linear. Double the concentration in the fluid, and you roughly double the amount stuck to the surface. This is Henry’s law, and it is the foundation from which all other models branch.
The linear relationship breaks down once surface coverage becomes significant. When molecules start bumping into each other on the surface, the simple linear model no longer holds. But Henry’s law remains important for predicting how trace contaminants behave in groundwater, in industrial gas streams, and in the early stages of any adsorption process.
### The Langmuir Isotherm: Monolayer Paradise
Irving Langmuir published his model in 1918, and it remains the most cited adsorption paper in history. His key assumptions were radical for their time: all adsorption sites on a surface are identical, each site can hold exactly one molecule (no stacking), there are no interactions between neighboring adsorbed molecules, and adsorption reaches a dynamic equilibrium.
The resulting equation produces an S-shaped curve. At low concentrations, adsorption increases roughly linearly. At intermediate concentrations, the curve bends upward as available sites fill rapidly. At high concentrations, the curve plateaus — the surface is fully covered in a single molecular layer, and no more adsorption can occur until a molecule leaves.
The Langmuir equation is still the default model for chemisorption processes and for physical adsorption on uniform surfaces. Its linearized form — plotting concentration divided by adsorption amount versus concentration — gives a straight line, making it easy to extract the two key parameters: maximum adsorption capacity (q_max) and binding affinity (K_L).
### The Freundlich Isotherm: When the Surface is Rough
Langmuir’s model assumes a perfectly uniform surface. Real materials — activated carbon, silica gel, natural soils — are anything but. Their surfaces contain high-energy sites and low-energy sites, deep pores and shallow ones, different crystal faces and exposed functional groups.
Herbert Freundlich proposed an empirical model in 1909 that handles this heterogeneity by using an exponential relationship: q = K_F × C^(1/n). When n is greater than 1, adsorption is favorable — the surface readily accepts molecules. When n is less than 1, adsorption is unfavorable. The Freundlich model does not predict a saturation limit, which is both its weakness and its strength: it works well at intermediate concentrations where multilayer adsorption occurs, even though no real surface can adsorb infinite amounts.
Freundlich is widely used for adsorption from solution — dye removal from wastewater, heavy metal capture by natural clays, pharmaceutical compound binding to activated carbon. In these applications, the surface heterogeneity is so pronounced that Langmuir’s assumptions simply don’t hold.
### The BET Isotherm: When Layers Stack
The Brunauer-Emmett-Teller model, developed in 1938, extended Langmuir’s theory to multilayer adsorption. Their key insight was that after the first molecular layer sticks to the surface with energy E₁, subsequent layers behave differently — they stick to each other with the weaker energy of liquefaction, E_L, essentially condensation.
The BET equation produces a curve that looks nothing like Langmuir’s S-shape. At low relative pressures, it behaves like Langmuir. But as pressure rises and the first monolayer fills, additional layers begin forming on top of it. At high relative pressures approaching saturation, the adsorbed amount diverges — the surface is covered in many layers of molecules, essentially condensed liquid.
The BET model is most famous for a different application: measuring the surface area of porous materials. By fitting the BET equation to nitrogen adsorption data at 77 Kelvin, scientists can determine the monolayer capacity and calculate the total accessible surface area. A gram of activated carbon might have 500–1,500 square meters of internal surface area — roughly the floor space of a small house, folded inside a sugar-cube-sized particle.
## The IUPAC Types: Six Shapes, Six Materials
Not all adsorption curves look the same. The International Union of Pure and Applied Chemistry classifies them into six types:
**Type I** is the Langmuir curve — microporous materials with pore widths under 2 nanometers, where adsorption fills the pores rather than coating a flat surface. Carbon molecular sieves and zeolites show this type.
**Type II** is the BET curve — non-porous or macroporous materials where multilayer adsorption builds normally. The inflection point marks where the monolayer is complete.
**Type III** is rare — it occurs when the adsorbate-adsorbent interaction is so weak that molecules are actually more attracted to each other than to the surface. Multilayer formation begins before the monolayer completes.
**Type IV** is characteristic of mesoporous materials (2–50 nm pore width) and shows a distinctive hysteresis loop — the adsorption branch takes a different path than the desorption branch due to capillary condensation in the pores.
**Type V** combines weak interactions with a mesoporous structure, producing hysteresis but with a shape distinct from Type IV.
**Type VI** represents stepwise multilayer adsorption on highly uniform non-porous surfaces — each layer completes before the next begins, producing clear steps in the isotherm.
## What This Actually Does in the World
**Water treatment.** Activated carbon is the workhorse of municipal water filtration. Its labyrinthine pore structure and massive internal surface area adsorb organic pollutants, chlorine compounds, and trace pharmaceuticals. The carbon sits in large filter beds; water flows through and contaminants stick to the carbon surface. When the carbon is exhausted, it is regenerated by heating to drive off the adsorbed compounds.
**Gas storage.** Adsorbed natural gas (ANG) technology stores methane in porous carbon materials at moderate pressures (3–4 MPa) rather than as highly compressed gas (25 MPa). The adsorption process concentrates methane molecules onto the internal surface of the carbon, effectively increasing storage capacity by 50–70% compared to an empty tank at the same pressure. This makes ANG attractive for vehicles where high-pressure tanks are impractical.
**Heterogeneous catalysis.** Most industrial catalysts are solid surfaces with adsorbed reactant molecules. Understanding adsorption isotherms tells engineers how much catalyst surface is actually available, how strongly reactants bind, and whether the rate-limiting step is adsorption, surface reaction, or desorption. The Langmuir-Hinshelwood model, used to design ammonia synthesis reactors and petroleum refining units, is built directly on Langmuir adsorption.
**Carbon capture.** Removing CO₂ from flue gas is one proposed approach to reducing industrial carbon emissions. Solid sorbents — amine-functionalized silica, metal-organic frameworks, zeolites — adsorb CO₂ from the gas stream. The sorbent is then heated or pressure-swing regenerated to release the CO₂ for sequestration. BET surface area and pore size distribution are critical parameters for screening candidate materials.
**Pharmaceuticals.** Drug formulation scientists use adsorption models to understand how drug molecules bind to excipients, how they release from tablets, and how they interact with biological surfaces. The same Langmuir and Freundlich frameworks that describe industrial adsorption also describe drug-protein binding in the bloodstream — a case of the same mathematics applying from the factory floor to the bloodstream.
## The Hysteresis Loop: Pore Geometry Written in a Curve
When you adsorb and then desorb a gas on a mesoporous material, the two curves don’t overlap. This hysteresis loop contains information about the pore structure. Type H1 hysteresis indicates cylindrical pores of uniform size — common in some ordered mesoporous silicas. Type H2 indicates ink-bottle pores with narrow necks — desorption requires evaporation through a curved meniscus that forms at a different pressure than the condensation during adsorption. Type H3 indicates slit-shaped pores, common in aggregates of plate-like particles. Type H4 is characteristic of narrow slit pores.
The Kelvin equation, developed in the 1870s, explains why: evaporation from a concave meniscus occurs at lower pressure than condensation into a convex meniscus of the same radius. The hysteresis loop is literally a fingerprint of the internal geometry of the material, readable without cutting the particle open.
## What to Try in the Visualization
Load the [Adsorption Isotherms tool](https://elysiatools.com/en/visualizations/adsorption-isotherms) and start with the activated carbon preset. Compare how Langmuir and Freundlich fit the same data differently — Freundlich typically curves upward more steeply at high concentrations because it has no saturation limit. Switch to the BET model and watch the curve diverge at high relative pressure while Langmuir flattens.
The linearized plots are particularly revealing. For Langmuir, the linearized C/q versus C plot should be straight — if it curves, the surface is heterogeneous. For BET, the linearized region at intermediate relative pressures (0.05–0.30) is what engineers extract to calculate surface area. Outside that range, the model breaks down.
Understanding why each model works where it does — and where each fails — is the same skill used in material science research, environmental engineering, and pharmaceutical development. The four curves are more than textbook equations. They are design tools that engineers reach for whenever molecules need to be separated, concentrated, or released in a controlled way.