Why One Gas Law Explains What Others Miss: The P-V-T Triangle Behind Every Engine and Breath
You吸气. You呼气. Somewhere in your chest, a gas is doing physics — contracting under pressure, expanding with heat, obeying three relationships discovered over a century before anyone understood what a molecule was.
Most textbooks teach these laws separately. Boyle’s Law gets a graph. Charles’s Law gets another. Gay-Lussac’s Law surfaces briefly, then disappears. Students memorize P₁V₁ = P₂V₂, V/T = constant, P/T = constant — and then forget them the week after the exam.
The problem isn’t memory. It’s that the laws never get shown as what they actually are: three perspectives on the same invisible dance between pressure, volume, and temperature. See all three at once, in one interactive visualization, and something clicks that no textbook delivers.
Boyle’s Law: The Inverse Relationship Nobody Expects
At constant temperature, pressure and volume move in opposite directions. Squeeze the gas — reduce its volume — and its pressure rises. Expand it, and pressure drops.
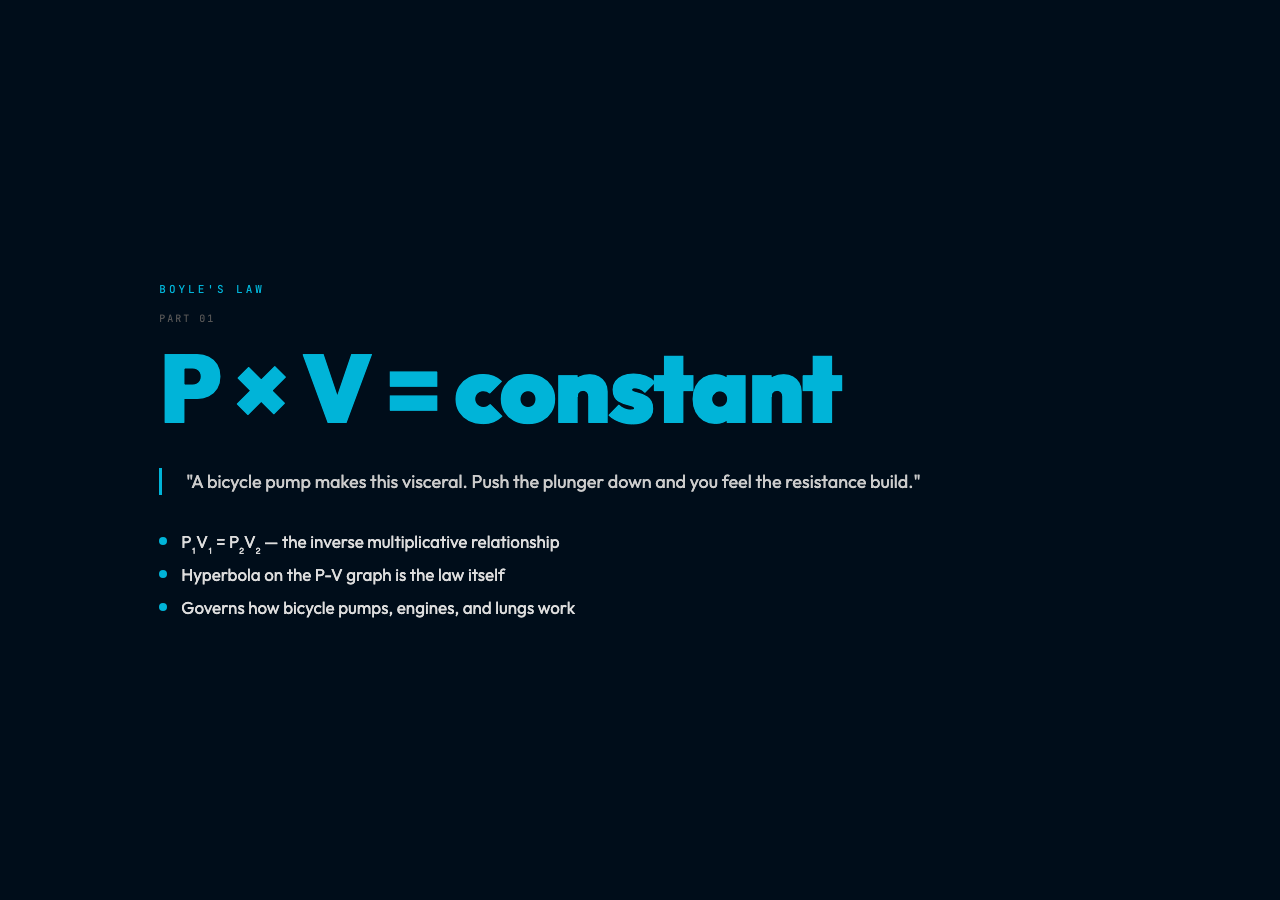
The math is clean: P × V = constant (at fixed n and T).
A bicycle pump makes this visceral. Push the plunger down, reducing the volume of air inside the cylinder, and you feel resistance building against your hand. That resistance is rising pressure. You’ve just done Boyle’s Law in your garage.
The visualization shows this as a real-time graph — pressure plotted against volume, tracing a hyperbola as you drag the slider. Each point on the curve satisfies PV = constant. The curve itself is the law.
What makes this non-obvious: people expect “more compression = more pressure” and stop there. They don’t internalize the multiplicative nature of the relationship until they see the hyperbola steepen at low volumes and flatten at high ones. The shape is the insight.
Charles’s Law: Why Hot Air Rises
At constant pressure, volume and temperature are directly proportional. Warm the gas, and it expands. Cool it, and it contracts.

The math: V/T = constant (at fixed n and P).
This is why hot air balloons float. Heat the air inside the envelope, its volume expands for the same pressure, its density drops below the surrounding cold air, and buoyancy does the rest. The same mechanism explains why a car tire feels flatter on a cold morning — not because air escaped, but because the remaining air contracted.
The Charles’s Law panel in the visualization shows volume increasing as temperature rises, a straight line on the V-T graph. Watch the cylinder grow taller on the animated panel as you heat the gas. The visual makes the abstract proportional relationship immediate.
Gay-Lussac’s Law: The Pressure You Can’t See
At constant volume, pressure and temperature are directly proportional. Heat a sealed rigid container and the pressure inside rises.

The math: P/T = constant (at fixed n and V).
This is the dangerous one. A sealed aerosol can heated above a certain temperature doesn’t just leak — it ruptures. The gas molecules inside move faster, collide with the container walls more frequently and with more momentum, and the pressure builds past what the container can withstand. Gay-Lussac’s Law quantifies exactly how rapidly pressure climbs with temperature in a rigid volume.
The Gay-Lussac panel in the visualization shows pressure rising linearly with temperature, with a rigid cylinder whose volume doesn’t change — only the pressure gauge moves.
The Three Laws as One System: The Ideal Gas Law
The real unifying insight is that these three laws are special cases of a single relationship:
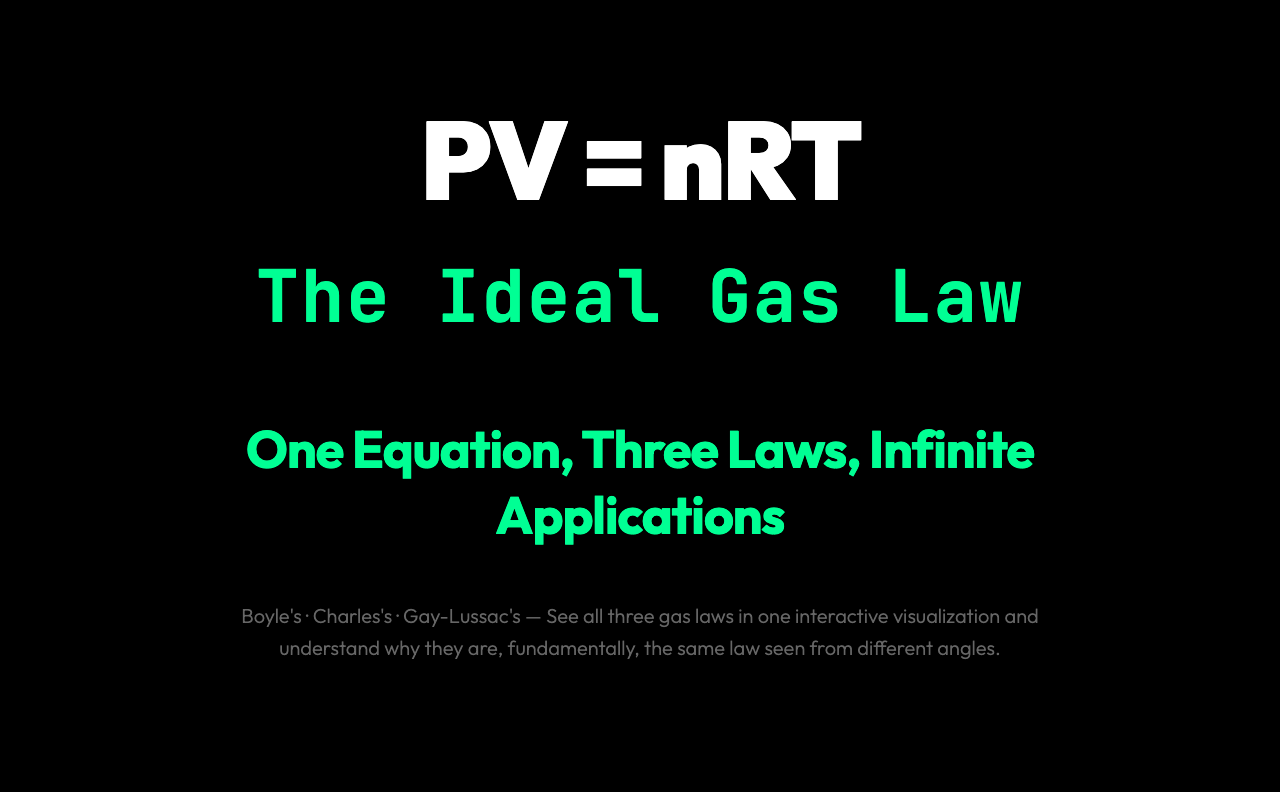
PV = nRT
P is pressure, V is volume, n is the number of moles of gas, R is the universal gas constant (8.314 J/mol·K), and T is absolute temperature.
From this one equation, you can derive all three individual laws by holding different variables constant. Hold T constant → Boyle’s Law (P₁V₁ = P₂V₂). Hold P constant → Charles’s Law (V₁/T₁ = V₂/T₂). Hold V constant → Gay-Lussac’s Law (P₁/T₁ = P₂/T₂).
The universal gas constant R bridges them. It converts between energy units (joules), amount of substance (moles), and absolute temperature (kelvin). It is, in a precise physical sense, the conversion factor between the microscopic world of individual molecules and the macroscopic world of pressure gauges and graduated cylinders.
What the Interactive Visualization Shows
The Gas Laws Comparison tool lets you manipulate all three laws simultaneously, on a single page:
– Three animated canvases, one for each law, showing the gas behavior in a piston or sealed cylinder – Three real-time graphs, plotting the P-V, V-T, and P-T relationships – Sliders to adjust the controlled variable in each law and watch the other two parameters respond – Pressure, volume, and temperature readouts updating in real time as you drag
The value isn’t in any single law — it’s in watching all three together. When you see Charles’s Law piston extending as you heat the gas, and simultaneously observe the corresponding point moving on the V-T graph, the direct proportionality stops being a formula and becomes a thing you watched happen.
The visualization defaults to initial conditions of P = 100 kPa, V = 1.0 L, T = 300 K, n = 0.1 mol. You can vary these and watch the system respond across all three laws simultaneously. At standard temperature and pressure (0°C, 101.325 kPa), one mole of an ideal gas occupies 22.4 liters — a number that appears in every chemistry textbook but rarely in any intuitive context.
Why This Matters Beyond the Textbook
These aren’t historical curiosities. Every internal combustion engine runs on Boyle’s Law — the compression stroke reduces cylinder volume, raising pressure and temperature until the fuel-air mixture ignites. Every refrigeration cycle runs on Gay-Lussac’s Law — compressing a gas raises its temperature, allowing it to release heat as it condenses, and expanding it cools it further. Charles’s Law describes how Earth’s atmosphere circulates, why tall chimneys draw better, and why a double-pane window’s argon gap provides insulation.
The same relationships, three centuries old, still govern the thermodynamics of every power plant, climate system, and living cell.
Open the visualization. Move the sliders. Watch the hyperbola, the straight line, and the pressure gauge tell the same story from three angles — and you will never need to memorize the laws again.