The One Curve That Quietly Runs the Inequality Debate
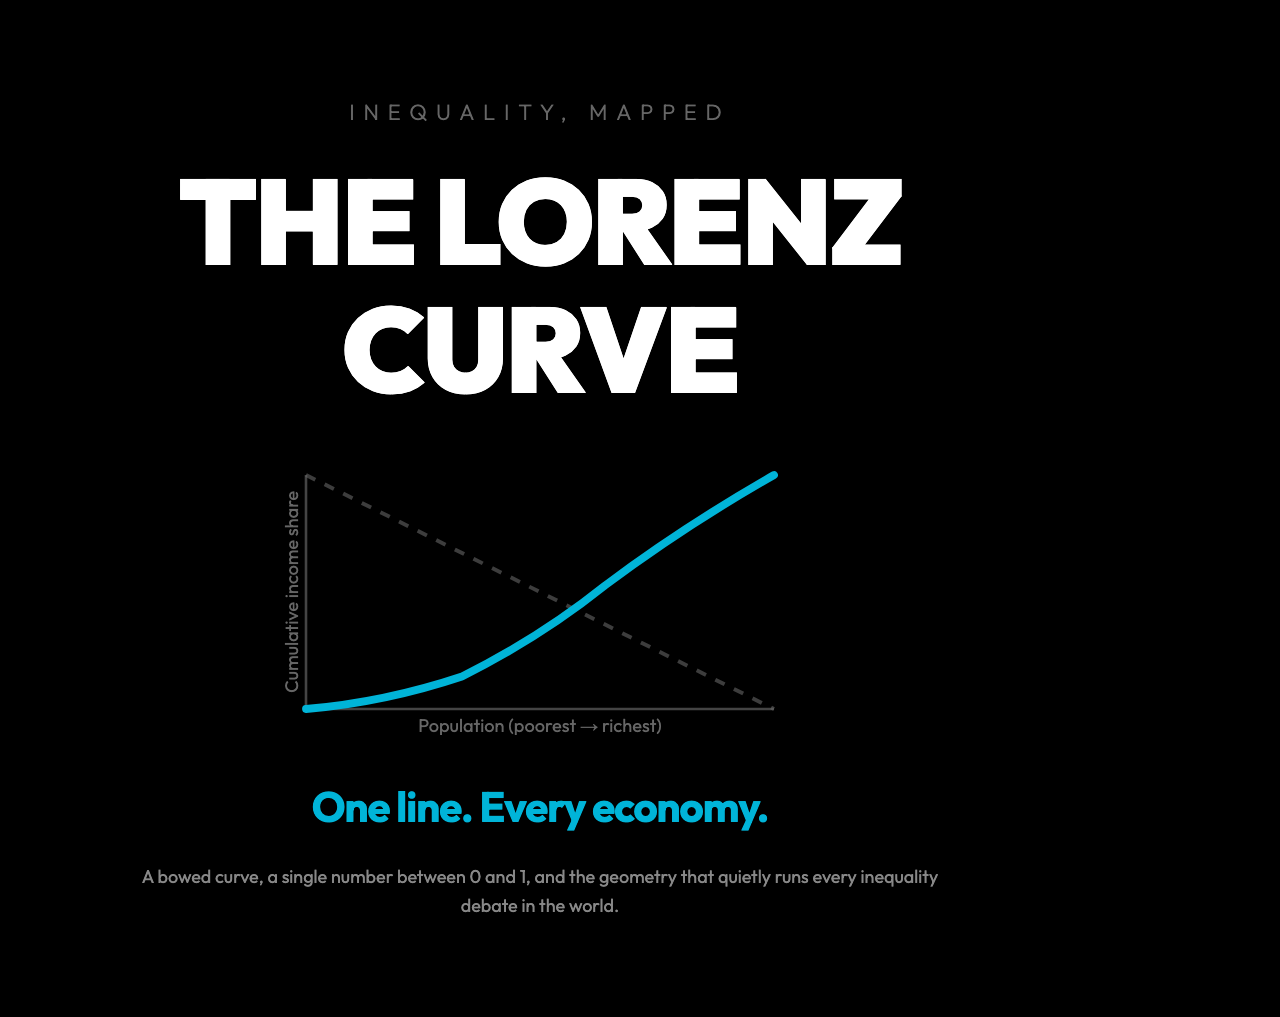
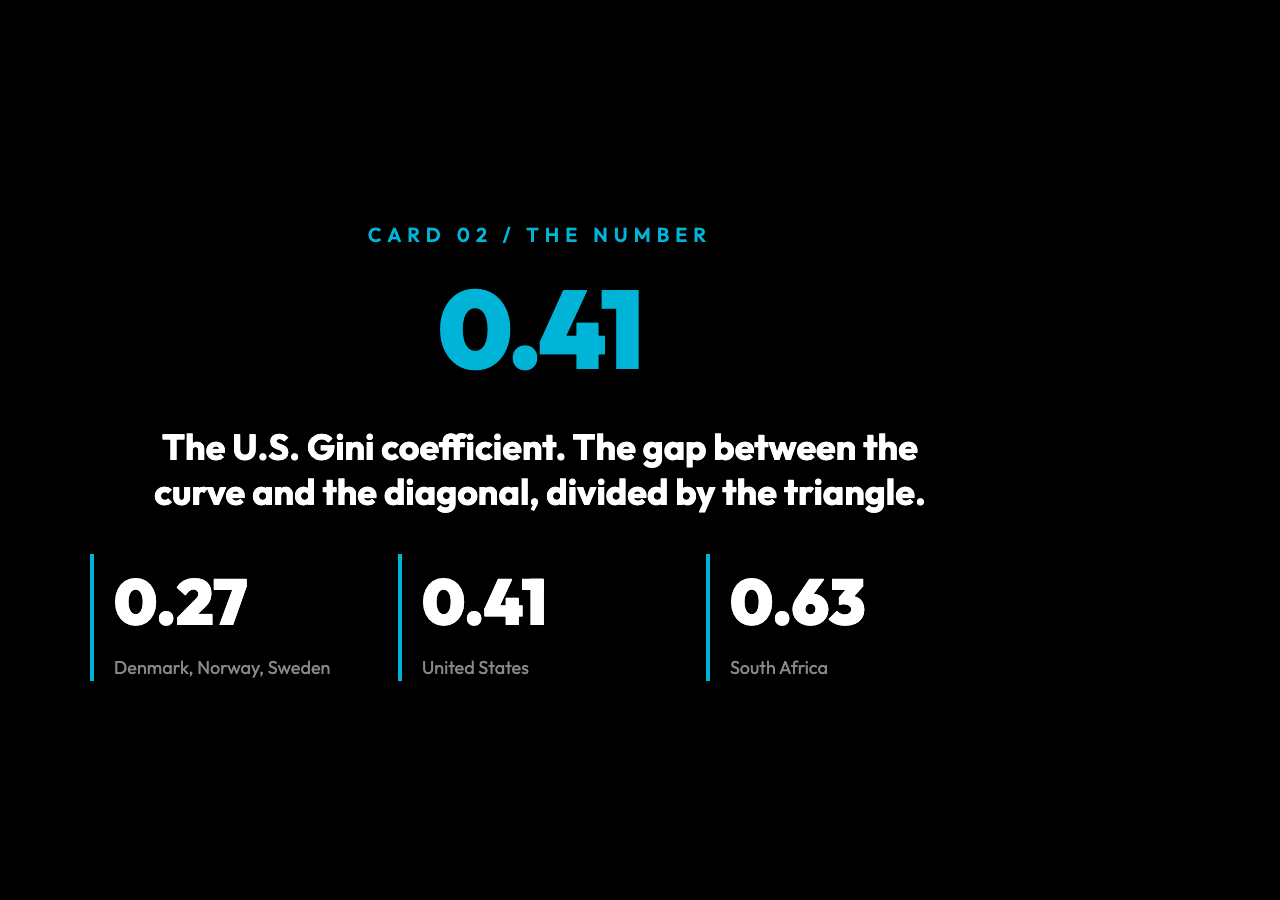
What if one line on a 2D plot could describe an entire economy? South Africa’s Gini is 0.63. The U.S. is 0.41. Denmark is 0.27. Draw the picture and those three numbers stop being statistics — they become the shape of who gets what. Plot the poorest 10% of a country, then the next 10%, all the way to the richest 10%, with each group’s share of total income on the y-axis. Connect the dots. The line that emerges bows below the diagonal by a precise amount. Divide that gap by the area of the triangle, and you get the Gini. Multiply the same idea across a hundred million people, and you get the geometry of an economy. This is the Lorenz curve, drawn in 1905 by an American economist named Max O. Lorenz, and it is still the most-used picture in inequality research a century later.
The reason is compression. Every tax reform, every recession, every pandemic, every decade of trade policy in every country on Earth can be boiled down to a Gini number between 0 and 1. These are not just rankings. They are the shape of who gets what, and the shape bends in observable, sometimes alarming ways. The Lorenz curve is the picture. The Gini is the number. And both of them hide stories you would miss if you only looked at averages.
What the Curve Actually Plots
Take a population of 100 people and rank them from poorest to richest. On the x-axis, plot the cumulative share of the population (10%, 20%, … 100%). On the y-axis, plot the cumulative share of total income that group earns. If the bottom 10% earns 2% of all income, the first point sits at (0.1, 0.02). If the bottom 50% earns 25% of all income, the midpoint sits at (0.5, 0.25). Continue to (1, 1) — the top 100% of the population always earns 100% of the income.
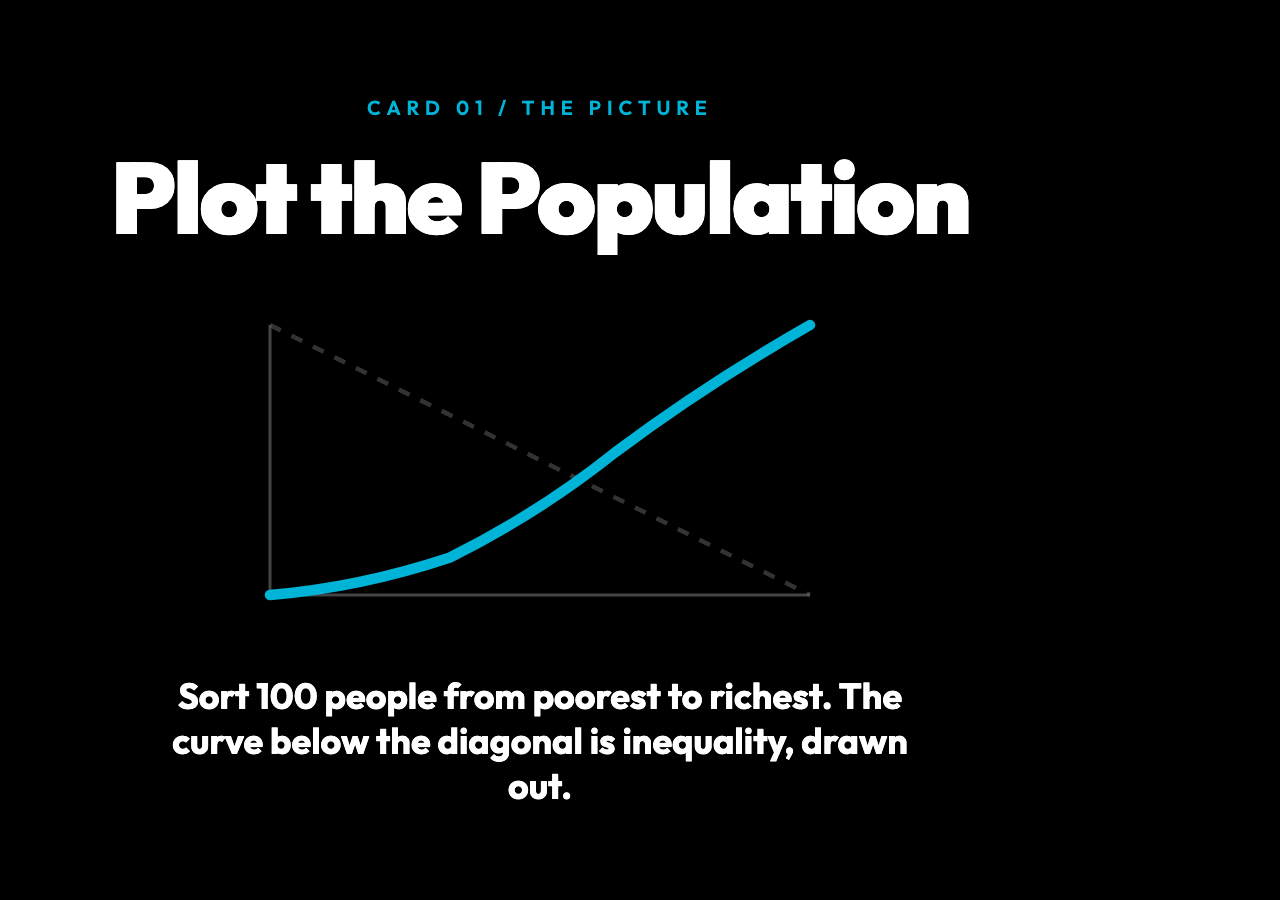
A perfectly equal society produces the straight diagonal y = x. A society where one person earns everything and the other 99 earn nothing produces a flat line at y = 0 that suddenly jumps to y = 1 at the very end. Real societies live between these extremes. The bowed shape you almost always see — sag in the middle, steep climb at the right — is what economists mean when they say the distribution is unequal. The deeper the sag, the more unequal the society.
How the Gini Coefficient Is Born
The Gini coefficient is the area between the perfect-equality diagonal and the actual Lorenz curve, expressed as a ratio of the area under the diagonal. Mathematically, if A is the area between the two lines and B is the area under the curve, the coefficient is A / (A + B). Perfect equality gives 0 (A is zero). Perfect inequality gives 1 (the curve hugs the x-axis until the last point, so A approaches the full triangle).
This is why the Gini is so beloved by international organizations: one number, bounded, comparable across countries and over time. You can graph the Gini of every nation on a single map, watch it move year by year, and read off the story of two decades of policy in a glance. The World Bank publishes a Gini index for almost every country on Earth. The OECD tracks it annually. Central banks cite it in inflation reports.
But the Gini has a dirty secret: it is not a complete picture. Two countries with identical Gini coefficients can have wildly different inequality stories. One might have a struggling middle class with a thin billionaire top. Another might have a comfortable working class with a small but extremely wealthy aristocracy. The Lorenz curves look the same. The lived experiences do not. This is the limitation that makes the Gini a starting point, not an ending.
The Number That Moves With Policy
Tax reforms move the Gini. The Nordic countries fund universal healthcare, free college, and generous unemployment insurance by collecting high marginal taxes from high earners. Their Gini coefficients sit in the 0.25–0.28 range, among the lowest in the world. The United States, with a lower top marginal rate, weaker redistribution, and a less generous safety net, sits at about 0.41. The gap between these numbers is not random — it is the direct geometric signature of policy choices about who pays for what.
Recessions also move the Gini, often upward. The 2008 financial crisis pushed inequality higher in most developed economies, and the recovery that followed did almost all of its lifting at the top. The 2020 pandemic shock did something unusual: in many rich countries, government transfers temporarily pushed the Gini down, even as the underlying labor market split into “essential workers” and “work-from-home” tiers. Once the transfers ended, the Gini drifted back up. You can see this play out in the curves — the same shape, with a different sag, year after year.
Why a Single Number Can Mislead
The Gini treats a dollar moved from a billionaire to a millionaire the same as a dollar moved from a poor family to a middle-class family. Both moves shrink the area between the curve and the diagonal by the same amount. Both reduce the Gini by the same decimal. But the human consequences are not remotely comparable. A poor family that gains a few thousand dollars can pay rent, buy medicine, keep the heat on. A millionaire who loses a few thousand dollars buys a slightly smaller boat.
This is why serious inequality research always pairs the Gini with other statistics. The Palma ratio looks at the income share of the top 10% versus the bottom 40%. The 20/20 ratio compares the top quintile to the bottom quintile. The Theil index can be decomposed into within-group and between-group inequality, which lets researchers ask “is the inequality between countries or within them?” The Gini is the headline. The other numbers are the paragraphs.
How to Read a Lorenz Curve in 30 Seconds
When you look at a Lorenz curve, three things matter. First, the shape: how steeply does the curve rise at the right edge? A sharp vertical climb at the end means a tiny wealthy elite captures a huge share of income. Second, the bend: where does the curve start to peel away from the diagonal? An early bend means the bottom of the distribution is being squeezed hard. Third, the gap: the larger the gap between the curve and the diagonal, the higher the Gini, and the harder it is to defend a society as fair.
If you can drag the curve in an interactive tool and see the Gini update in real time, the relationship between shape and number becomes obvious. A 1% shift in the top 1%’s share moves the Gini more than a 1% shift in the middle class’s share. The curve is not symmetric around its middle. The top of the distribution has disproportionate geometric leverage, and that is the entire reason high-end inequality dominates policy debates.
Why the Visualization Changes How You Think
Most people encounter the Gini as a number on a chart. It is hard to feel what 0.41 means, or to grasp why a change from 0.40 to 0.42 is alarming but a change from 0.27 to 0.29 is unremarkable. A static curve drawn on a report does not fix this. But a Lorenz curve you can manipulate — drag the bottom decile’s share up, watch the curve straighten, watch the Gini fall — builds intuition that no article can. The numbers stop being abstract.
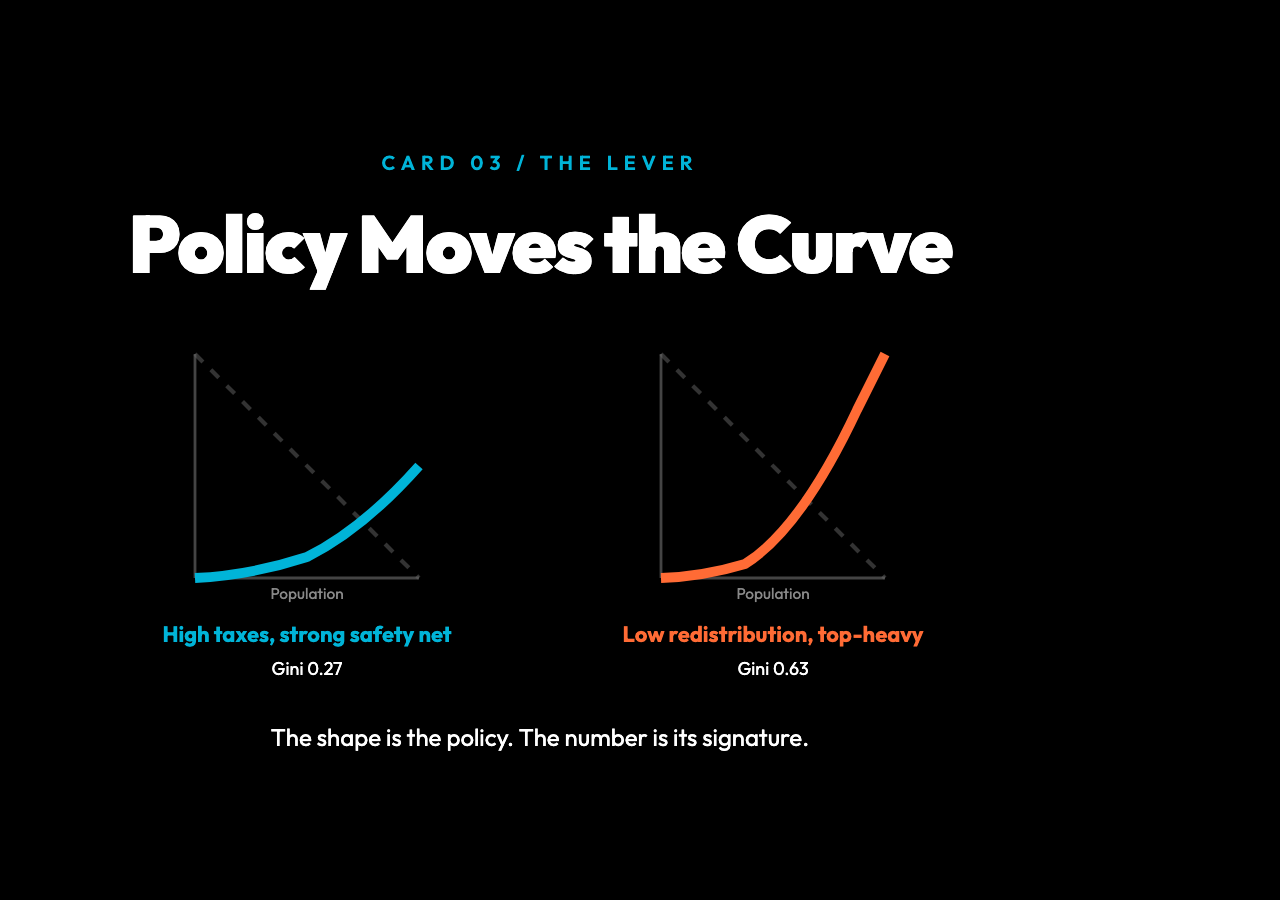
The Lorenz Curve & Gini Coefficient visualization on Elysia Tools lets you adjust the income share distribution with sliders, see the curve redraw, and read off the live Gini. It is a small tool with a big teaching effect: once you have nudged the distribution and watched the number change, you will never again read a headline about inequality without picturing the geometry underneath.
The Curve Is Not the Whole Story — But It Is the Spine
The Lorenz curve and the Gini coefficient are the most useful single image and the most useful single number we have for inequality. They are not the truth — no statistic ever is — but they are the picture that holds everything else together. Every claim about who gets what, every policy debate about redistribution, every cross-country ranking rests on this geometry. If you understand the curve, you can read the world differently. You can see why a tax cut for the top brackets bows the curve downward, why a universal basic income straightens it, why a pandemic that hits low-wage workers first deepens the sag. The math is simple. The story is not.
So here is the question worth sitting with: if you could choose where on the curve you wanted to live, where would you draw the line? Not the country with the lowest Gini — the country whose shape of inequality you could defend. That is the question that no chart can answer for you. The point is, once you have read the curve, you will at least know which line you are walking away from. And that, ultimately, is what every Gini number in every headline is really asking.
Explore more interactive teaching tools at Elysia Tools.