If you have ever watched a logistic regression collapse the moment you fed it a column measured in dollars next to a column measured in years, you already know the rule: models do not understand units, only magnitudes. Z-score standardization is the fix most teams reach for first, but the way most teams reach for it is also why their pipelines quietly drift the moment a new batch of data shows up.
This post walks through what Z-score normalization actually guarantees, the three places it silently fails, and how to wire it into a production preprocessing step without lying to your downstream model.
What Z-score standardization really does
Z-score normalization rewrites every value as the signed distance from the column mean, measured in standard deviations. The formula is famously simple:
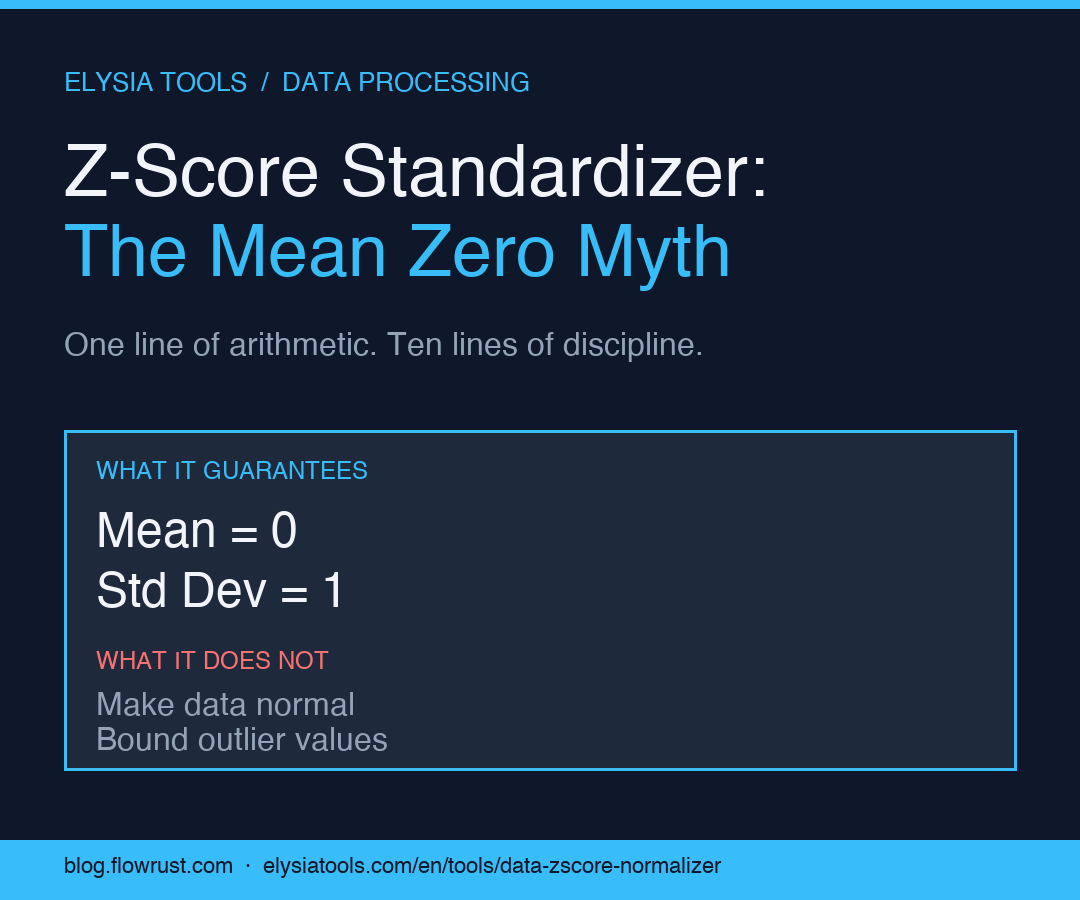
z = (x - mean) / stdAfter the transformation, every column has a mean of zero and a standard deviation of one. That part is mechanical. The part that engineers miss is what the operation does not give you:
- It does not make your data normally distributed. If the column is skewed, it stays skewed.
- It does not bound your values. A heavy-tailed column produces a heavy-tailed Z column. Outliers stay outliers, just on a new scale.
- It does not align distributions across groups. Two populations with different means and variances will collapse into the same numeric range, which is usually not what you wanted.
If you need any of those properties, you wanted a different transformer: a Box-Cox or Yeo-Johnson for skew, a Winsorizer or robust scaler for outliers, a quantile transformer for distribution alignment. The plain Z-score does exactly one thing, and it does it in linear time.
For a deeper look at how it slots into a feature-engineering pipeline, see the Z-Score Standardizer tool page, which lets you paste a column, choose a reference mean and standard deviation, and watch the output stream row by row.
The three failure modes nobody puts in the textbook
The standard demo column is a clean Gaussian, fitted and standardized on the same data. Production columns are never that. Here is what actually goes wrong, and the order to fix it in.
1. You fit on the wrong slice
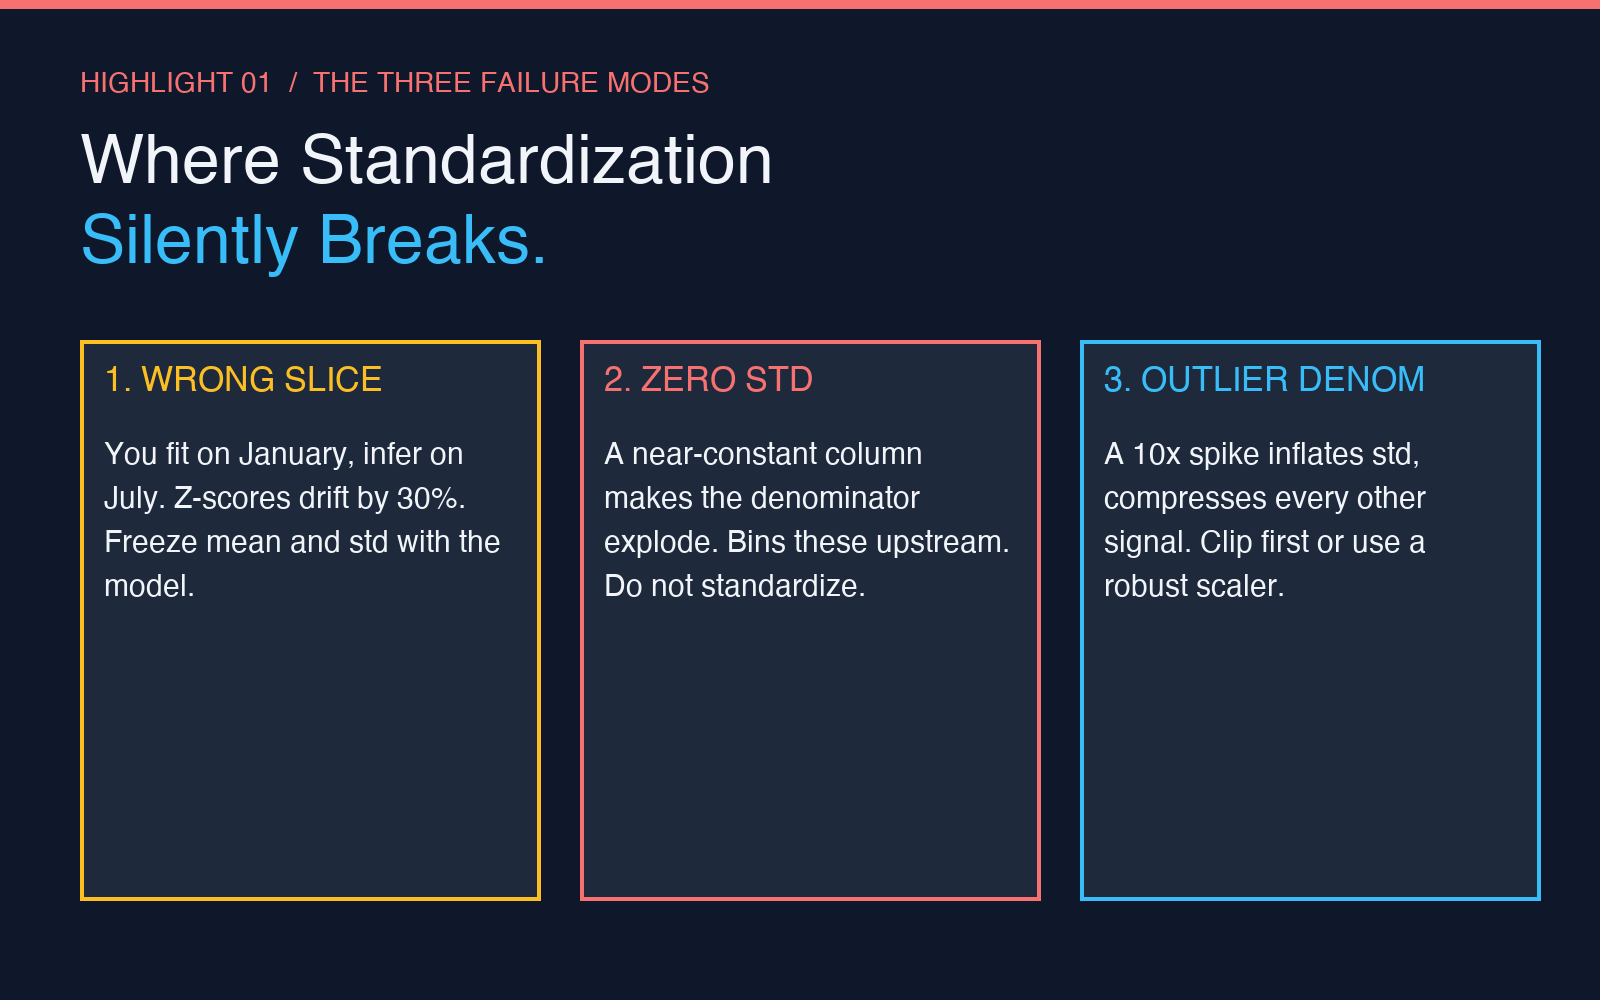
The mean and standard deviation have to be computed on the data that will be compared to the running distribution at inference time. If you train on January traffic and infer on July traffic, and your user behavior shifted by 30% in between, your Z-scores are systematically off by 30%. The fix is not to refit every day; the fix is to log the fitted mean and standard deviation alongside the model artifact and apply them at inference as frozen constants.
This is also why online feature stores insist that the standardization step is part of the feature contract, not part of the training notebook. The notebook is one environment; production is another. The numbers must travel.
2. The denominator can collapse
If your column is near-constant — say, a flag that is almost always zero — the standard deviation is close to zero, and the division blows up. Most libraries guard against this with a small epsilon added to the denominator, but the epsilon choice is rarely documented. A 1e-8 epsilon is fine for float64; it is invisible noise on float32 inference.
The honest answer is to drop or bin those columns upstream and not standardize them at all. Treating them as continuous variables when they are effectively categorical is a design error, not a numerical one.
3. Outliers inflate the denominator
A single 10x spike in your column raises the standard deviation by a small but meaningful amount. Every other value in the column now appears closer to the mean than it really is. The most informative signals get compressed. You can clip the column first, fit a robust scaler (median and IQR), or use a percentile-based transform. Each one makes a different trade-off, and the right one depends on what downstream model is consuming the Z-scores.
A working pipeline in five lines
The boring, reliable shape of a production Z-score step is:
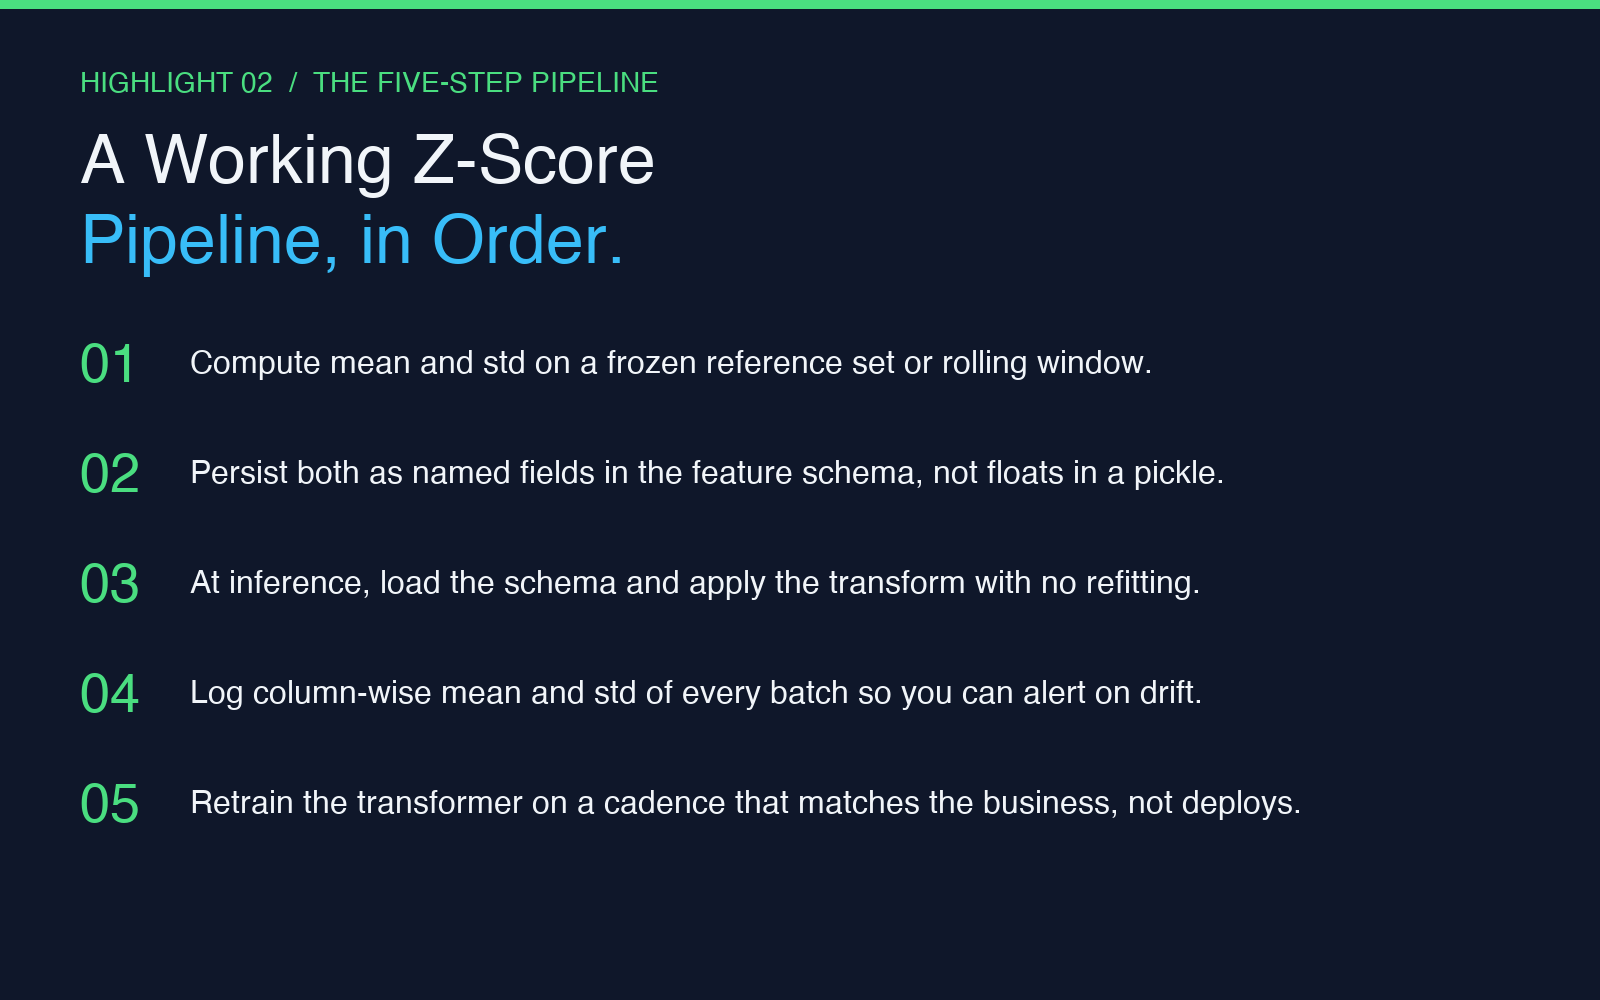
- Compute mean and std on a frozen reference set (or a rolling window with documented decay).
- Persist both as named fields in the feature schema, not as bare floats in a pickle.
- At inference, load the schema, apply the transform with no refitting.
- Log the column-wise mean and standard deviation of every batch so you can alert when they drift.
- Retrain the transformer on a cadence that matches the business, not on every deploy.
If your model accuracy dropped after a deploy and you do not have step 4, you cannot tell whether the upstream distribution moved or your transformer was silently refit on a bad window. That gap is the single most common reason production Z-score pipelines fail silently.
When Z-score is the wrong tool
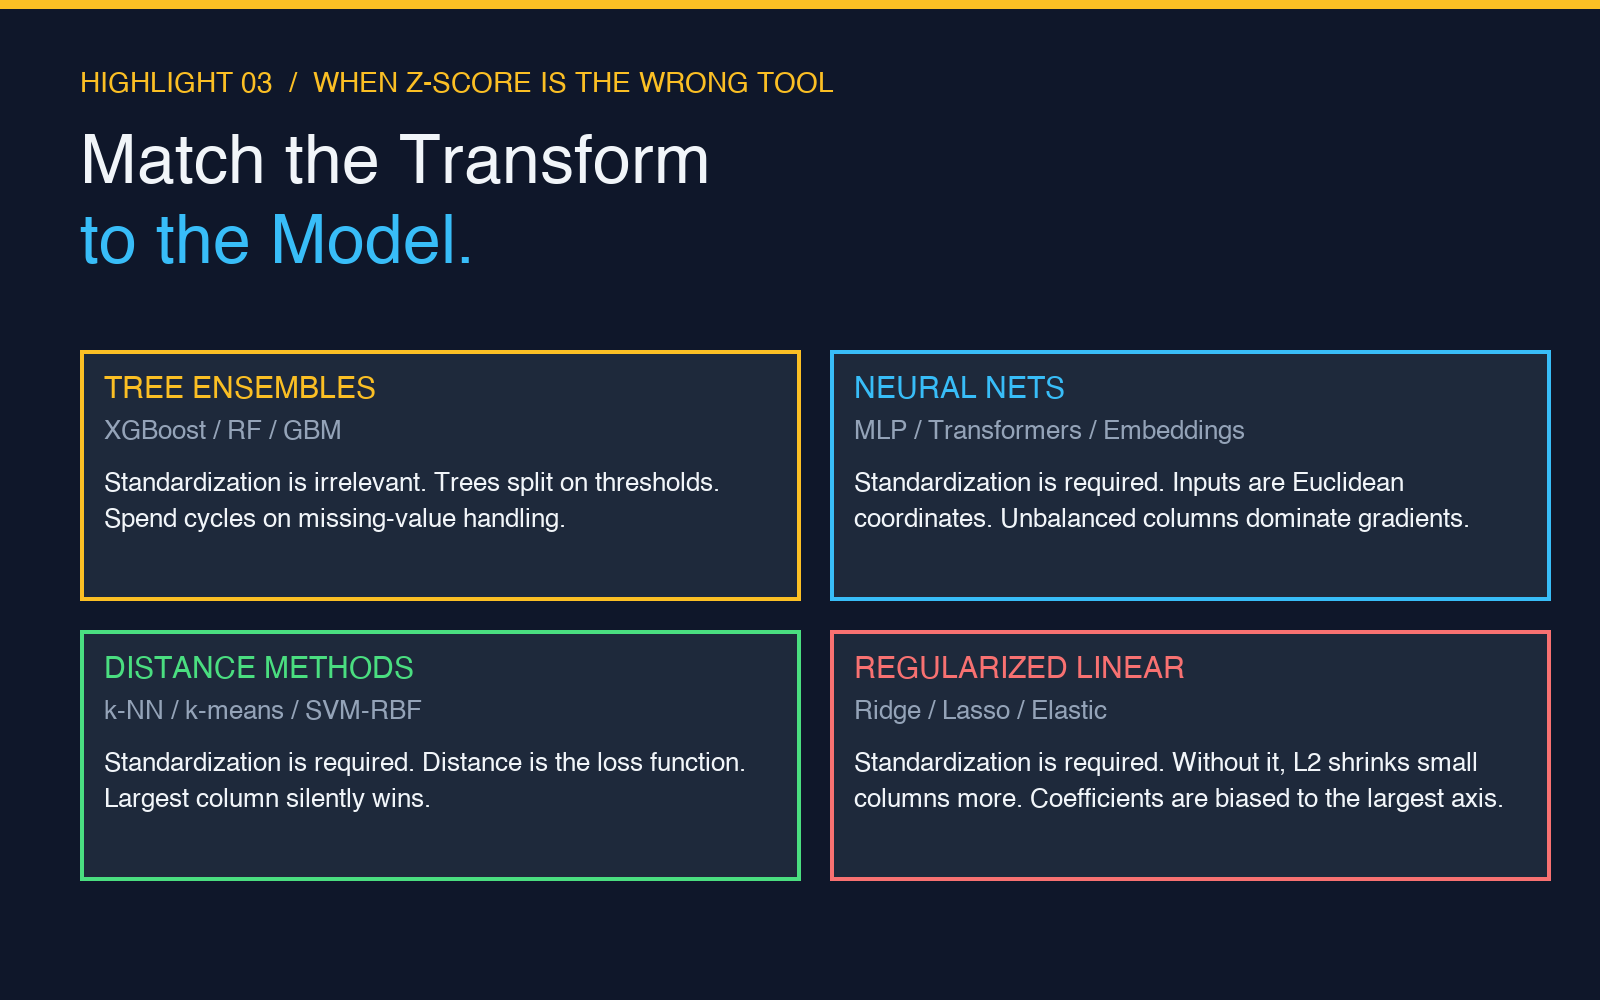
If your downstream model is a tree ensemble — gradient boosting, random forest, XGBoost — standardization is essentially irrelevant. Trees split on thresholds, and rescaling the axis does not change the rank order or the splits. Spend the cycles on missing-value handling and category encoding instead.
If your downstream model is a neural network or a distance-based method (k-NN, k-means, SVM with RBF), standardization is required. The model treats the inputs as coordinates in a Euclidean space, and mixing columns with raw magnitudes will silently let the largest column dominate every gradient step or distance computation.
For linear models with regularization, standardization is required for the regularization to be fair across coefficients. Without it, the L2 penalty shrinks the small-magnitude column more than the large one, which biases the resulting model toward the largest column even after fitting.
Try it on real data
The fastest way to see whether your pipeline actually behaves the way the textbook says is to run a few thousand rows through the tool and compare the output statistics against what your library produced. If they disagree by more than 1e-6, the difference is in the epsilon handling, not in the math.
You can paste a CSV column, a JSON array, or whitespace-separated numbers into the Z-Score Standardizer and inspect the per-row output, the fitted mean, and the fitted standard deviation side by side. It is the kind of small tool that pays for itself the first time it catches a frozen constant that should have been refit.
For more preprocessing utilities in the same family — robust scaling, percentile clipping, normalization ranges — browse the rest of the Elysia Tools data processing collection. They share the same interface, which makes it cheap to A/B compare them on the same input.
The short version
Z-score standardization is one line of arithmetic and ten lines of discipline. It guarantees mean zero and standard deviation one. It guarantees nothing else. The hard part is not computing the transform — it is keeping the fitted constants honest as your data drifts. If you freeze them, log them, and refit on a schedule, the transformer will quietly do its job for years. If you refit on every deploy, it will betray you within a quarter.
Pick the cadence once, write it down, and the rest is bookkeeping.