# 8 Free Interactive Physics Visualizations That Reveal the Hidden Mathematics of Motion
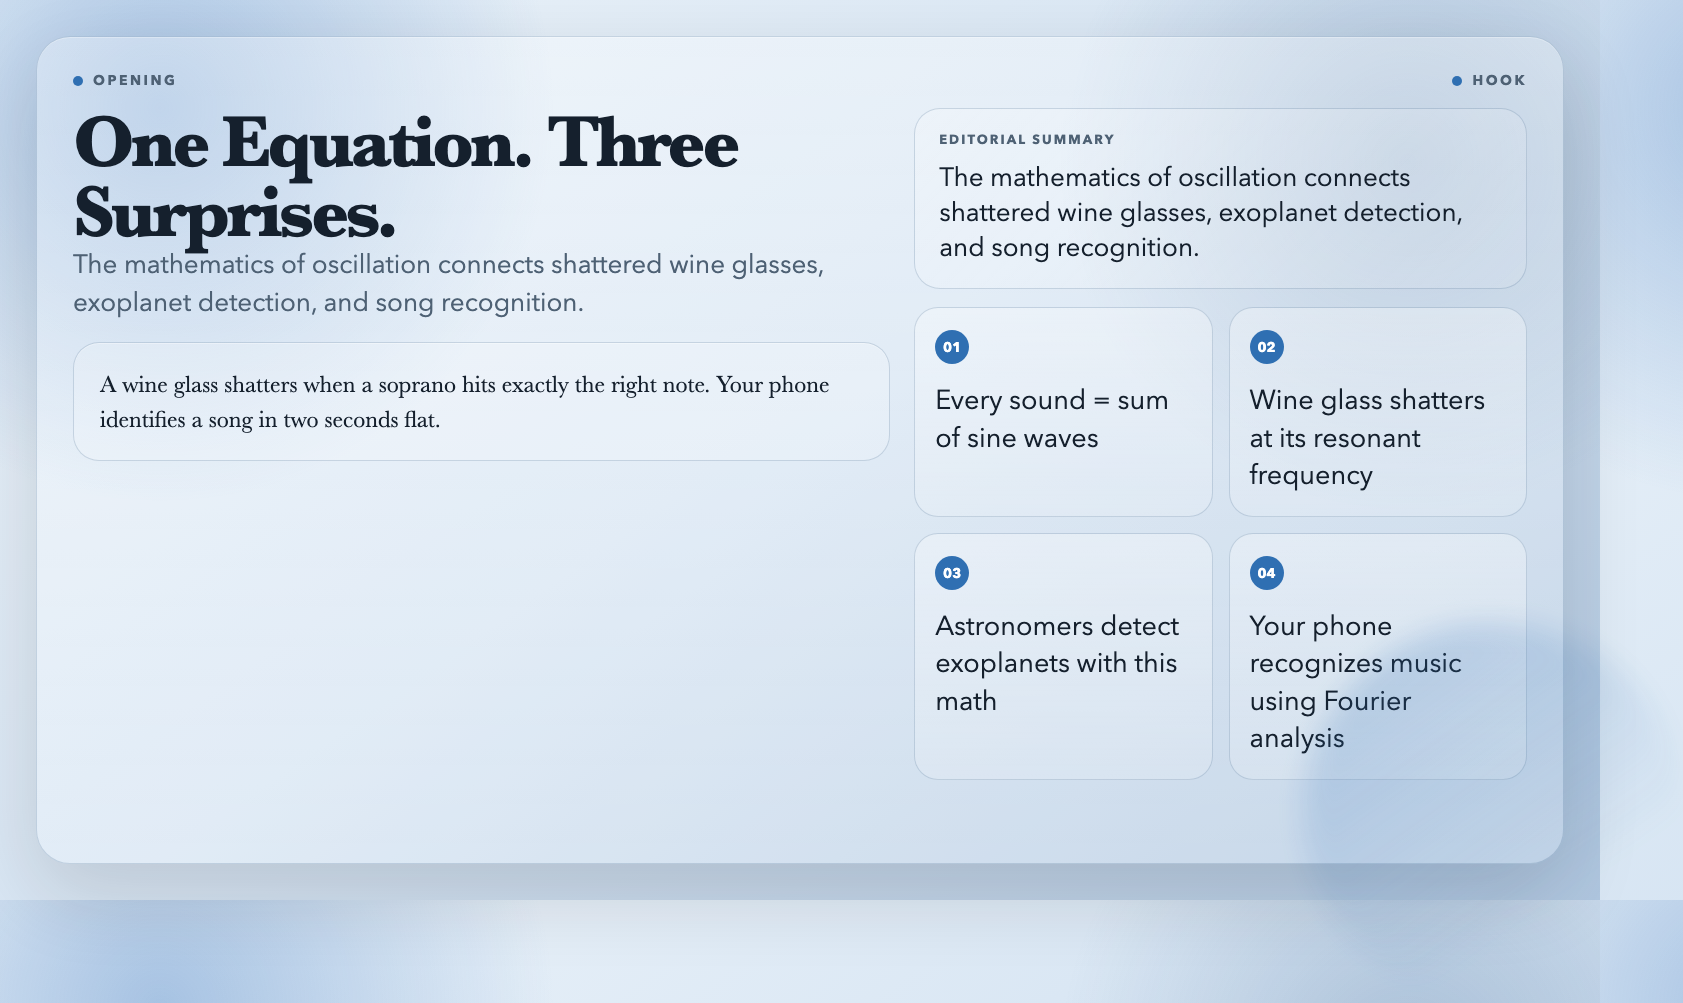
A wine glass shatters when a soprano hits exactly the right note. An astronomer knows a star is rushing away from Earth without ever visiting it. Your phone identifies a song in two seconds flat. All three share the same underlying equation — the mathematics of oscillating systems — and it’s hiding in plain sight inside every sound wave, light beam, and vibrating string you’ve ever encountered.
Most of us learned that waves are important. Far fewer got to see them work. That’s the gap these eight free interactive visualizations exist to fill. They take the abstract equations from physics textbooks and turn them into something you can drag, tweak, and watch in real time.
1. Fourier Series — How Every Sound Is Built From Silence
Try it: Fourier Series Visualization
Here’s a fact that still surprises people: every repeating sound — a violin note, a human voice, a police siren — is mathematically identical to a sum of pure sine waves. No exceptions. This is the Fourier Series, and it took French mathematician Joseph Fourier about 200 years to prove it.
The visualization shows this in action. You add sine waves of different frequencies together and watch the sum converge on any repeating shape you want — a square wave, a sawtooth, even a spike. Drag a slider to change how many frequencies you’re mixing. With just 3–5 frequencies, the result looks jagged and wrong. With 20, it starts looking almost right. With 100, the approximation is nearly perfect.
Why it matters in the real world: Every music streaming service uses this math to compress audio files without audible quality loss — the entire MP3 format is built on Fourier analysis. Your phone’s voice recognition converts sound into frequency data using this principle. Medical CT scanners reconstruct cross-sectional images from X-ray data using it. The WiFi signal your computer receives is decoded using it. Without Fourier, modern communication collapses.
The historical note: Joseph Fourier published his theorem in 1807. It took the scientific community 15 years to fully accept it — Poisson, Laplace, and Lagrange all objected at first. The full proof required concepts (Lebesgue integration) that weren’t invented until 100 years later.
2. Double Pendulum — Where Order Collapses Into Chaos
Try it: Double Pendulum Chaos Visualization
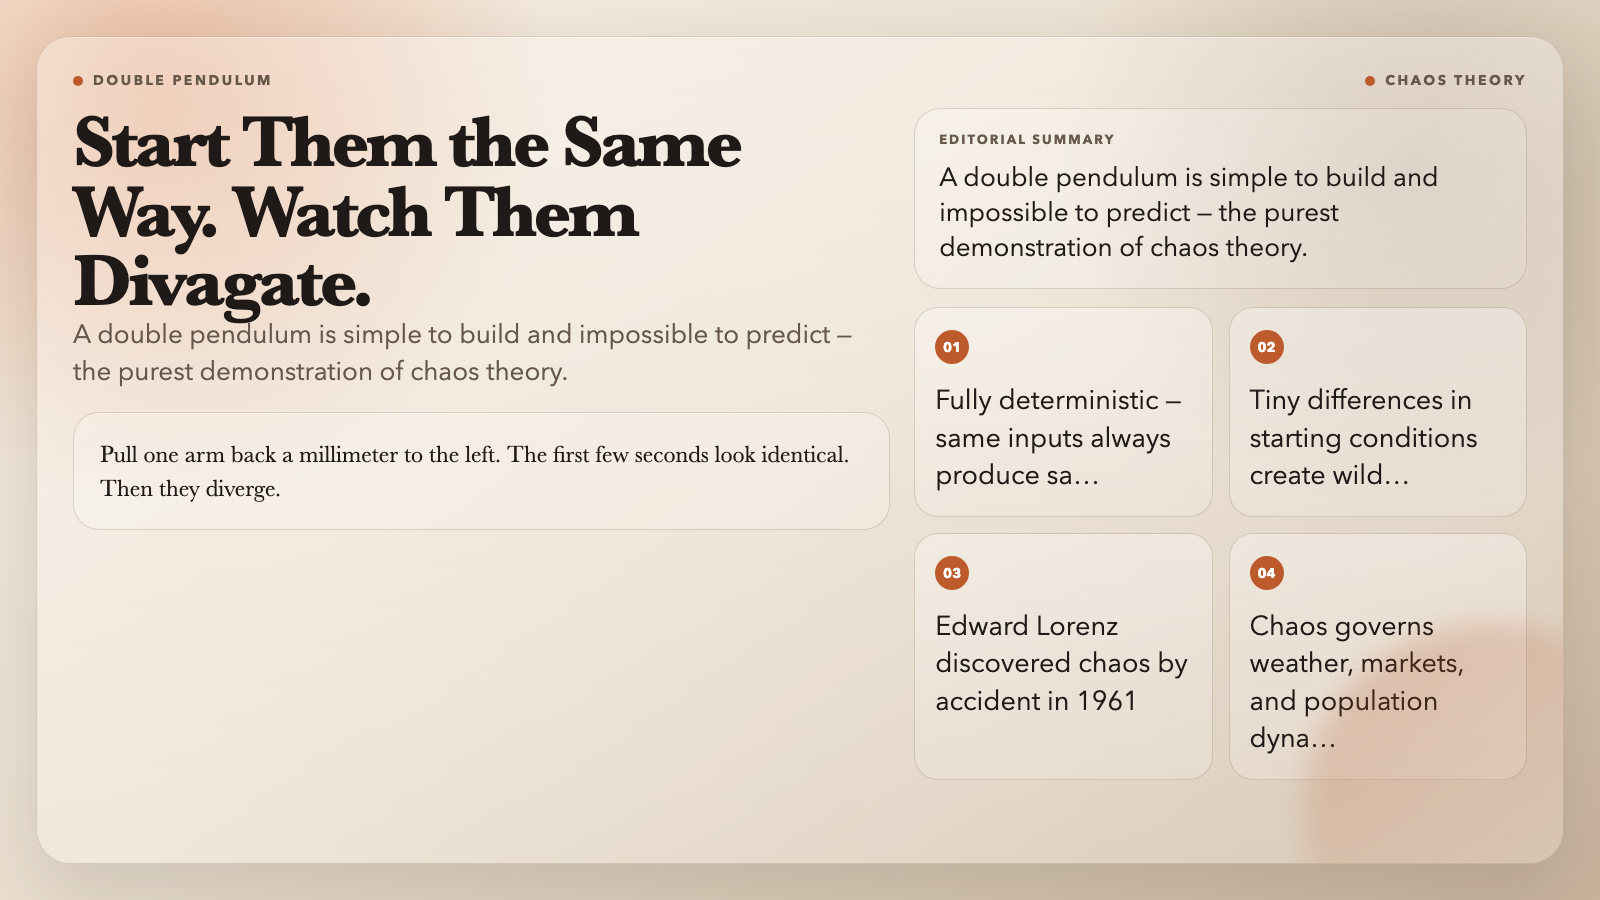
A double pendulum is exactly what it sounds like: a pendulum attached to the end of another pendulum. Simple to build. Impossible to predict.
Pull one arm back a millimeter to the left and release. Watch. Then do it again — same starting angle, same release point. The first few seconds look identical. Then they diverge. Within 30 seconds, one might be swinging left while the other swings right. They’re doing completely different things, even though you started them in what you thought was the same place.
This is chaos theory in its purest form. The system isn’t random — it’s fully deterministic. Same inputs always produce the same outputs. The problem is that tiny differences in inputs produce wildly different outputs. This sensitivity to initial conditions has a formal name: the butterfly effect.
Why it matters: Edward Lorenz discovered it by accident in 1961 when he ran a weather simulation twice and got completely different results: one time he’d typed 0.506 instead of 0.506127. The difference was smaller than a snowflake’s effect on a storm. He published a 1963 paper on it that became one of the most-cited scientific papers in history. The double pendulum makes this tangible in 30 seconds of watching.
The interactive version lets you change the masses and lengths of both arms, then reset from nearly the same starting position and watch the divergence happen again.
3. Lissajous Figures — The Secret Geometry Inside Every Oscillation
Try it: Lissajous Figures Visualization
Set two oscillators running at right angles to each other. One moves horizontally, one vertically. Trace the path. What you get — a loop, a figure-8, a spiral, a tangle — depends entirely on the ratio of their frequencies.
When the ratio is 1:1, you get a straight line or an ellipse. When it’s 2:1, you get a figure-8. 3:2 gives you a pretzel. 5:4 creates something that looks like scribbled handwriting. Change the phase relationship between the two oscillations and these shapes morph again.
These shapes are called Lissajous figures, named after American mathematician Nathaniel Bowditch, who first studied them in 1815. Jules Lissajous got his name attached because he published a cleaner version of the analysis in 1857. (Science history is full of this kind of thing.)
Why it matters: Engineers use Lissajous patterns to check whether two oscillators are running at exactly the same frequency — any drift shows up instantly in the shape. Audio engineers use them to analyze harmonic content. Physicists use them to study resonance. In the 19th century, Lissajous put a vibrating tuning fork in front of a mirror with a sand-covered plate — the patterns that formed told him the exact frequency ratio without needing a stopwatch.
The visualization lets you dial in any frequency ratio and phase relationship and watch the pattern emerge in real time. The moment a figure-8 appears at exactly 2:1, you’ll understand why it once took a decade of careful experiment to discover this.
4. Doppler Effect — Why Sirens Sound Like That
Try it: Doppler Effect Visualization
You hear it every time an ambulance drives past: the siren drops in pitch as it passes you and continues away. You’ve always known this happens. But have you ever seen it?
The visualization shows it. A wave source moves across your screen — a sound wave or a light wave. Watch the wavefronts bunch up in front of the moving source (higher frequency) and stretch out behind it (lower frequency). This is the Doppler effect: the apparent shift in frequency caused by relative motion between source and observer.
It’s not just a curiosity about sirens. Astronomers use it to measure how fast stars are moving toward or away from us. Police radar guns use it to measure your car’s speed. Doctors use ultrasonic Doppler to measure blood flow through your arteries without surgery.
The number that puts it in perspective: Edwin Hubble used this effect in 1929 to prove the universe is expanding. A star moving at just 300 km/s — 0.1% of the speed of light — shows a measurable redshift. The entire modern cosmology rests on this equation.
5. Beat Frequency — The Sound You Hear When Two Sounds Fight
Try it: Beat Frequency Visualization
Play two tones simultaneously — 440 Hz and 442 Hz. You won’t hear two separate pitches. You’ll hear a single tone that seems to pulse, like a very slow vibrato, about twice per second. That pulse is the beat frequency: the difference between the two tones.
This happens because the two sound waves alternately reinforce and cancel each other. When the peaks line up, you get maximum loudness. When a peak meets a trough, they cancel out. The resulting amplitude modulation happens at a frequency equal to the difference between the two sources.
The visualization plays real audio — not just animation. You hear the effect while watching the wave patterns. This is what separates good physics tools from bad ones: the sound and the visualization are synchronized.
Why it matters: Musicians use beat frequency to tune instruments precisely — when two strings sound the same pitch, the beats disappear. Piano tuners have been doing this for centuries. It’s also how some radio receivers work, by mixing two frequencies to extract a third.
6. Wave Superposition — What Happens When Two Waves Collide
Try it: Wave Superposition Visualization
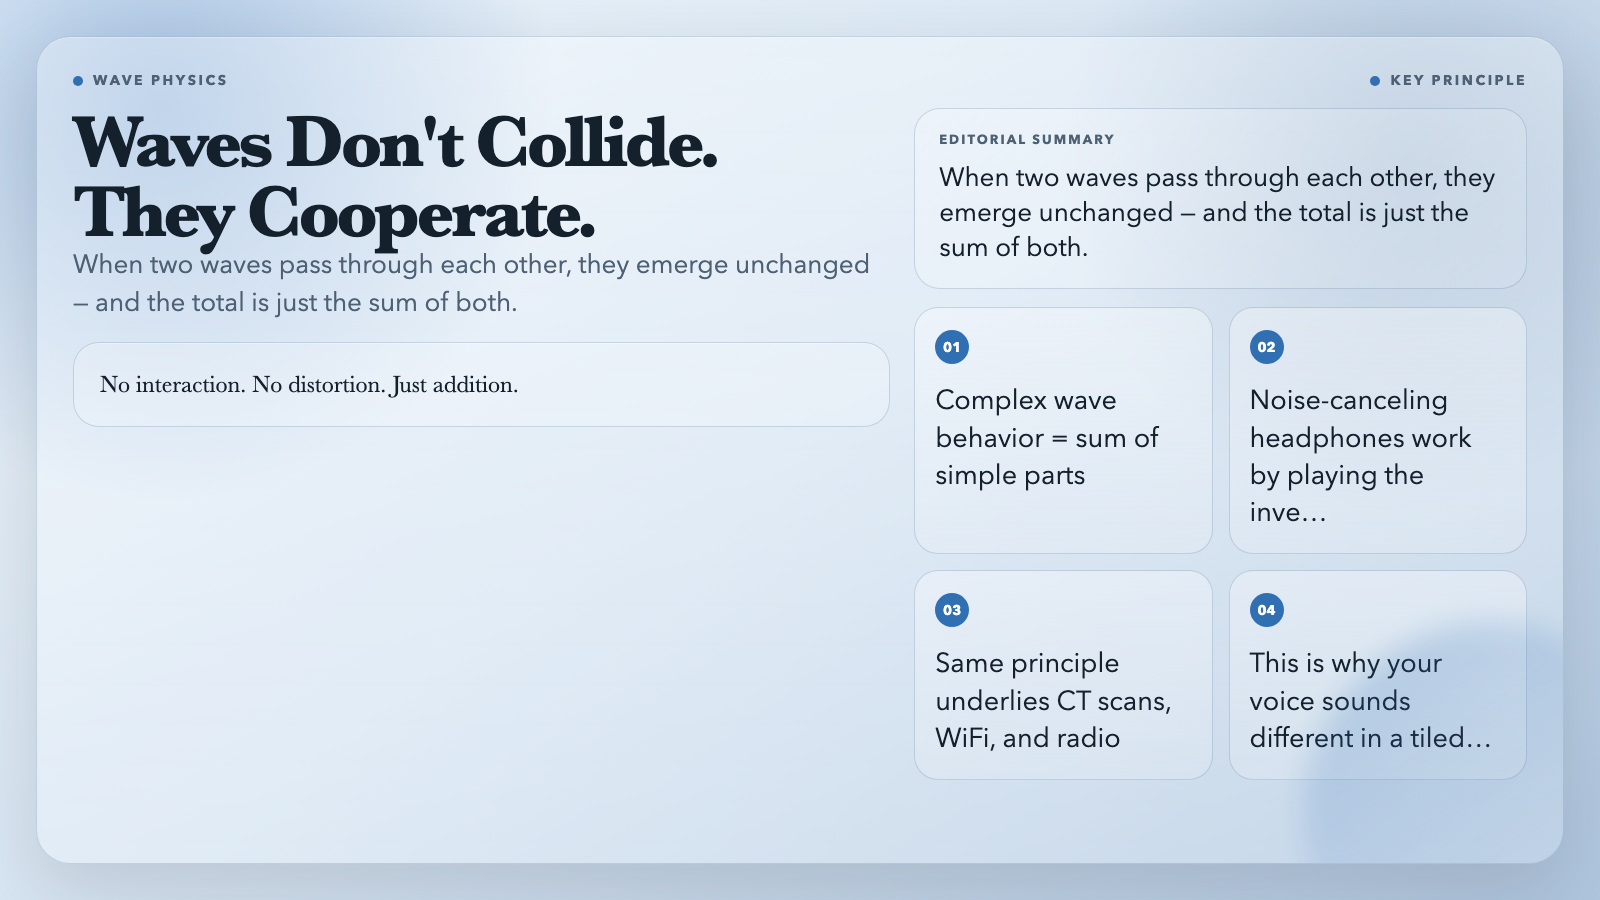
Here’s the rule: when two waves pass through each other, they don’t collide. They pass right through, each preserving its own shape and speed. At the moment they overlap, the total displacement is simply the sum of what each wave would have produced alone.
This is the principle of superposition — one of the most powerful ideas in physics. It means you can analyze complex wave behavior by breaking it into simple components, solving each one, and adding the results together. No interaction. No distortion. Just addition.
The visualization demonstrates this directly. Set up two waves, watch them approach each other, pass through each other, and emerge unchanged. Then turn on the superposition trace — a third line that shows exactly the sum of both waves at every point. This is what a microphone would actually record if it were in the room.
Where it shows up: Noise-canceling headphones use superposition deliberately. They measure incoming sound, compute the inverse wave, and play it back — canceling the noise before it reaches your ear. The math is the same as what this visualization shows.
7. Standing Waves — Why Your Shower Sounds Like an Opera House
Try it: Standing Wave Visualization
Take a rope, tie one end to a wall, and shake the other end up and down. If you shake at the right frequency, the rope forms a pattern: points of maximum motion (antinodes) alternate with points of no motion (nodes). The wave appears to stand still rather than travel. Hence: standing wave.
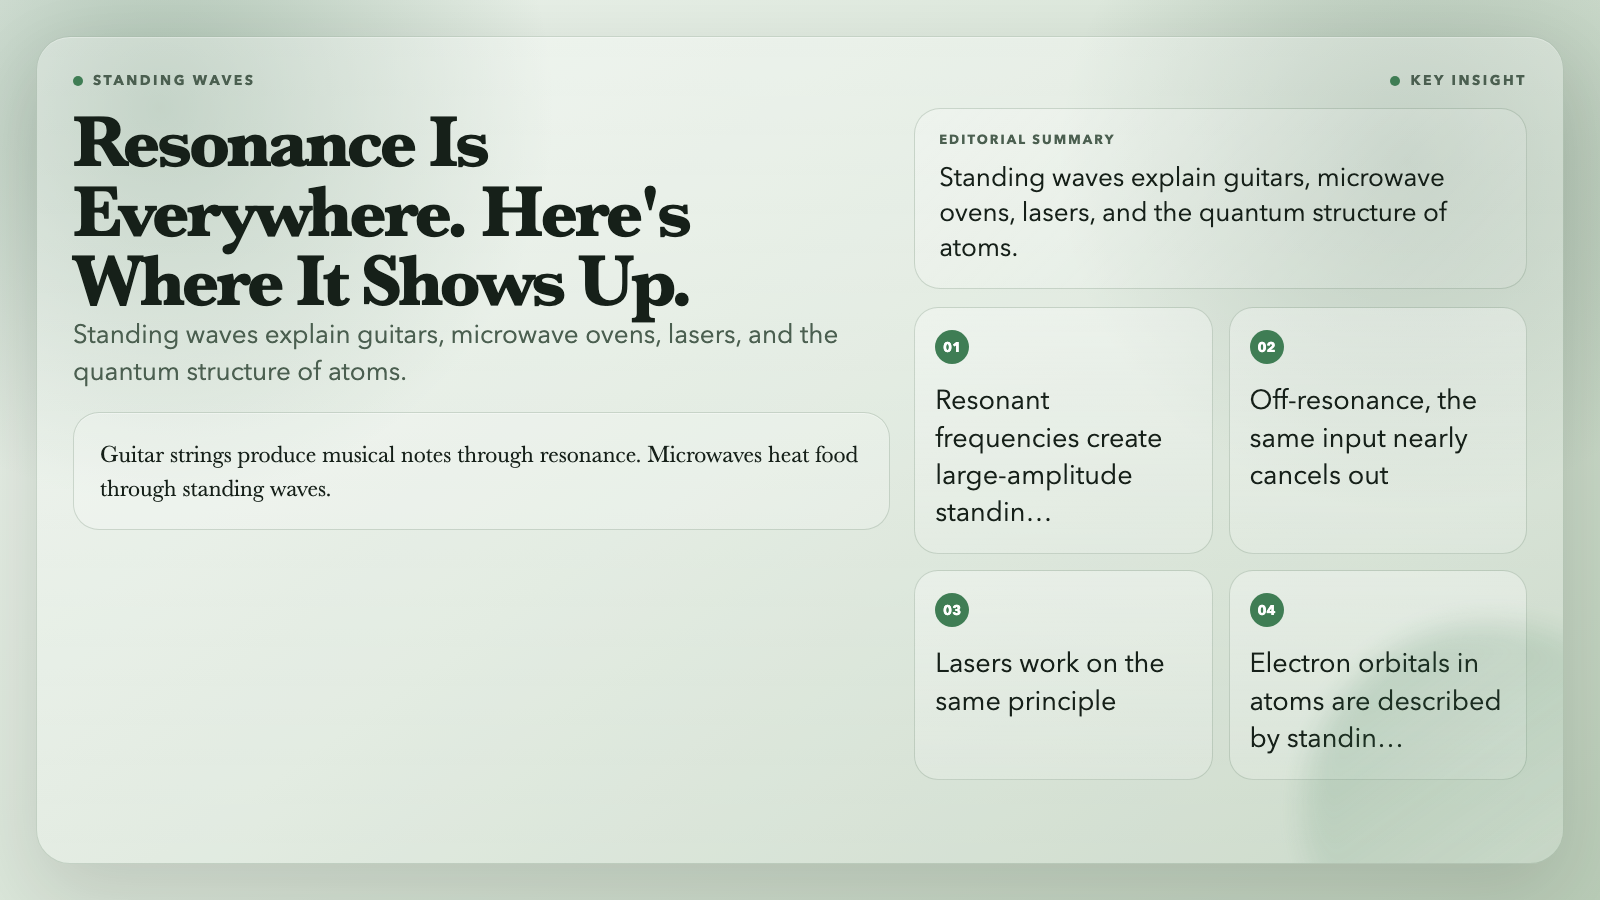
This happens when a traveling wave reflects off a boundary and interferes with the incoming wave. At certain frequencies — resonant frequencies — the reflected wave and incoming wave reinforce each other, creating a large-amplitude standing pattern. At other frequencies, they cancel out.
The visualization shows standing waves on a string, with adjustable tension, length, and driving frequency. Watch the amplitude spike when you hit a resonant frequency. Watch it collapse when you move slightly off-resonance.
Why it’s one of the most important concepts in physics: Standing waves are how guitar strings produce musical notes. They’re how microwave ovens heat food (the microwaves reflect off the metal walls and create standing wave patterns — which is why rotating your food helps). They’re how lasers work. They’re how the electron orbitals in atoms are described. Resonance is everywhere.
8. Simple Pendulum — The First Equation That Deserved a Nobel Prize
Try it: Simple Pendulum Motion
A pendulum swinging back and forth looks simple. It is simple — but not in the way most people think.
The period of a simple pendulum (how long it takes to complete one full swing) depends on two things: the length of the string and the local gravitational acceleration. It does not depend on the mass of the bob or the amplitude of the swing (for small angles). This is surprising, because most physical systems are more complicated than this.
Galileo discovered this around 1602, watching a chandelier swing in the Pisa cathedral and timing it with his pulse. It took about 60 years before Dutch scientist Christiaan Huygens built the first pendulum clock using this principle — the most accurate timekeeping device that had ever existed.
The visualization shows the pendulum in real time, with energy bars showing kinetic and potential energy trading off as it swings. Watch the total energy stay constant — conservation of energy made visible.
Why it still matters: The simple pendulum is the prototype for simple harmonic motion — the behavior of any system that experiences a restoring force proportional to displacement. Springs. Atoms in a crystal lattice. LC circuits. Torsion balances. Understanding the pendulum is understanding a vast portion of classical physics.
The Thread That Connects All of Them
What links these eight visualizations is something deeper than their subject matter. Each one demonstrates a principle that sounds abstract until you see it in action — and then becomes impossible to unsee.
The Fourier Series shows that complexity is just simplicity stacked. The double pendulum shows that simplicity can still be fundamentally unpredictable. Wave superposition shows that waves don’t interfere with each other — they cooperate. Standing waves show that boundaries change everything. And the pendulum shows that the universe has recurring patterns that transcend the specific physical system.
There’s a version of this article that cites 47 papers and explains every equation. That’s not what these visualizations are for. They’re for the moment when the concept clicks — when you see the standing wave nodes appear and suddenly understand why a cello sounds different from a violin, even though both are just strings. When the Lissajous figure closes on itself and you understand why certain frequency ratios sound consonant and others sound dissonant.
You can read about any of these for hours. Or you can spend 10 minutes with the interactive visualization and come away with an intuition that no textbook can fully replicate. That’s the deal these tools offer — and all eight are free, interactive, and running in your browser right now.
Which one will surprise you most? Probably the one you expected to be boring.