Your regex returns the expected match on 3 sample strings, so is the job done? We often say yes, but that answer is broken: the final match hides every failed branch, repeated scan, and capture that the engine tried first. A pattern can look correct yet burn time on the wrong path. The fix is to inspect the trace, not merely celebrate the green result.
A match result is a receipt, not an explanation
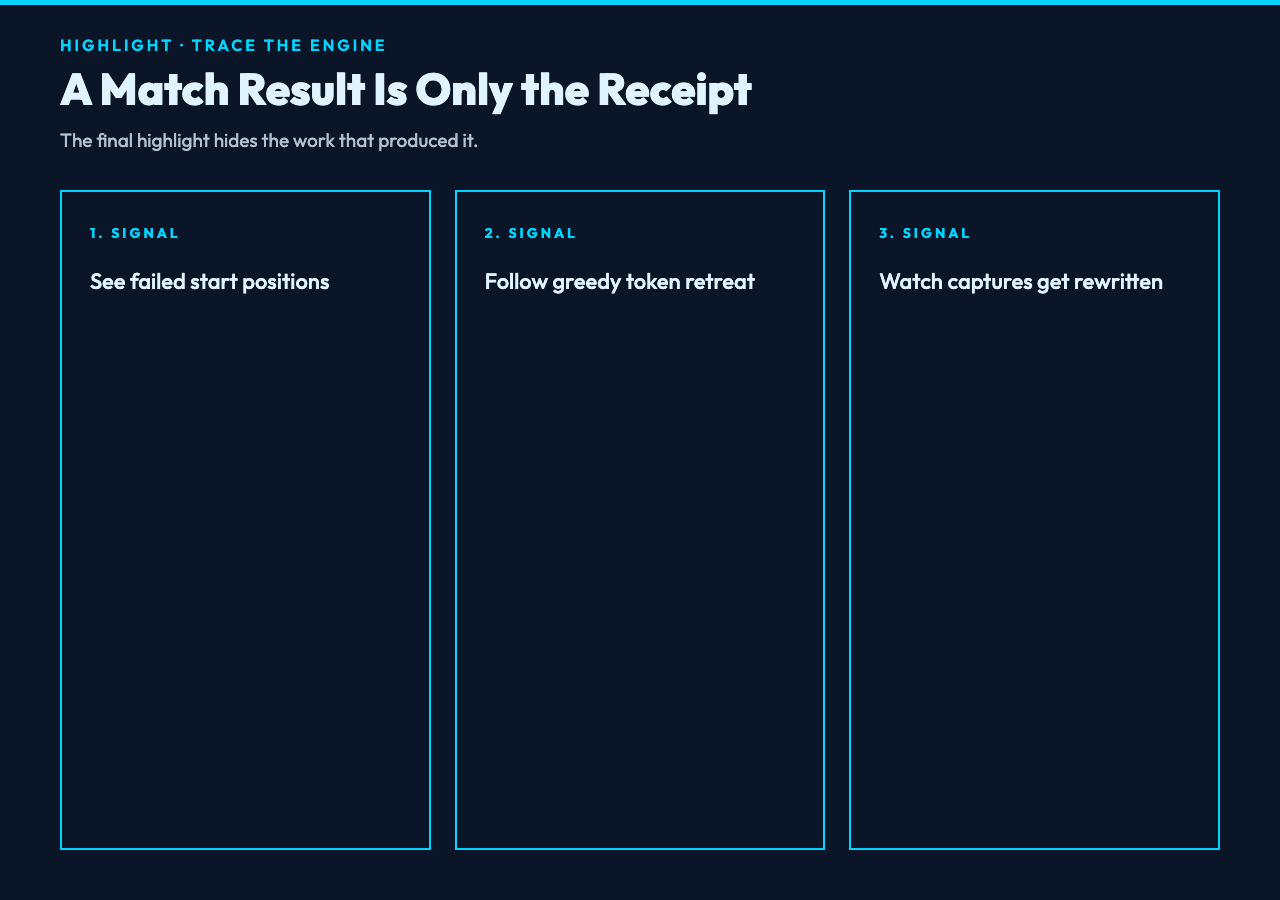
Most regex testers show two things: the pattern and the substring it matched. That is useful, but it compresses a sequence of decisions into one answer. It does not show where the engine began, which token failed, how far a greedy quantifier advanced, or why the matcher returned to an earlier position.
The Regex Debugger on Elysia Tools opens that black box. It steps through a regular expression against test text position by position and visualizes match attempts, partial successes, backtracks, and captures. Instead of asking only “Did this match?”, you can ask “What work produced this match?”
That distinction matters because correctness and behavior are separate properties. A pattern can return the right substring today while still being fragile, slow, or difficult to maintain when the input changes.
Start with the smallest trace that can surprise you
Use a short pattern, short text, and one clear question. The tool manifest itself offers a practical baseline: pattern \d+, flag g, and test text Order 42 ships in 7 days. The result is easy to predict, so attention can move from the answer to the engine’s route.
Watch where the first attempt begins. The matcher tests the opening letters before it reaches 4. Once the digit token succeeds, the + quantifier extends the match through 2. The global flag then resumes scanning and eventually captures 7.
For example, this trace clarifies three different events that a highlighted result merges together: failed starting positions, successful token consumption, and the next global search. That is why a tiny case is more useful than pasting a 300-character production pattern into the debugger on the first run.
Greedy tokens create work you cannot see
Consider a pattern that tries to capture text inside delimiters. A greedy token may consume farther than intended, reach the end, fail on the closing condition, and then retreat one character at a time. The final capture might still look perfect. The hidden route is the problem.
A trace turns “regex magic” into a sequence of testable choices. If one token advances too far, you can replace it with a narrower character class, add an explicit boundary, or restructure the group. Each change should cut unnecessary states, not merely change the final highlight.
In our case, the best optimization is often semantic. Replace “any character until something works” with “the characters this field can legally contain.” A precise token reduces ambiguity, clarifies intent, and makes the pattern easier for the next engineer to review.
Backtracking is normal until failure makes it multiply
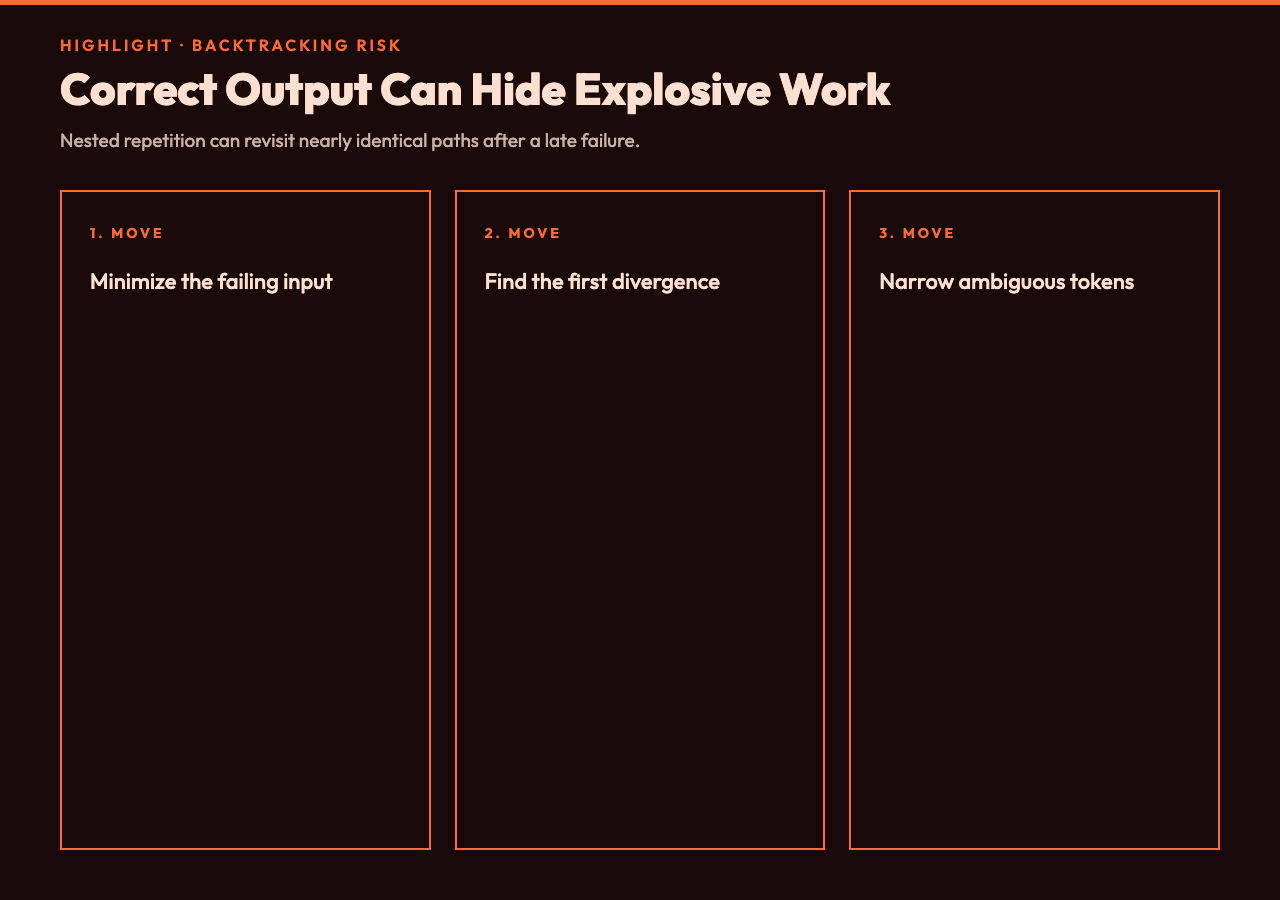
Backtracking is not automatically a bug. Regex engines use it to explore alternatives, and a small amount is expected. The warning sign is repeated exploration of nearly identical paths, especially when nested quantifiers can partition the same text in many ways.
A classic diagnostic shape is a repeated group that contains another repetition, followed by a token that fails near the end. With a pattern such as (\d+)+X, a long run of digits followed by the wrong final character can force the engine to reconsider how those digits were divided among repetitions. Do not use that example to benchmark a live service; use a short input to understand the mechanism safely.
According to the real Risky Regex Patterns samples, catastrophic backtracking can produce exponential work and create denial-of-service risk. The same collection includes unanchored validation, excessive greedy matching, and inefficient lazy quantifiers. Those are useful companion cases because they show that the trace is not only a teaching aid; it is a way to recognize performance and correctness smells before deployment.
Captures reveal whether the pattern models the data
Capturing groups are often treated as an afterthought: if group 1 contains something, the regex seems fine. A debugger lets you follow when a group opens, what it consumes, and whether backtracking rewrites its final value.
Try a small email-like example such as (\w+)@(\w+) against a controlled string. Then add punctuation or a domain suffix. The first version may capture only part of what a reader considers the address. The trace shows that the engine did exactly what the tokens requested; the pattern’s model was incomplete.
The Common Regex Patterns collection provides concrete validation and matching cases, including email addresses, HTTP/HTTPS URLs, IPv4 values, ISO dates, usernames, UUIDs, and hexadecimal colors. Use one as a baseline, then change a single input property. That controlled contrast helps you see which token encodes the assumption.
A 4-pass debugging workflow
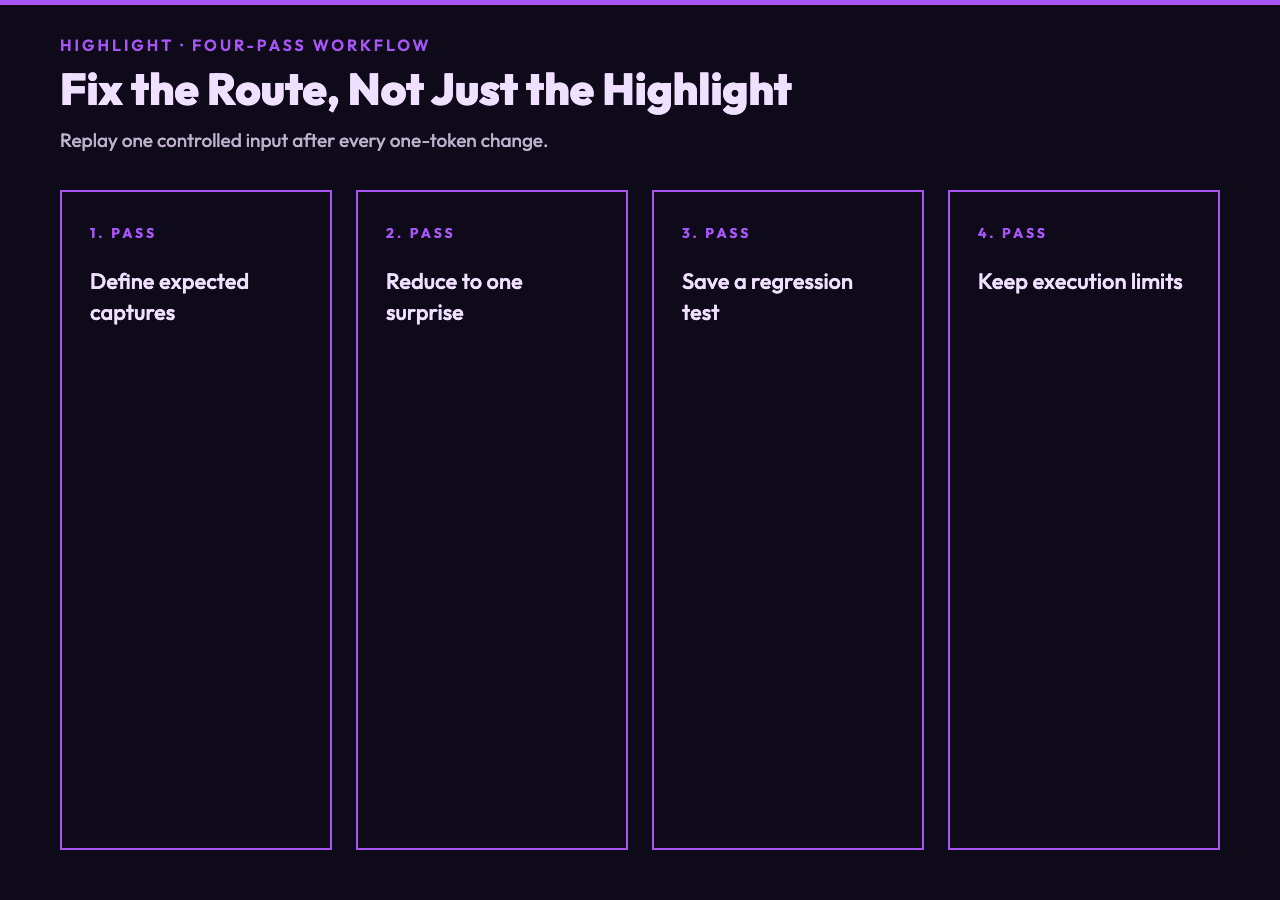
First, define the expected match and expected captures before running anything. If the target is vague, the trace cannot tell you whether the pattern is correct.
Second, minimize the failing input. Cut unrelated characters until removing one more character makes the surprising behavior disappear. This reduces the trace and exposes the decision that matters.
Third, find the first divergence, not the final failure. Look for the earliest position where the engine takes a path you did not expect: an alternative wins, a quantifier over-consumes, or a boundary passes where it should stop.
Fourth, change one token and replay the same input. A good fix should improve both the result and the route. If the match changes but the trace still repeats the same ambiguous work, you have moved the symptom rather than removed the cause.
This workflow builds evidence. It also creates a compact review artifact: pattern, minimal input, expected captures, first divergence, and the one-token fix.
Put the trace beside your tests
A debugger does not replace unit tests, fuzzing, input limits, or a ReDoS scanner. It explains why one case behaves as it does. Tests prove that named cases return expected outcomes; fuzzing expands the input space; production guards cap the damage from inputs you did not predict.
The trace belongs between discovery and prevention. When a test fails, use it to clarify the engine’s choices. When a performance scan flags a pattern, use it to show the repeated paths. Then fix the regex, add the minimized input as a regression test, and keep an execution limit at the service boundary.
The point is not to make every developer memorize a regex engine. It is to replace guesswork with a visible chain of decisions. Ultimately, a green match answers only what happened once; the trace shows why it happened and what might happen next. If one extra character can multiply the engine’s work, would you rather discover that in a 20-step walkthrough now, or in a production request that never returns?