
Every introductory genetics textbook teaches the monohybrid cross first: two heterozygotes (Aa × Aa) produce a 3:1 phenotype ratio and a 1:2:1 genotype ratio. Then the chapter introduces incomplete dominance and codominance as “non-Mendelian” exceptions, and the same square is redrawn with different ratios. The Punnett grid stays identical — the phenotype interpretation is what changes. A Mendelian Punnett square calculator that supports all four modes (complete dominance, incomplete dominance, codominance, X-linked) makes the difference visible without forcing you to memorize five separate ratio tables.
The four modes are phenotype interpreters, not grid reshapers
A Punnett square is a counting device. Each cell represents one equally-likely combination of gametes from two parents, and the cell count does not change with the inheritance mode. What changes is the label that gets attached to each genotype:
- Complete dominance — uppercase (dominant) allele masks the lowercase (recessive) allele.
Aalooks the same asAAon the phenotype side; the ratio becomes 3 dominant : 1 recessive. - Incomplete dominance — neither allele is fully dominant. Heterozygotes
Rrshow a blended phenotype (red × white → pink). The phenotype ratio becomes 1 : 2 : 1, matching the genotype ratio exactly. - Codominance — both alleles are independently expressed.
ABshows both A and B simultaneously (AB blood type, roan cattle). The phenotype ratio also becomes 1 : 2 : 1, but the middle term is “both” rather than “blend.” - X-linked — only the sex-chromosome carrier matters. A male (XY) has one copy, so the recessive allele always shows. Each offspring cell is also marked by sex because inheritance is asymmetric by sex.
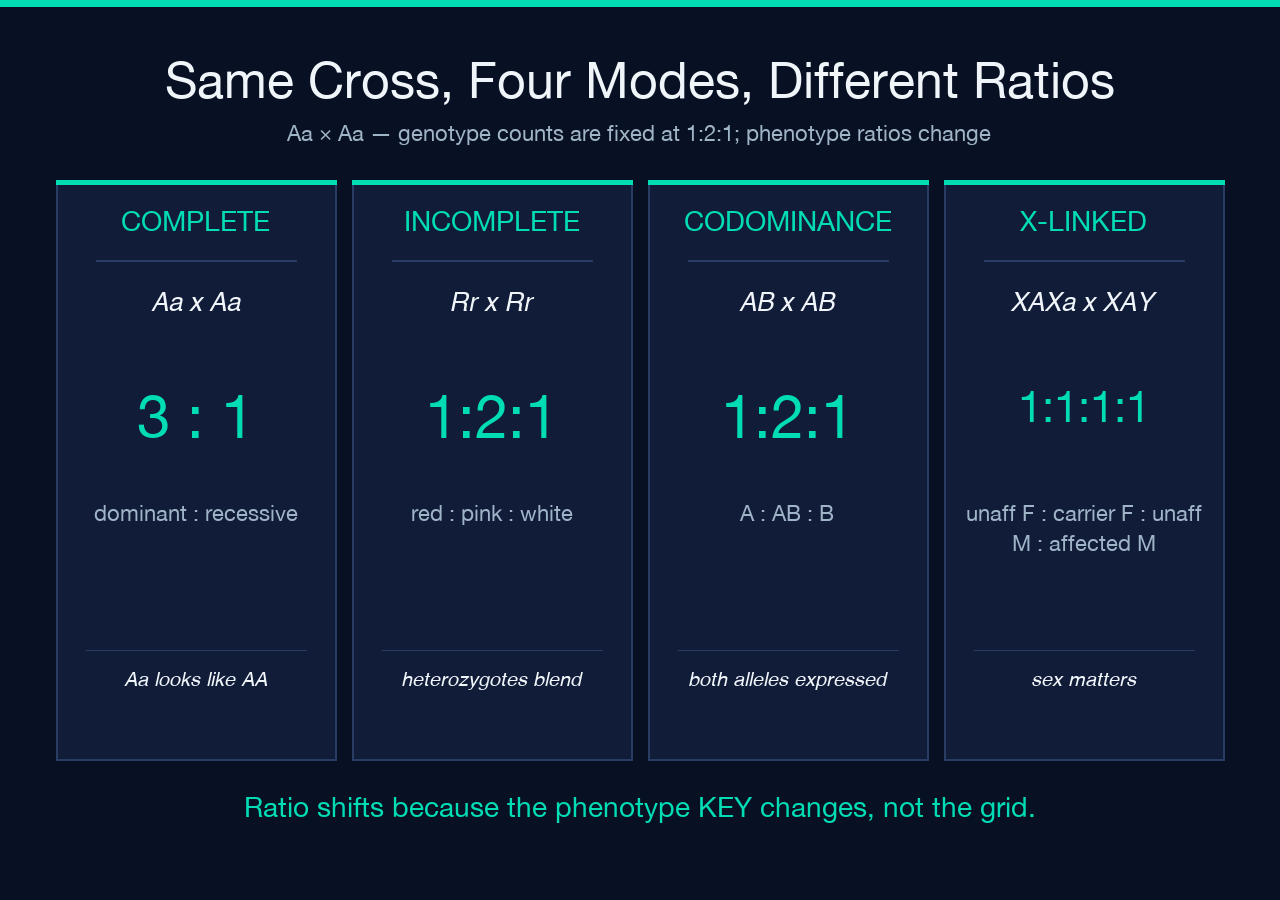
The grid is the same; the phenotype key is what flips. This is the first place students go wrong: they draw the square correctly, then mislabel the cells because they conflate the two non-Mendelian modes.
Why “incomplete dominance” and “codominance” get confused
The 1 : 2 : 1 phenotype ratio appears in both modes, which is the trap. A student who sees 1 : 2 : 1 and writes “blended” for Rr when the parents are red and white carnations is correct. The same student writing “blended” for IAIB in human blood typing is wrong — a heterozygote is type AB, not a “blend” of A and B antigens. The biochemical reality is different: blending means a single intermediate product (one wavelength of pink pigment), while codominance means two complete products coexisting (both antigen glycoproteins on the cell surface).
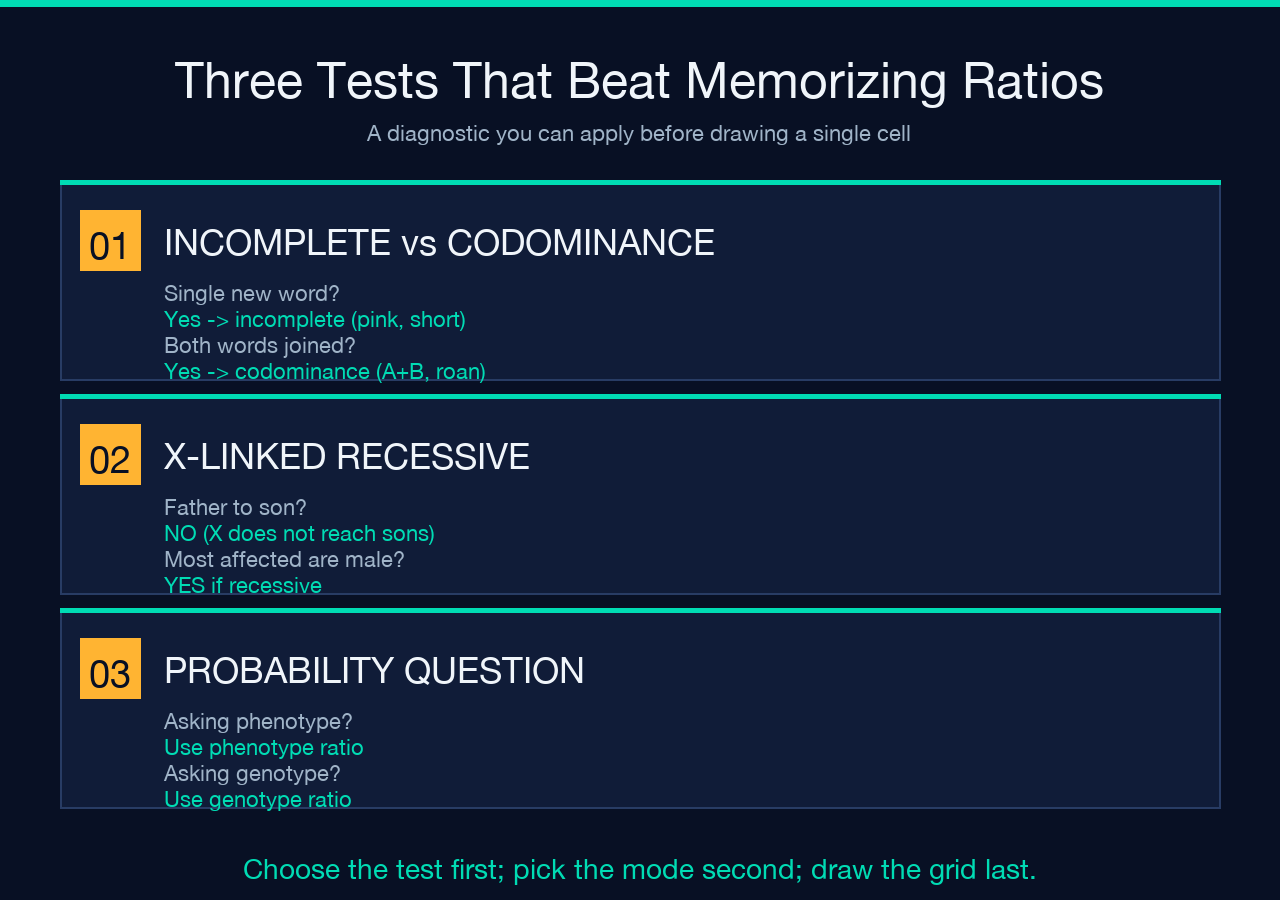
A reliable test: if you can describe the heterozygote with a single new word (pink, short, diluted), it is incomplete dominance. If you can describe it by listing both parental phenotypes joined with “and” or “+” (A and B, striped and dotted), it is codominance. Most errors at exam time come from choosing the wrong test, not from miscalculating the grid.
Why X-linked crosses trip up the grid algebra
For autosomal crosses, every parent contributes two gamete alleles, and the square is square (n × n for n distinct gametes). For X-linked crosses the gamete set is asymmetric: a mother (XX) contributes one of her two X alleles, a father (XY) contributes either his X allele (to daughters) or a Y (to sons). The grid still counts equally-likely combinations, but every cell must be paired with the offspring’s sex — a male child’s genotype is XaY, never XaXa, and the recessive phenotype is fully expressed because there is no second X to mask it.
Two practical consequences follow:
- Recessive X-linked traits appear mostly in males. A carrier mother (
XAXa) and a non-affected father (XAY) produce four equally-likely cells, but two of them are male and the male cells show the recessive phenotype 50% of the time overall — even though the allele itself is only in 25% of all gametes. - Affected fathers cannot pass the trait to sons. A father gives his Y to sons, so the X-linked allele stays confined to daughters (as carriers if the mother is unaffected). This is why color blindness and hemophilia skip generations through paternal lines.
A calculator that marks sex inside each cell removes the bookkeeping. You still have to interpret the ratio correctly — but you stop writing nonsense genotypes like XaY × Y for a daughter.
How the calculator handles the parsing edges
Notation for X-linked crosses is inconsistent across textbooks. The tool accepts any of:
XAXa— no separator, X implied before each alleleX^A X^a— caret superscript formXa— single-letter for a male allele (Y implied)A,afor the alleles field when mode is X-linked — the calculator normalizes and re-emits the canonicalXform in the output
For autosomal crosses the same input parser rejects single-letter genotypes (you must type two alleles for an autosomal parent) but accepts both uppercase-first and lowercase-first notation. The phenotype output always uses dominant-first ordering (Aa, never aA) so ratios compare cleanly between rows.
A worked example: color blindness carrier cross
Trait: Color blindness (X-linked recessive). Alleles: A (normal), a (color-blind). Mode: X-linked. Parent 1 (mother, carrier): XAXa. Parent 2 (father, unaffected): XAY.
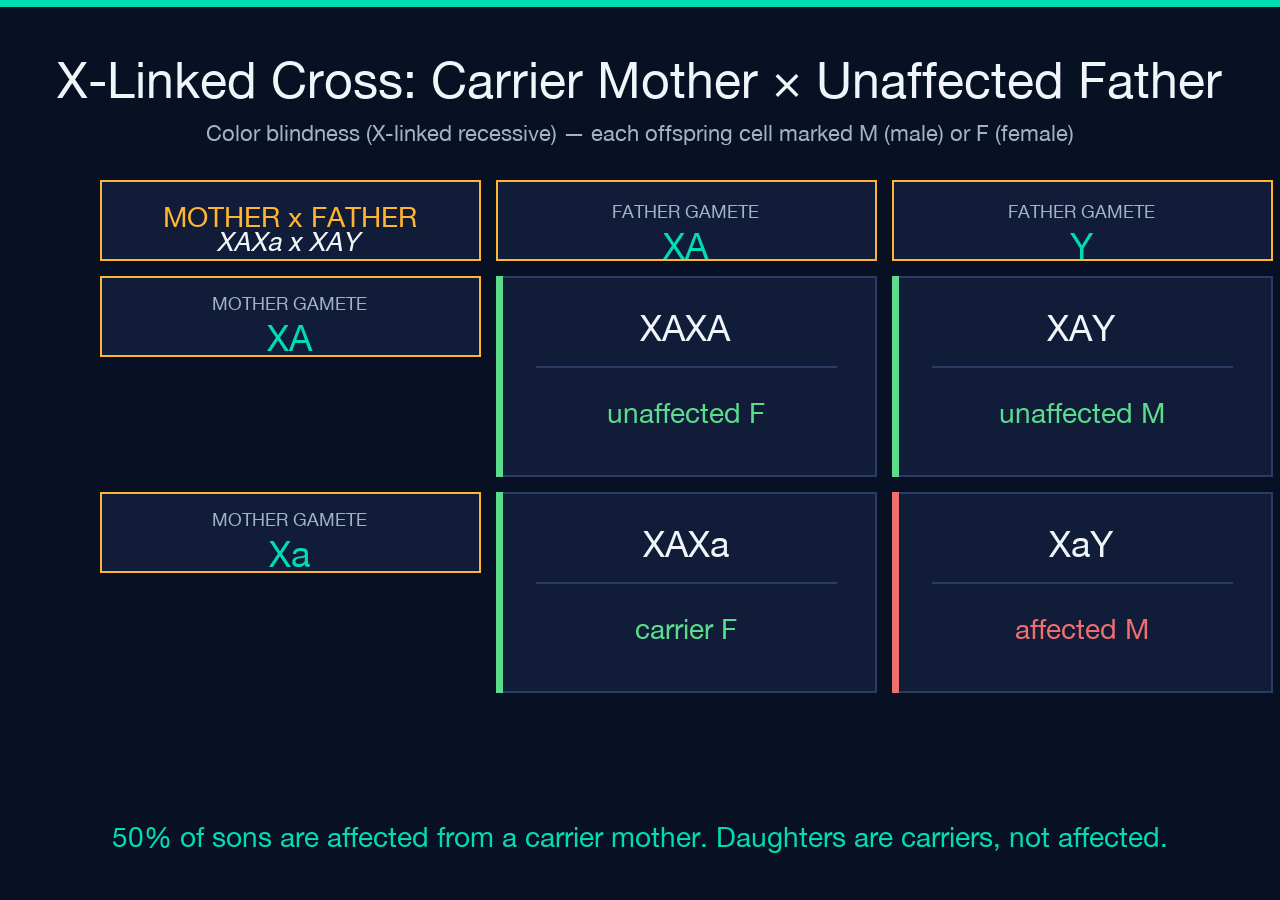
The grid has two rows (mother’s gametes: XA, Xa) and two columns (father’s gametes: XA, Y):
XA×XA→XAXAfemale, unaffectedXA×Y→XAYmale, unaffectedXa×XA→XAXafemale, carrier (unaffected but carrying the allele)Xa×Y→XaYmale, affected
Genotype ratio: 1 XAXA : 1 XAXa : 1 XAY : 1 XaY. Phenotype ratio over the four equally-likely cells: 1 unaffected female : 1 carrier female : 1 unaffected male : 1 affected male. Both unaffected mother and carrier mother produce exactly half affected sons — but only the carrier produces affected sons at all when paired with an unaffected father. This is the textbook outcome, and a good Punnett square calculator lets you flip the mother between XAXA and XAXa to see the affected-son probability drop from 50% to 0% without redrawing the grid by hand.
Common errors a calculator won’t catch
Even with a clean grid and a correct mode selector, three errors survive:
- Wrong mode for a polygenic trait. Skin color in humans is not a single gene. A Punnett square for one gene of many produces a 1 : 2 : 1 (or 3 : 1) ratio that doesn’t match the actual distribution; the tool is not the limitation, the model is.
- Assuming X-linked recessive without checking the pedigree. If a trait passes from father to son, it is autosomal dominant (or Y-linked), not X-linked recessive. Always verify the mode from the family pattern before drawing the square.
- Reporting phenotype counts when the question asks for probability of a specific genotype. “What is the chance this child is a carrier?” needs the genotype ratio, not the phenotype ratio. The grid gives you both, but only one answers the question.
Try it without installing anything
The tool runs entirely in the browser, accepts pasted genotype strings, and exports the full grid plus both ratios as a self-contained HTML block. You can paste monohybrid, dihybrid, incomplete-dominance, codominance, and X-linked crosses in any order and compare the outputs side by side. For homework it doubles as a check against hand-drawn squares; for MCAT-style review it is a faster way to internalize the four phenotype interpreters than redrawing the same grid five times with different labels.
Explore the Mendelian Punnett Square Calculator on Elysia Tools, or browse more teaching utilities at elysiatools.com/en/tools.
