
Three notations walk in together. When a student sees 1/2 for the first time, they are looking at the same quantity they will later meet as 0.5 and as 50%. The equivalence is exact — it is not an approximation, not a rounding, and not a convention. The Fraction / Decimal / Percent Visual Tutor at Elysia Tools is built on one bet: if you draw all three at once, side by side, the equivalence stops being a fact to memorize and becomes a thing the eye can verify.
This field guide is for teachers, tutors, and parents who already understand the equivalence and want a tool that lets the student see it. We will walk through five visual models the tutor renders from a single source value, three input modes the pane accepts, four repeating-decimal stories that decide whether a fraction terminates, and a five-minute lesson plan you can run today.
Five Visual Models That Sync From a Single Source
The tutor takes one quantity — say 3/4 — and renders it as five linked visualizations in a single pane. Move the per-mille slider and every model moves with it. Change the source from fraction to decimal and every model re-renders to match.
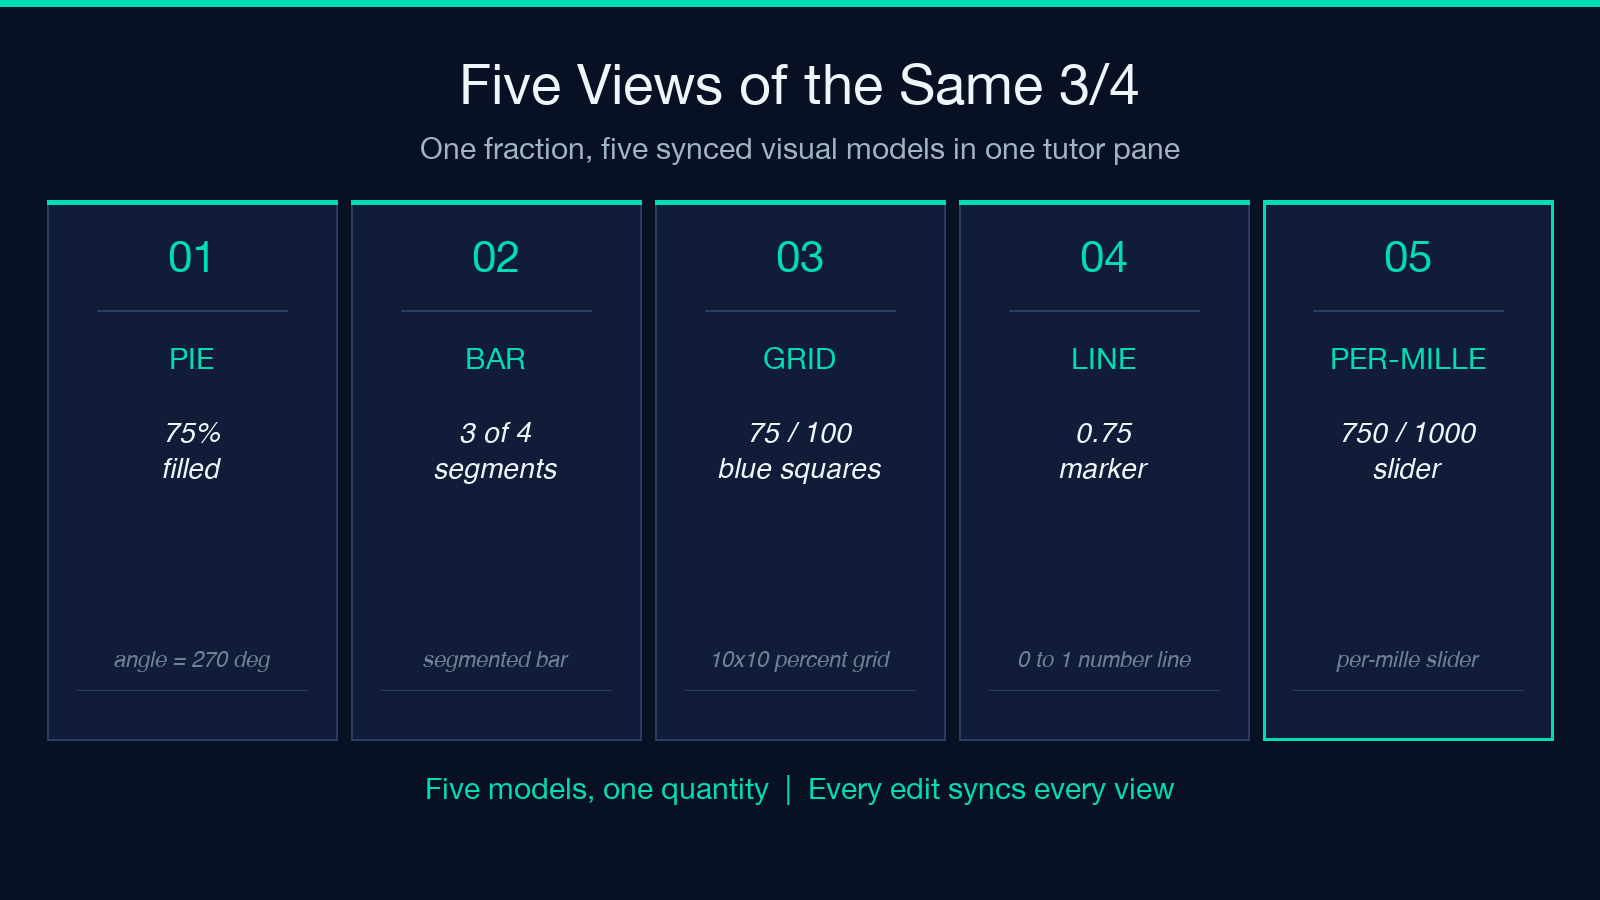
The five models are:
– Pie model — a circle filled to the matching angle (270 degrees for 3/4).
– Fraction bar — a horizontal bar split into N equal segments with the matching N highlighted.
– 10×10 percent grid — 100 small squares with the matching count filled.
– 0–1 number line — a tick mark at the matching decimal position.
– Per-mille slider — a continuous 0–1000 slider that snaps to integer values.
The reason five models matter is redundancy. A student who does not yet trust the pie will often trust the grid because the grid is countable. A student who does not trust the grid will often trust the number line because the line is anchored at 0 and 1, both of which they have already seen. The tutor does not ask the student to pick one — it shows all five and lets the student move their eye.
The single-source design also avoids one of the most common teaching errors: showing 3/4 as a pie, then 75% as a separate visual, then 0.75 as a third, and expecting the student to assemble the equivalence in their head. The tutor presents them as one quantity, three notations, five views.
For a deeper look at the tutor in action, the Fraction / Decimal / Percent Visual Tutor renders all five models live from whatever source mode you pick.
Three Input Modes, One Tutor Pane
The tutor accepts the same quantity in any of three notations and treats them as equivalent at input time. The student picks the notation they already understand; the tutor does the rest.
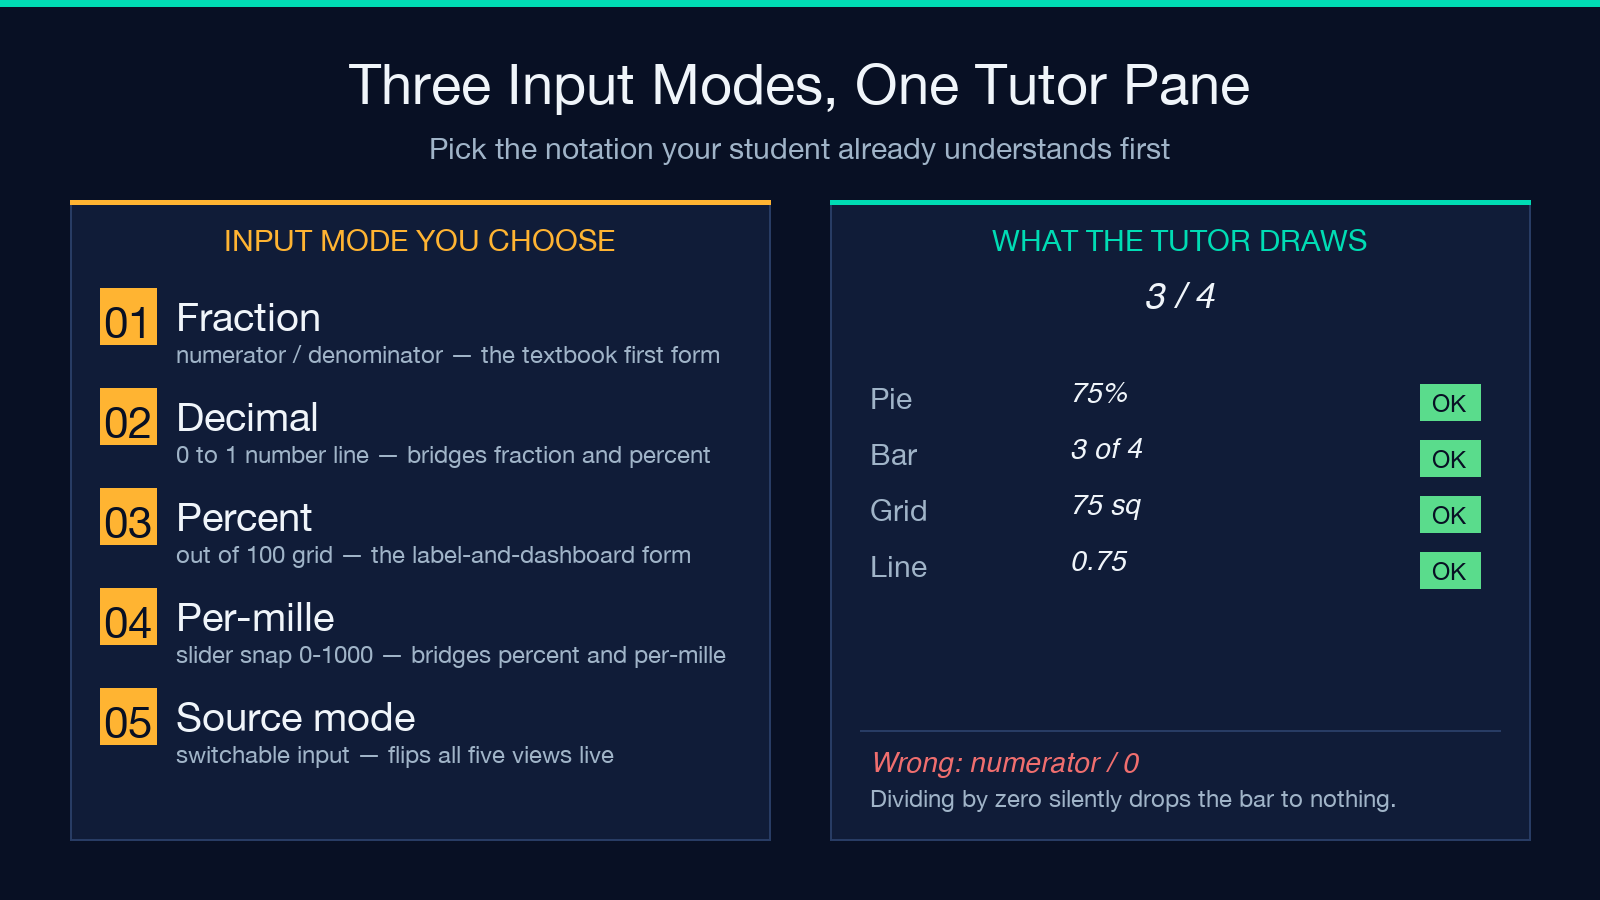
– Fraction mode — numerator / denominator, the textbook first form. Default for new sessions.
– Decimal mode — a value in the 0–1 range, the form most grade-school learners first see on a number line.
– Percent mode — a value in the 0–100 range, the form most adults read first on labels, dashboards, and discount signs.
– Per-mille mode — a value in the 0–1000 range, the form lab reports, brewing recipes, and parts-per-thousand specs use.
Switching source mode does not change the rendered value — it changes only what the input field accepts. The pie, the bar, the grid, the line, and the slider all show 0.75 / 75% / 750 per-mille no matter which mode you typed it in. This is the operational definition of equivalence, made visible.
The Source mode switch in the options pane is the bridge between textbook fraction and dashboard percent. Set it to fraction when the student is reading a chapter on rational numbers. Set it to percent when the student is reading a 25%-off sale sign and needs to know the actual price. The pane does the conversion and shows the student that the math has not changed — only the notation has.
Why Three Notations at Once Beats One Notation Repeated
A common pattern in textbooks is to introduce fraction first, then a chapter later introduce decimal, then a chapter after that introduce percent, and ask the student to remember that the three are connected. The tutor takes the opposite approach: it introduces all three at the same instant and lets the student watch them move together as one quantity.
The pedagogical bet is that equivalence is a perceptual fact before it is a symbolic fact. A student who has watched the pie, the bar, the grid, the line, and the slider all show 75% when the source is 3/4 does not need to be convinced later that 3/4 and 75% are the same number — they have already seen it. The symbolic fact (3/4 = 0.75 = 75%) is then a label for something they already understand, not a new idea to memorize.
This also short-circuits the most common student question: “but how do you know?” The answer in the tutor is not “because your teacher told you” — it is “look at all five models at once and count.” Once the student has counted three filled squares out of four on the fraction bar, seventy-five filled squares out of a hundred on the grid, and the marker at 0.75 on the number line, the question stops making sense. The three notations are the same drawing viewed from three angles.
The tutor’s design choice — one quantity, three notations, five views — is the reason it works as a tutor rather than as a converter. A converter takes one notation and returns another. A tutor takes one quantity and shows that the notations were never different to begin with.
Repeating-Decimal Detection and the Overline Trick
Some fractions terminate when written in decimal form. 1/2 becomes 0.5 and stops. 1/4 becomes 0.25 and stops. 1/5 becomes 0.2 and stops. Other fractions do not terminate. 1/3 becomes 0.333… and continues forever. 1/7 becomes 0.142857142857… and the six-digit block repeats indefinitely.
The tutor auto-detects the repetend — the smallest repeating block of digits — and renders the standard overline notation. For 1/3 the overline covers the single digit 3, written as 0.3̄. For 1/7 the overline covers the six-digit block 142857, written as 0.142857̄. The overline is the shorthand mathematicians use to say “this digit, or this block of digits, repeats forever.”
The repetend length is bounded by the denominator minus one. A fraction with denominator 7 can have a repetend of at most 6 digits, and 1/7 hits that bound exactly. A fraction with denominator 13 can have a repetend of at most 12 digits. The tutor computes this on every render and shows the overline version side by side with the truncated decimal, so the student sees both the practical “≈ 0.333” and the exact “0.3̄” at the same time.
For more on the auto-detection logic, the Fraction / Decimal / Percent Visual Tutor shows the repetend length on every render.
Four Fractions, Four Stories — When the Decimal Terminates
Not every fraction has a repeating decimal. Whether a fraction terminates is decided entirely by the prime factorization of the denominator. If the denominator has only the prime factors 2 and 5, the decimal terminates. If the denominator has any other prime factor — 3, 7, 11, 13, 17 — the decimal repeats.
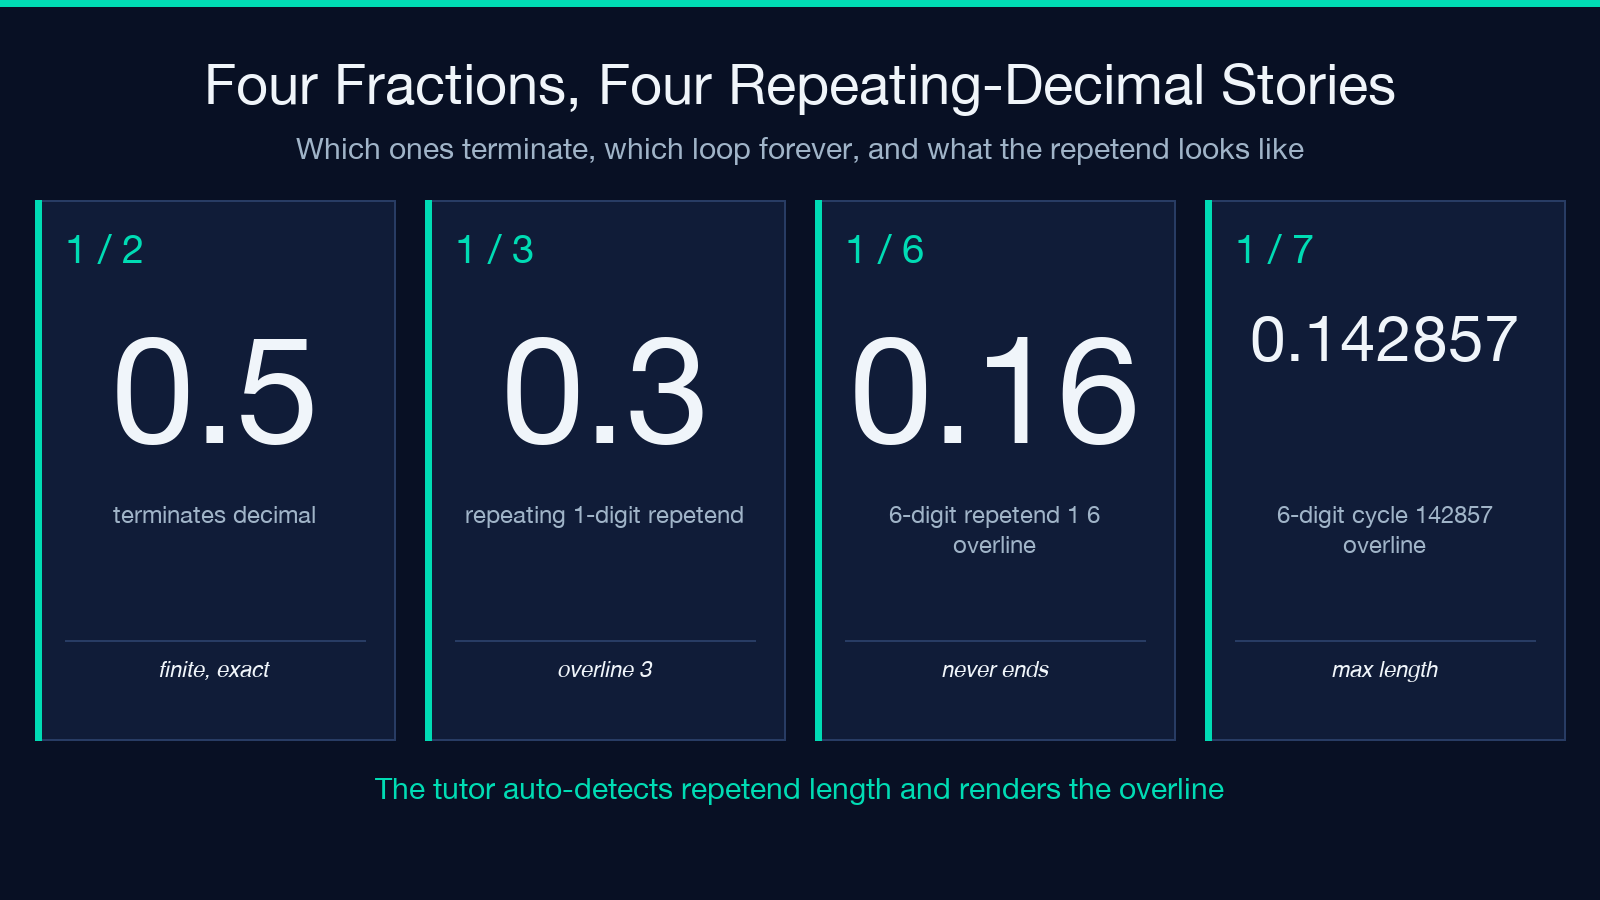
Four example fractions show the four possible stories:
– 1/2 — denominator is 2. The decimal terminates at one digit: 0.5.
– 1/3 — denominator is 3. The decimal repeats with a one-digit repetend: 0.3̄.
– 1/6 — denominator is 2×3. The decimal has a finite part (0.1) followed by a six-digit repetend (6̄).
– 1/7 — denominator is 7. The decimal repeats with a six-digit repetend: 0.142857̄.
The 1/7 case is the dramatic one — the repetend length is the maximum the denominator allows, and the cycle 142857 has the rare property that cyclic permutations of it correspond to multiples of 1/7 (142857 × 2 = 285714, 142857 × 3 = 428571, and so on). The tutor does not call this out by name, but the overline on the six-digit block is rendered identically to the overline on the one-digit block for 1/3, so the student can compare.
The general rule: if the denominator is a product of 2s and 5s only, the decimal terminates; otherwise, the decimal repeats. The tutor makes this rule visible by drawing the terminating fraction once and the repeating fraction with its overline, side by side.
The Per-Mille Slider — When Percent Is Too Coarse
Percent is the right unit for discount signs and election results. Per-mille is the right unit for lab concentrations, brewing specific gravity, and parts-per-thousand salinity. The tutor includes a 0–1000 slider precisely so the student who already understands percent can extend the same mental model one decimal place further.
The slider snaps to integer per-mille values. 750 per-mille is exactly 75%. 333 per-mille is the closest snap to the repeating decimal 0.333…, but the tutor still renders the overline 0.3̄ in the decimal view. The slider gives the student a continuous handle for moving between values; the overline keeps the exact representation honest.
For a student first encountering per-mille, the cleanest bridge is to convert the percentage: 75% → 750 per-mille by adding a zero, then explaining that 1 per-mille is one part in a thousand rather than one part in a hundred. The tutor handles this without any mode switch — the same quantity renders correctly whether you arrived at it as a fraction, a percent, or a per-mille value.
Practice Exercises With Explained Answers
The tutor includes a showExercises option that toggles a practice set below the visualizations. Each exercise is a small problem — convert 2/5 to percent, identify the repetend length of 1/11, compare 0.6 to 60% — followed by an explained answer that walks through the conversion step by step.
The explained-answer format is the part that matters. A bare answer key tells the student whether they got it right. An explained answer tells them why, using the same five visual models the tutor already rendered. The student who answered 2/5 incorrectly can look at the pie, see that 2 of 5 segments are filled, count 40 squares in the grid, and arrive at 40% by counting, not by memorizing.
The exercises are graded by source notation, not by difficulty. The tutor does not rank them as easy or hard — it just generates a new set each time the source value changes. This avoids the trap of teaching-to-the-test: the student practices converting whatever they are looking at, not a pre-canned list of “easy” fractions.
For a live walk-through of the exercises pane, the Fraction / Decimal / Percent Visual Tutor renders them on the same page as the five visual models.
Putting It Together — A 5-Minute Lesson Plan
A short lesson using the tutor can be run in five steps.
- Pick a quantity the student already knows — start with 1/2, 0.5, or 50%. Set the tutor to fraction mode and type 1/2. Show all five models.
- Switch source modes — flip to decimal mode and type 0.5. Show that every model is identical to the previous render. Flip to percent mode and type 50. Show the same.
- Move the per-mille slider — drag the slider to 500, then 750, then 333. Each move re-renders all five models. Pause on 750 and ask the student to read off the fraction.
- Introduce a repeating decimal — change source to fraction mode and type 1/3. The decimal view now shows 0.3̄. Ask the student why the overline is there.
- Run one practice exercise — turn on
showExercisesand let the student convert the current source value to the other two notations. Read the explained answer aloud together.
The five steps cover equivalence, mode switching, the per-mille bridge, repeating-decimal notation, and practice-with-explanation. The tutor does the rendering work; the teacher does the prompting work. The student does the eye work — moving their gaze from one model to the next until the equivalence stops being a fact and becomes a thing they can see.
Explore more tools at elysiatools.com.
