
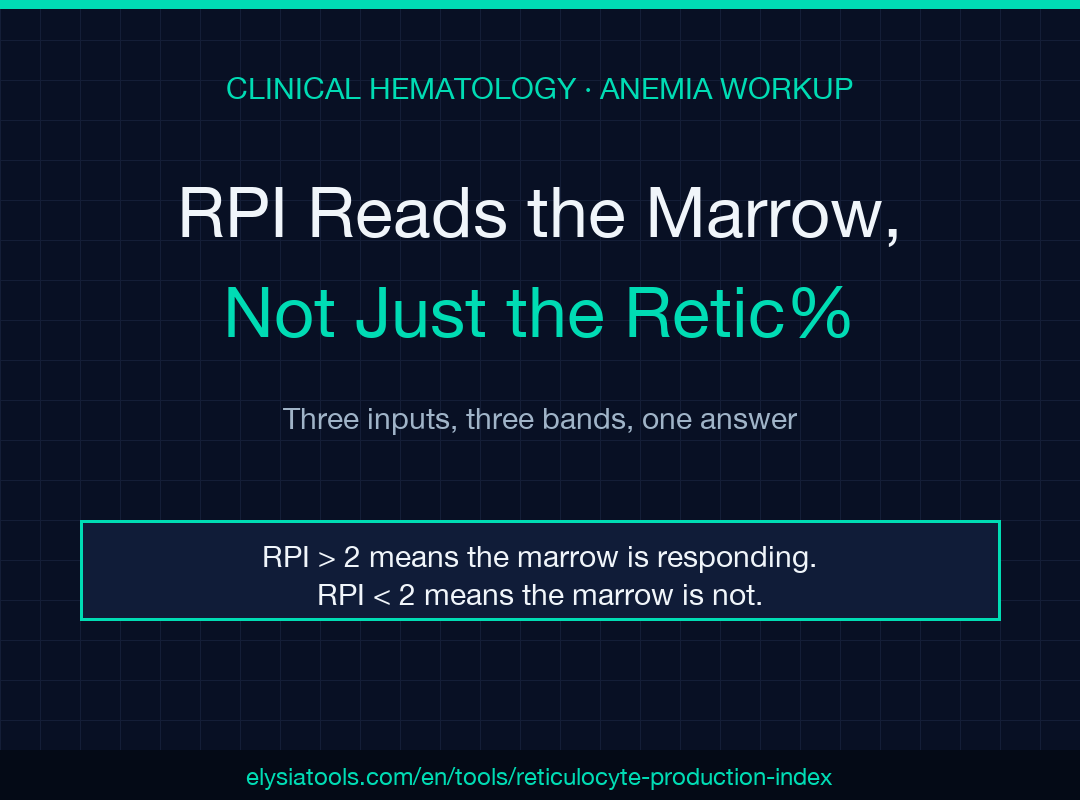
Reticulocyte Production Index (RPI) is the corrected, maturation-adjusted score that tells you whether the marrow is actually answering the anemia — or merely being asked. When a CBC comes back with low hemoglobin and a reticulocyte percent that looks reassuringly “elevated,” the raw number is misleading: a reticulocyte percent of 4% in a patient whose hematocrit has crashed from 42% to 22% is not the same physiologic signal as 4% in a patient with a hematocrit of 38%. The percent is a fraction of all red cells, and the denominator has shrunk. Step 1 corrects the fraction for the patient’s hematocrit against a normal reference (45% male, 40% female) — that gives the corrected reticulocyte count (CRC). Step 2 divides by a maturation factor that climbs as the marrow shifts younger reticulocytes out earlier to compensate (1.0 at Hct 45%, 1.5 at 35%, 2.0 at 25%, 2.5 at 15%, linearly interpolated). The resulting ratio — RPI = CRC / maturation factor — is the production index, and it splits the diagnostic universe into two regimes: RPI > 2 (especially ≥ 3) means the marrow is responding appropriately (think hemolysis or acute blood-loss recovery); RPI < 2 means the marrow is not, and the differential runs toward iron deficiency, anemia of chronic disease/inflammation, renal anemia, aplastic anemia, MDS, marrow infiltration, and untreated megaloblastic anemia. This field guide walks through the five inputs, four arithmetic steps, three interpretation bands, and the seven clinical edge cases where the index misleads — and shows how to compute every step at Reticulocyte Production Index (RPI) Calculator.
What the three inputs really mean
The calculator asks for three core numbers and lets you choose a reference preset. Reticulocyte % is the reticulocyte fraction off the CBC differential — enter it as the percent value (8 for 8%, not 0.08). The CBC analyzer reports this as reticulocytes per 100 red cells, so a “4%” already means 4 reticulocytes per 100 RBCs, not 4 per 1000. Patient Hematocrit (%) is the current Hct from the same draw — entering 25 for 25%. Normal Hct reference defaults to male (45%) with a female option (40%) and a custom entry; the choice matters because the corrected reticulocyte count divides the patient Hct by the reference, and a 5-point swing on the reference moves the correction by 10–15%. There is also a fourth input — decimal places — that controls output precision and does not change the value.
The canonical input/output contract is documented at Reticulocyte Production Index (RPI) Calculator; every step below maps directly to a label on that form.
Step 1 — corrected reticulocyte count (CRC)
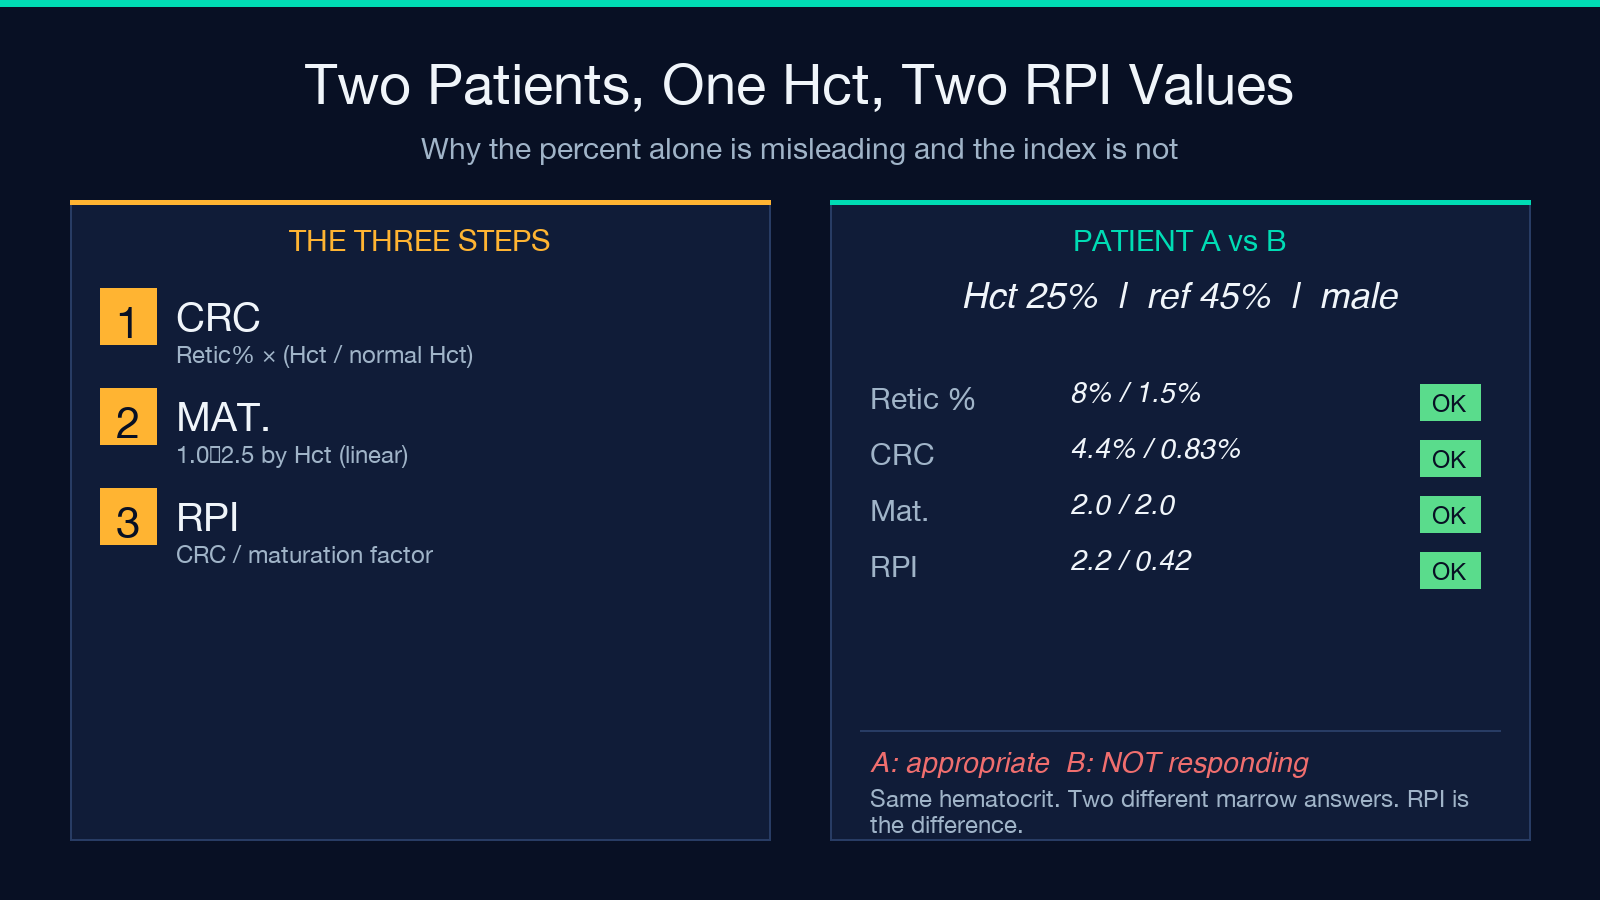
CRC = Retic% × (patient Hct / normal Hct). The patient Hct is the current measured Hct; the normal Hct is the reference (45% for men, 40% for women, or your custom value). The CRC rescales the reticulocyte fraction so it answers the question “what would this reticulocyte percent be if the patient’s red cell mass were normal?” — a patient with Hct 25% and retic 8% against a male reference gives CRC = 8 × (25 / 45) = 4.4%. The same 8% in a patient with Hct 38% against the same male reference gives CRC = 8 × (38 / 45) = 6.8% — and the gap between 4.4% and 6.8% is the entire reason RPI exists instead of raw retic%.
Step 2 — maturation (shift) factor
The marrow’s response to anemia is not just “produce more reticulocytes”; it also “release them earlier.” Young reticulocytes (shift cells) normally spend 2–3 days maturing in the marrow before being released; under anemia pressure, the marrow shortcuts that timer, so a reticulocyte counted in peripheral blood at any given moment represents fewer days of production than its name suggests. The classic Hillman & Finch adjustment divides by a maturation factor that climbs as the patient’s Hct falls: 1.0 at Hct 45% (no shift), 1.5 at 35%, 2.0 at 25%, 2.5 at 15%, linearly interpolated. This factor represents the days of marrow time condensed into each circulating reticulocyte at that degree of anemia. See the underlying table at Reticulocyte Production Index (RPI) Calculator.
Step 3 — RPI = CRC / maturation factor
The RPI is the corrected reticulocyte percent divided by the maturation factor. Take the running example: retic 8%, Hct 25%, male reference 45% — CRC = 8 × 25 / 45 = 4.4%. Maturation factor at Hct 25% is 2.0. RPI = 4.4 / 2.0 = 2.2. A second example: retic 1.5%, Hct 25%, male reference 45% — CRC = 1.5 × 25 / 45 = 0.83%. RPI = 0.83 / 2.0 = 0.42. Both patients had identical hematocrits; the second patient has a marrow that is not responding. Compute both cases against the same form at Reticulocyte Production Index (RPI) Calculator to verify.
Step 4 — interpretation: the three bands
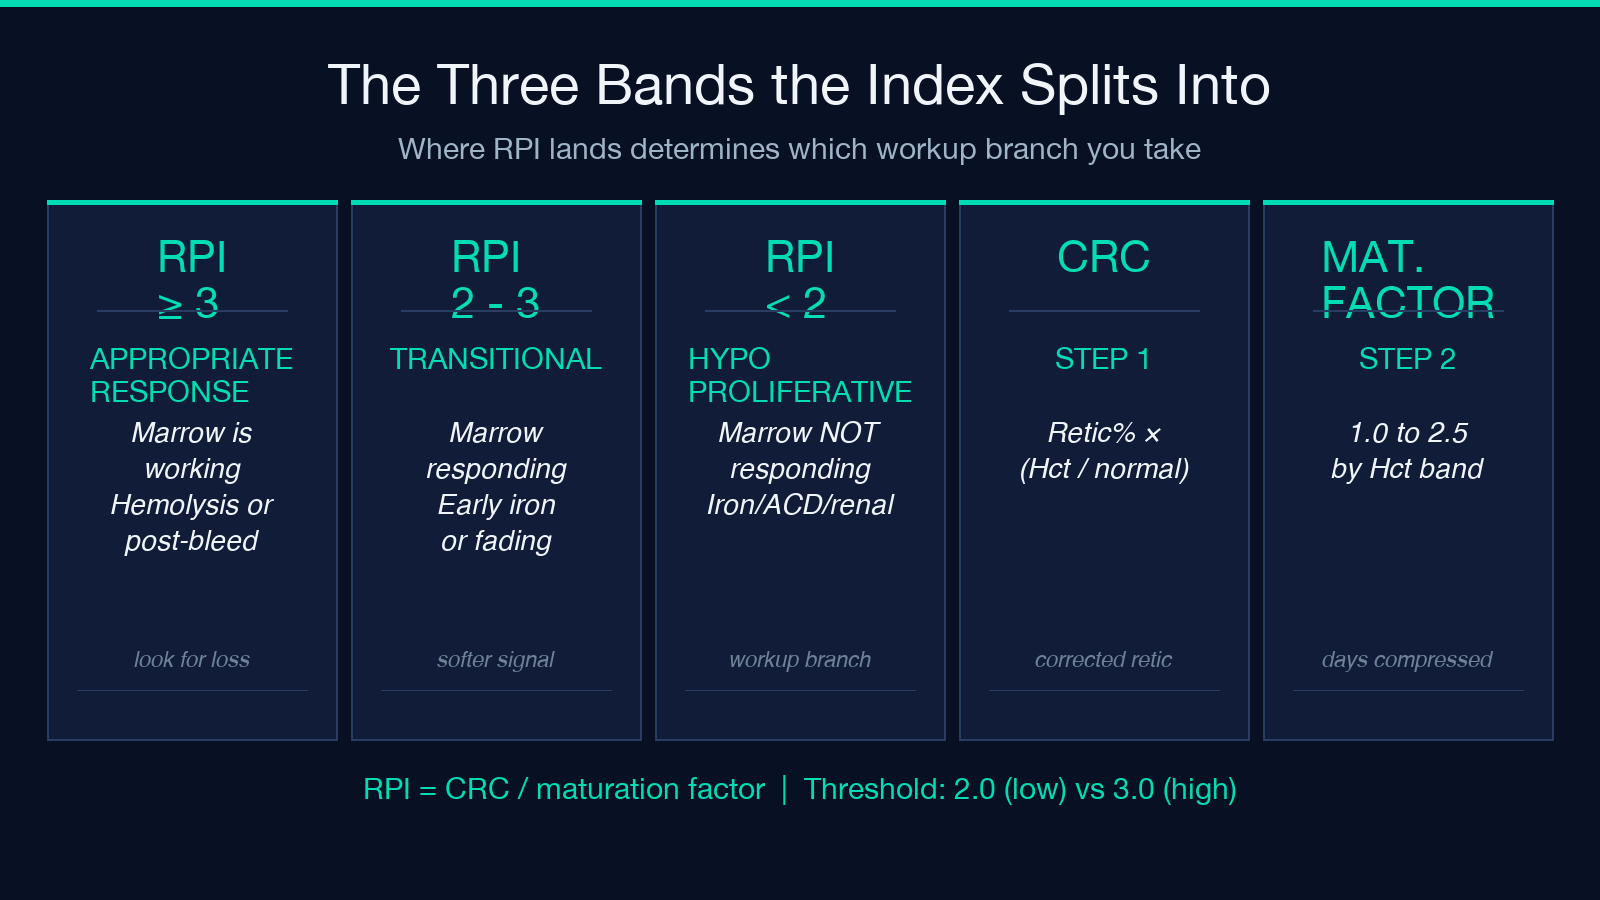
RPI ≥ 3 is the cleanest “marrow is working” signal. Hemolysis, acute blood-loss recovery, and response to therapy (iron, B12, folate replacement after the underlying deficiency is corrected) all land here. RPI between 2 and 3 is a transitional band — the marrow is responding but not robustly; this is where early iron supplementation shows up, where post-acute-blood-loss recovery is fading, and where compensated hemolytic states plateau. RPI < 2 is hypoproliferative. The differential narrows to: iron deficiency, anemia of chronic disease/inflammation, renal anemia (low EPO), aplastic anemia, MDS, marrow infiltration (tumor, fibrosis, granulomas), and untreated megaloblastic anemia (B12 / folate). Every band crosses the threshold at a different combination of inputs — play with the form at Reticulocyte Production Index (RPI) Calculator and watch the band flip when you hold Hct constant but vary retic%.
Why the maturation factor is interpolated, not stepped
The Hillman & Finch table lists discrete factors at 45%, 35%, 25%, and 15%. Real patients sit between those values — an Hct of 30% falls between the 35% row (factor 1.5) and the 25% row (factor 2.0); linear interpolation gives 1.75. The choice between stepped and interpolated is not academic: at Hct 30% the factor swings the index by ~17% (1.5 vs 1.75). The calculator applies the linear form, matching MDCalc. If you have only the stepped table, an Hct of 30% on the 35% row understates the maturation shift by half a step — and pushes borderline RPI cases from 2.0 to 2.3, potentially moving a “hypoproliferative” patient into “appropriate response.” That kind of threshold error is why the canonical implementation lives at Reticulocyte Production Index (RPI) Calculator with explicit interpolation.
Seven edge cases where RPI misleads
- Rapidly changing anemia. The maturation factor assumes the marrow has had time to establish the new release pattern; if the patient is acutely bleeding or has just received a transfusion, RPI underestimates or overestimates response.
- Absolute reticulocyte count (ARC) available. When ARC in ×10⁹/L is available, it is more reliable than RPI because it does not depend on the maturation factor — the calculator returns the RPI but a clinician should always check whether the lab reported an ARC.
- Severely anemic children and pregnancy. Reference Hct and physiologic baseline differ from the adult 45/40 split; the custom-reference option lets you set a pregnancy-adjusted normal Hct (around 33–35% in the third trimester).
- Recent EPO therapy. Exogenous erythropoietin shifts the marrow release pattern on a timescale that the maturation factor does not capture.
- Bone marrow recovery after chemotherapy. The release pattern swings for weeks; RPI in this window is a trajectory, not a steady-state.
- Sickle cell disease and other chronic hemolytic states. Steady-state RPI is artificially elevated because the marrow has been at shift-state for years; the index still tells you the marrow is working but the threshold for “response” should be adjusted clinically.
- Iron supplementation that has just started. A retic surge at day 5–7 of iron therapy can push RPI > 3 transiently; do not interpret that as hemolysis.
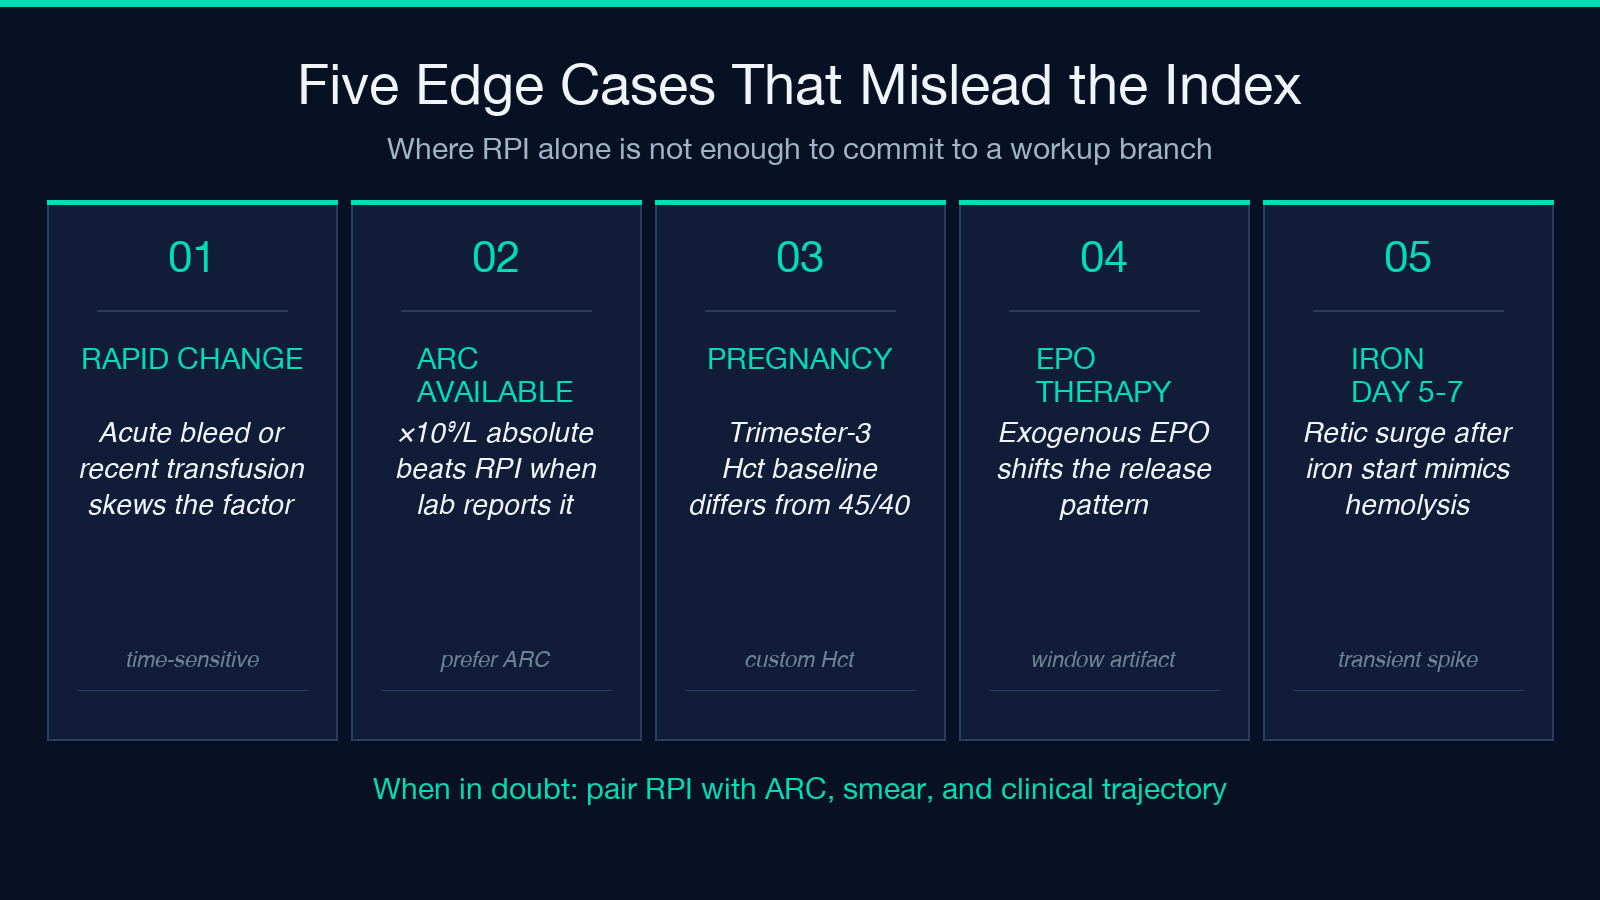
Each of these is a place where the calculator gives you the math but the answer needs clinical context — see the source-of-truth caveats at Reticulocyte Production Index (RPI) Calculator.
What to do with the answer
The RPI is a single number that branches a differential; it is not a diagnosis. RPI ≥ 3: order hemolysis workup (LDH, haptoglobin, indirect bilirubin, peripheral smear for schistocytes, reticulocyte absolute count trajectory), confirm acute blood loss, or confirm therapy response. RPI < 2: order iron studies (serum iron, TIBC, ferritin, transferrin saturation), B12 / folate, renal function (BUN / creatinine / eGFR), inflammatory markers (CRP), and a peripheral smear; consider bone marrow evaluation if all are non-diagnostic. The RPI moves you from “the marrow is responding” to “the marrow is not responding” — and the differential inside each branch is independent of the index. Tools that compute other clinical indices sit alongside this one in the Health category — pair the RPI with an anemia-of-chronic-disease heuristic, an iron-dose calculator, or a B12-deficiency screener to keep the workup on rails.
This article and every arithmetic step above is computed against the same form at Reticulocyte Production Index (RPI) Calculator. Run your own retic%, Hct, and reference preset to confirm the worked examples — or to test a borderline case before you commit to a workup branch.
