
Pedigree Probability Tree Field Guide: When Four Inheritance Modes, One Product-Rule Mistake, and One Carrier-Probability Step Decide Whether Your Cousin’s Risk Lands at One in Four or at Three in Four
A 32-year-old woman walks into a genetics clinic. Her father has Huntington disease; her mother is unaffected. She wants to know the chance her own child inherits the dominant allele. She is the at-risk parent, not the affected one — which means the question is not “what is my risk” but “what is my child’s risk given my own genotype probability.” A Punnett square answers the second half. A pedigree probability tree answers the whole walk from grandparents to grandchild, branch by branch, multiplying along the way and adding across when the path forks.
That is the real job of Pedigree Probability Tree: not to draw squares but to make the multiplication explicit, mode by mode, so a counselor can show a family exactly which branch produces which number. The four inheritance modes the calculator walks through — autosomal recessive, autosomal dominant, X-linked recessive, and the compound case of an affected heterozygous dominant parent — each have their own product-rule shape, their own carrier term, and their own per-sex branch when the X chromosome is in play. Get any one of those terms wrong and the answer the family hears is wrong by a factor of two, four, or more.
This field guide walks through those four modes the way the calculator does, shows the three product-rule mistakes that show up most often in clinic notes and textbook exercises, and pins down the one decision — whether to assume the affected dominant parent is homozygous or heterozygous — that flips the answer from 1/2 to 3/4 with no other change to the pedigree.
Autosomal Recessive: The Two-Carrier Case Most People Get Right
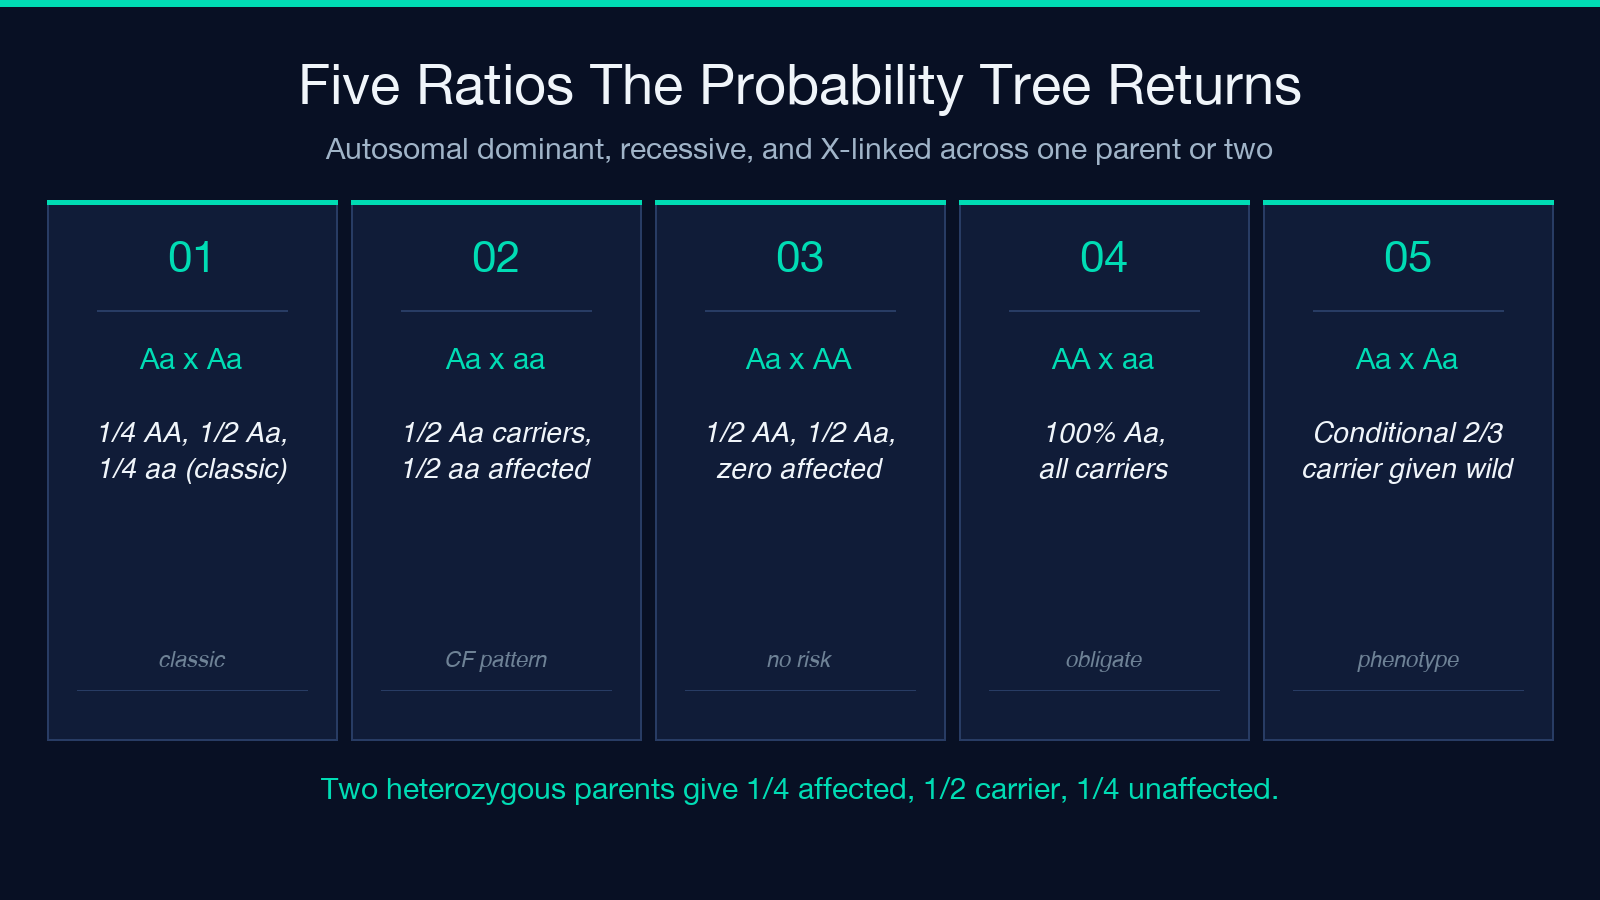
The cleanest pedigree probability problem is also the one taught first: two known carriers of an autosomal recessive allele, no family history of consanguinity, asking for the chance of an affected child. The probability tree is four branches wide (AA, Aa, aA, aa), each branch carrying weight 1/4. Two of those four branches are carrier genotypes (Aa and aA), one is homozygous affected (aa), and one is homozygous unaffected (AA). The product rule along the father-carrier branch (1/2) and the mother-carrier branch (1/2) gives 1/4; the sum rule across the two carrier offspring genotypes gives 1/2.
That 1/2 carrier probability is the answer most genetics textbooks lead with for the cystic fibrosis pattern, and it is the answer the Pedigree Probability Tree calculator surfaces first when you enter “autosomal recessive, both parents known carriers.” What often gets missed in textbook exercises is the conditional step: if the offspring is phenotypically unaffected (which is true for the three non-aa branches), the conditional probability of being a carrier is not 1/2 but 2/3, because the AA branch has been ruled out by phenotype. The probability tree gives the unconditional 1/4 affected, 1/2 carrier, 1/4 unaffected — but the conditional 2/3 carrier figure is the one that matters when the next generation is being planned.
For cousin-pair risk the same product rule applies but the carrier probability at the parent generation is no longer given. Each cousin has probability 1/8 of being a carrier when one shared grandparent is a known carrier and the population carrier frequency is 1/25. The product 1/8 × 1/8 × 1/4 gives 1/256 affected-child risk — a number small enough that many clinic handouts quote it without the conditional carrier step, which is the first place the audit-style error creeps in.
Autosomal Dominant: The Heterozygous Assumption That Triples the Answer
The Huntington pattern looks simpler on the surface — one parent affected, one parent unaffected, autosomal dominant with complete penetrance. The probability tree fans out from the affected parent along two branches: pass the dominant allele (1/2) or not (1/2). The unaffected parent contributes only the recessive allele. So each child has 1/2 chance of inheriting the dominant allele and 1/2 chance of not.
What flips the answer from 1/2 to 3/4 is the homozygous-dominant case. If both parents are affected and both are heterozygous (the standard textbook assumption, because homozygous dominant for a fully penetrant late-onset disease is essentially never observed in living adults), the probability tree has nine branches. Four of those branches carry at least one dominant allele: Aa, aA, AA. Only the aa branch is unaffected. So 3/4 of offspring are affected and 1/4 are unaffected. This is the 75 percent figure that surprises every genetics student the first time they see it, because it does not match the intuitive “1/2 + 1/2 = somewhere around 1/2” guess that the simple one-parent case invites.
The calculator’s heterozygous-affected-parent switch is the single most consequential option in the autosomal dominant mode. Leaving it on (the default, and the right default for almost every real pedigree) gives the textbook 3/4 figure for two-affected-parent Huntington. Turning it off — i.e. assuming homozygous affected, which is biologically unrealistic but sometimes used in theoretical problems — collapses the answer to 1, all children affected. The default is correct; the switch exists for the theoretical edge case, not for clinical use.
Codominant and Multi-Allele Loci: Where the Four-Branch Tree Falls Short
The classic ABO blood-group inheritance is the cleanest case where a four-branch Mendelian probability tree is wrong by construction. Three alleles (I^A, I^B, i) at one locus produce six possible genotypes, not the four the autosomal recessive tree handles, and the phenotype map is not one-to-one with the genotype — I^A i and I^A I^A both produce type A blood, I^B i and I^B I^B both produce type B, I^A I^B produces type AB. The four-branch tree silently drops I^B and i from the offspring distribution when both parents are heterozygous, and the resulting 1/4-affected figure is wrong for ABO.
For multi-allele loci the Pedigree Probability Tree calculator is also the wrong tool — it is built for two-allele single-gene cases. The right move is to build a Punnett square by hand for the relevant allele combinations, count the offspring genotype distribution, then collapse by phenotype. For ABO with two heterozygous A parents (I^A i × I^A i), the offspring genotypes are 1/4 I^A I^A, 1/2 I^A i, 1/4 ii — three distinct genotypes, two distinct phenotypes (A and O), and a 1/4 chance of an O-type child that the four-branch tree cannot represent.
X-Linked Recessive: The Per-Sex Branch That Doubles Some Risks
X-linked recessive inheritance is where the per-sex branch of the probability tree matters most, because the inheritance pathway through the X chromosome produces different offspring probabilities for sons and daughters from the same parental genotypes. The classic hemophilia A pattern — carrier mother, unaffected father — gives 50 percent of sons affected (they get the mother’s X with the recessive allele, no second X to compensate) and 50 percent of daughters carriers (they get one X with the recessive allele and one normal X from the father, so they are heterozygous and typically unaffected).
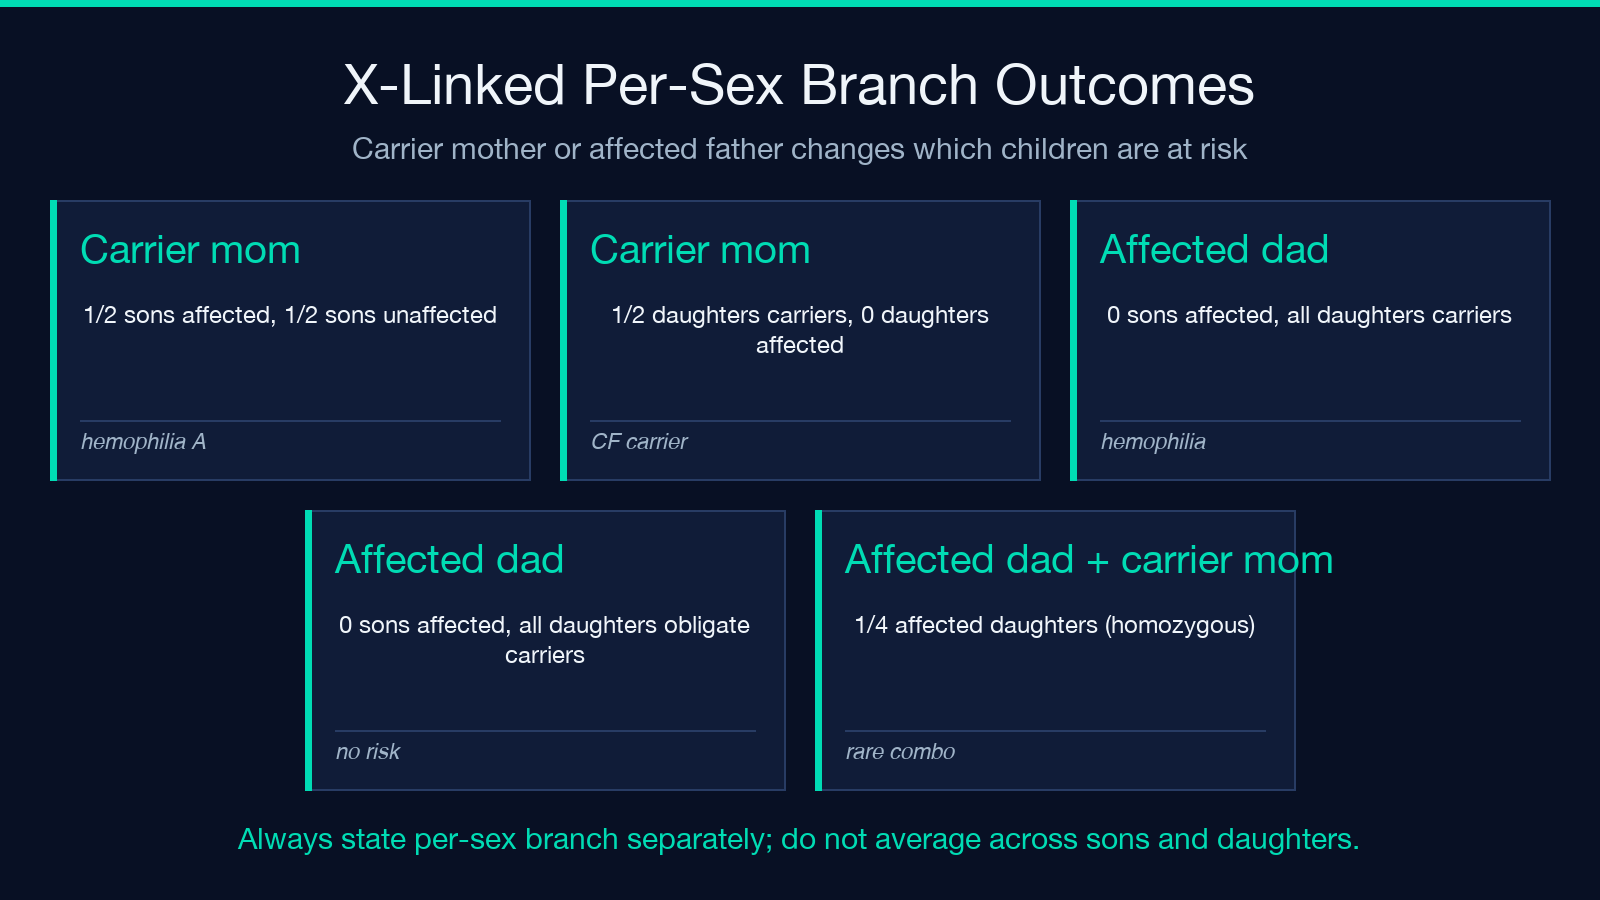
The product-rule mistake that shows up most often is treating sons and daughters as a single probability and reporting “1/4 of all children affected.” That number is correct as an unconditional across-child figure, but it hides the conditional split — 1/2 of sons affected, 0 of daughters affected — that the family actually needs to hear. The probability tree’s per-sex branch makes the conditional explicit, and that is the form that should appear in the clinic note.
The harder X-linked case is affected father plus carrier mother. The probability tree fans out across four combinations: son gets father’s Y plus mother’s normal X (unaffected), son gets father’s Y plus mother’s recessive X (affected), daughter gets father’s recessive X plus mother’s normal X (carrier, heterozygous), daughter gets father’s recessive X plus mother’s recessive X (homozygous, affected). The probability of an affected daughter in this case is non-zero — 1/2 × 1/2 = 1/4 — which is the figure that catches counselors off guard when they first run it.
Compound Heterozygous and Partial Penetrance: The Two Cases the Simple Tree Cannot Handle
The product-rule probability tree assumes single-gene inheritance with full penetrance and a known mode. Two real-world cases violate those assumptions and need to be flagged before the calculator is used at all. The first is compound heterozygosity, where two different mutant alleles at the same locus can each cause disease when paired with a wild-type allele but the disease severity depends on which combination is inherited. Cystic fibrosis has hundreds of such allele combinations, and a simple product rule along one branch underestimates the carrier-to-affected transition probability for some sub-populations.
The second is incomplete penetrance, where carrying the dominant allele does not guarantee disease expression. BRCA1 mutations have roughly 65 percent lifetime breast cancer penetrance in carrier populations, not 100 percent. A probability tree that ignores penetrance will overstate risk by 35 percent in the BRCA case, which is the difference between a 65 percent lifetime risk and a 100 percent lifetime risk — a clinically enormous gap.
For both cases the Pedigree Probability Tree calculator is the wrong tool — it is built for the clean Mendelian case, not for the modifier-gene or penetrance-adjusted case. The right move is to first run the clean tree to establish the baseline inheritance probability, then apply the penetrance or compound-het adjustment as a separate step on top of the tree output. Trying to force penetrance into the product rule along a single branch conflates two different probability statements and produces a number that cannot be defended at a case conference.
Carrying the Answer Forward: From Tree Output to Family Decision
The probability tree gives a number — 1/4 affected, 1/2 carrier, 3/4 affected across two heterozygous dominant parents, 1/2 of sons affected in the X-linked carrier-mother case. The number is the starting point, not the ending point. The clinic visit that follows needs three additional layers before the family can make a decision: the conditional probability step (carrier vs affected given phenotype), the penetrance adjustment for incomplete-penetrance genes, and the cousin-pair or population-carrier-frequency step when the at-risk parent is not a known carrier from direct testing.
For the autosomal recessive cystic-fibrosis case with two known carriers, the family hears “1/4 affected, 1/2 carrier, 1/4 unaffected” — but the next question is always “if our first child is unaffected, what is the chance the second child is affected?” The answer is still 1/4, because each pregnancy is an independent draw from the same Mendelian distribution. The conditional carrier probability given that the first child is unaffected is 2/3, not 1/2 — and that is the figure the clinic note should carry forward to the second-pregnancy counseling conversation.
For the Huntington case with one affected heterozygous parent, the family hears “1/2 of children inherit the allele” — but the second-pass question is always about penetrance and age of onset. The Pedigree Probability Tree gives the inheritance probability; the Gene Penetrance and Expressivity Calculator gives the age-adjusted expression probability. Combining the two gives a number that holds up at case conference in a way that the inheritance probability alone does not.
Three Product-Rule Mistakes That Show Up in Clinic Notes
The first mistake is forgetting to apply the conditional probability step after phenotype rules out a genotype. A 1/4 affected, 1/2 carrier, 1/4 unaffected unconditional distribution becomes 2/3 carrier, 1/3 affected carrier-free when the child is known to be phenotypically unaffected. The 1/2 number is correct for the population but wrong for the at-risk family planning the next pregnancy.
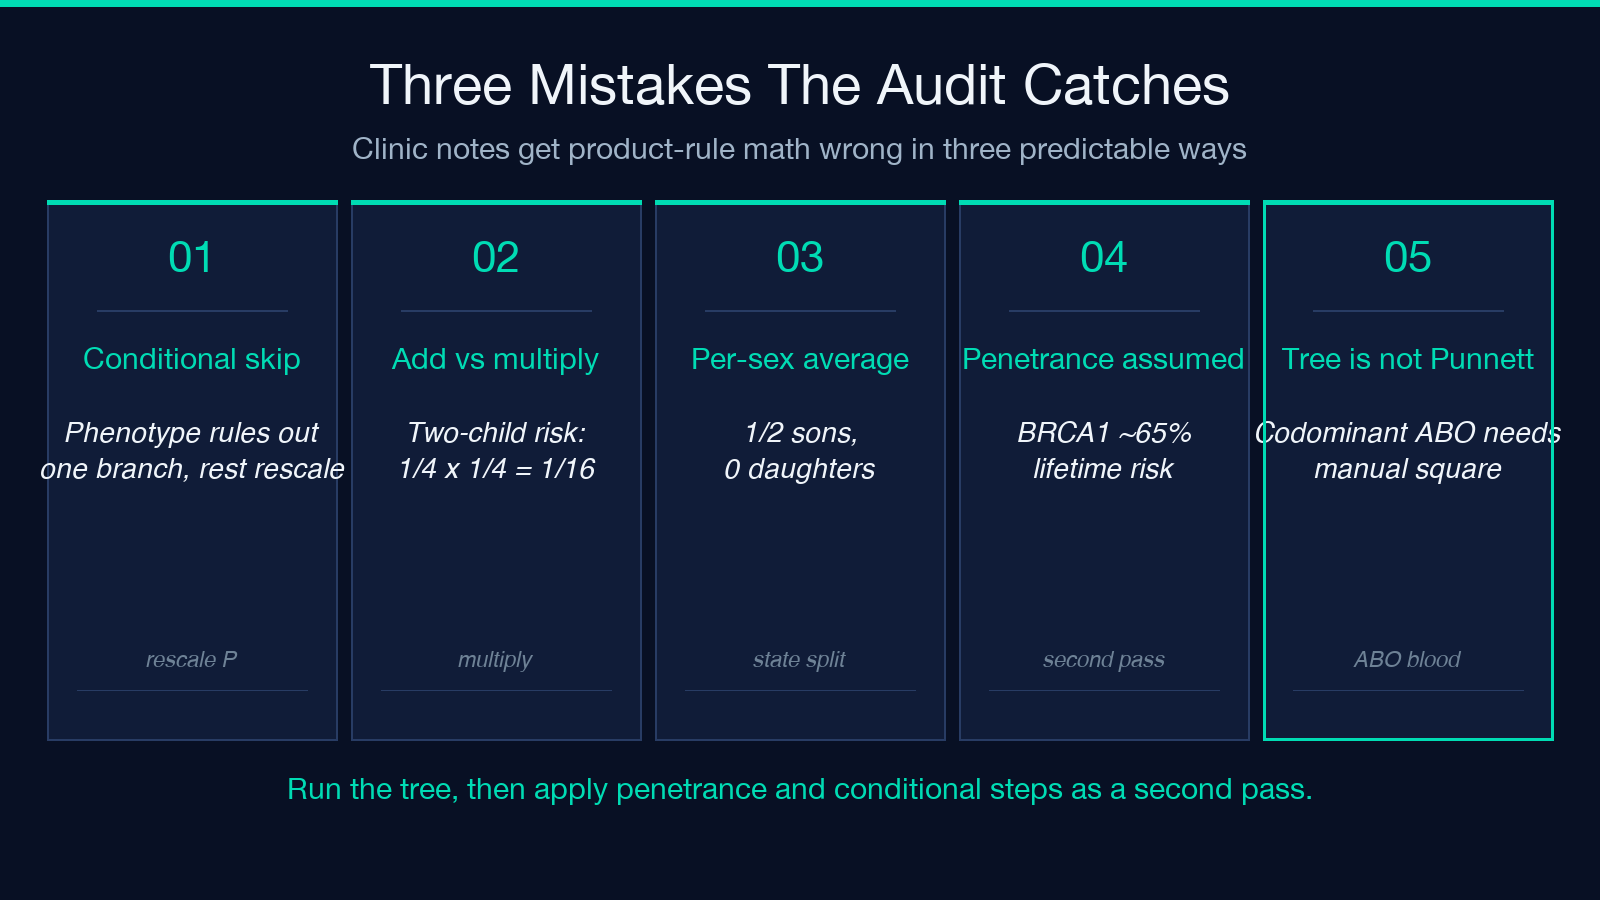
The second mistake is adding branch probabilities that should be multiplied. When the question is “what is the chance both of my children are affected,” the answer is not 1/4 + 1/4 = 1/2 but 1/4 × 1/4 = 1/16, because the two pregnancies are independent draws from the same Mendelian distribution. Adding treats them as exclusive alternatives (one OR the other child); multiplying treats them as independent events (this child AND that child). For one-child planning the addition works by accident; for two-child planning it overstates risk by an order of magnitude.
The third mistake is treating an X-linked recessive probability as if sons and daughters share the same risk. The unconditional 1/4-affected-across-all-children figure is correct as a population average but hides the per-sex split that the family actually experiences. Sons have 1/2 risk in the carrier-mother case; daughters have 0. Reporting “1/4 of all children” when 1/2 of sons is the right answer is the kind of error that gets caught in a careful case review and quietly persists in informal counseling notes.
Cross-Link the Related Tools Before You Sign the Clinic Note
A pedigree probability problem is rarely a one-tool job. The tree gives the inheritance probability; the Autosomal Dominant Pedigree Analyzer gives the affected-individual probability assuming heterozygosity across a multi-generational pedigree with several affected members. The Autosomal Recessive Inheritance Risk Calculator gives the cousin-pair or population-carrier-frequency case more directly than the tree does. The Mendelian Punnett Square Calculator is the right tool when only one generation is in question and the per-sex branch is not needed.
For the population-genetics context, the Allele Frequency Calculator and the Epistasis Ratio Calculator give the Hardy-Weinberg and dihybrid-ratio extensions that the single-gene tree does not. For expressivity and penetrance adjustments, the Gene Penetrance and Expressivity Calculator is the right second pass after the tree output.
For a counselor, the workflow is: start with the Pedigree Probability Tree to establish the clean Mendelian baseline, apply the penetrance adjustment from the expressivity calculator if the gene is known to be incomplete, run the cousin-pair risk for any consanguinity case, and sign the clinic note with the per-sex branch stated explicitly. The four-inheritance-mode coverage of the tree plus the per-mode cross-link gives a defensible number at every step. Browse more education and genetics tools at elysiatools.com.
The right pedigree probability tool is the one that makes the product rule along each branch visible and the per-sex split explicit. The probability tree does both. Pair it with the right second-pass calculator for penetrance, cousin-pair, or population-frequency context, and the answer the family hears is the answer that holds up at case conference.
