
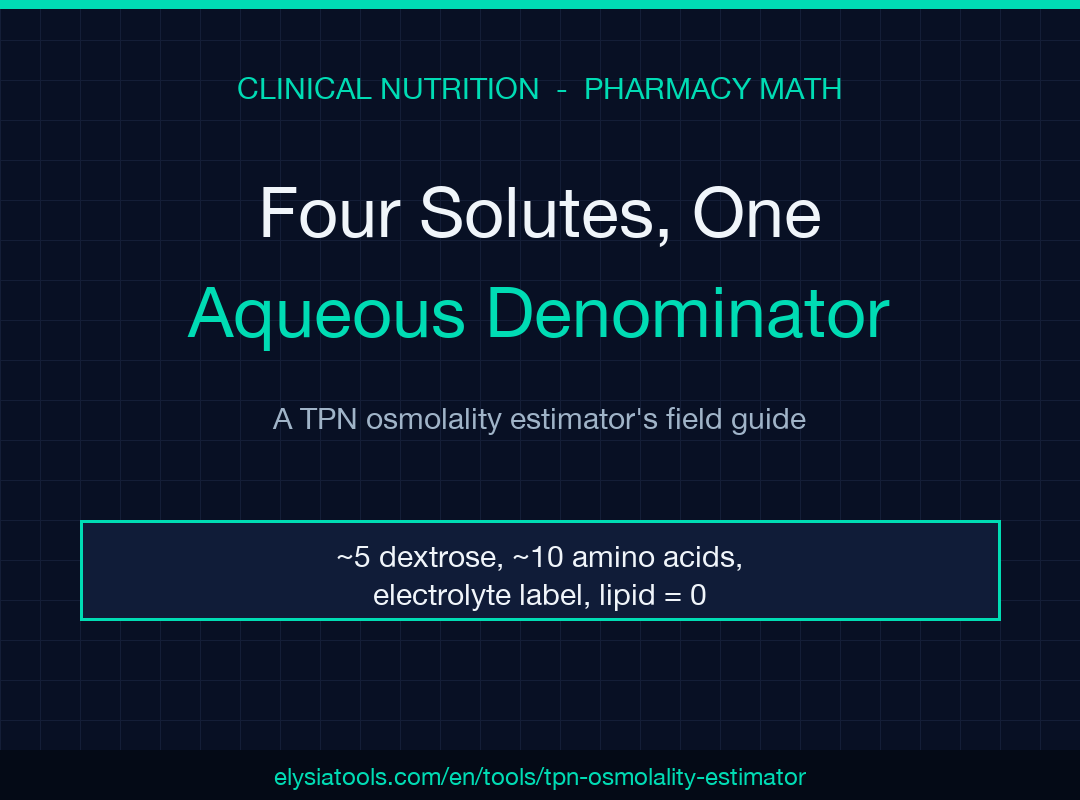
A TPN osmolality estimator is the difference between a vein that survives the infusion and one that thromboses before lunch. The math sits on a deceptively simple axiom: dextrose contributes ~5 mOsm per gram per liter, amino acids contribute ~10, electrolytes add whatever their label reads, and lipid is near-iso-osmolar and effectively absent. Multiply, sum, divide by the aqueous-phase volume (total minus lipid) and you get the number that decides PICC versus central line. The estimator at Elysia Tools turns that axiom into a seven-field form — no pharmacy consult, no memorization, no spreadsheet — and returns the answer in the time it takes to read the PN label.
Why the osmolality threshold picks the access route
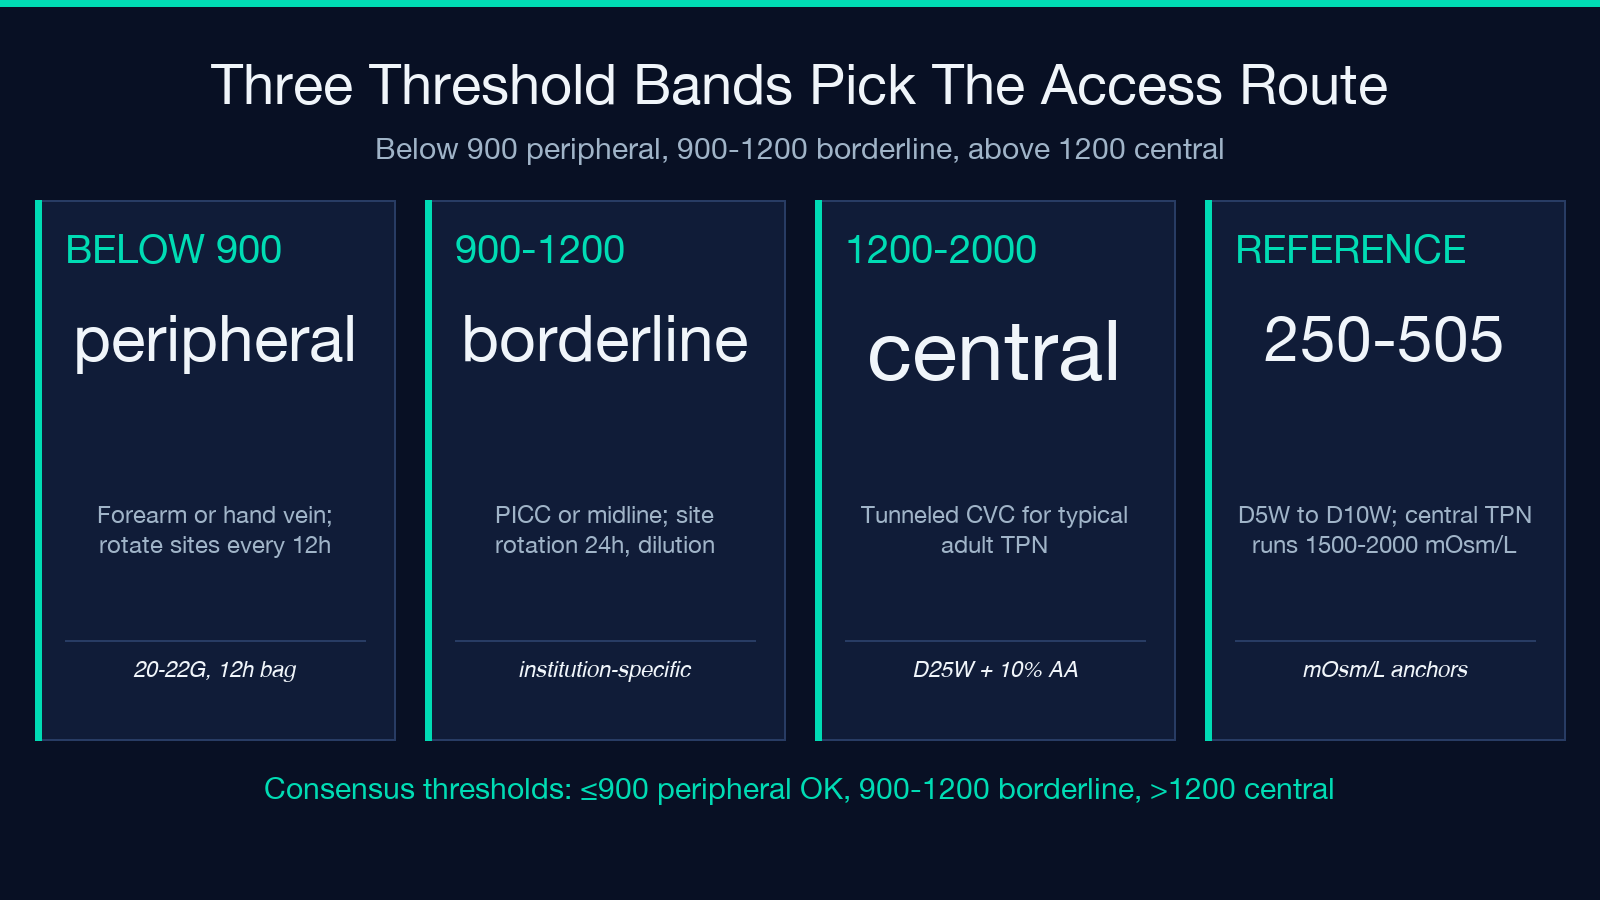
A TPN osmolality estimator is the difference between a vein that survives the infusion and one that thromboses before lunch. Peripheral veins tolerate roughly 900 mOsm/L before the osmotic gradient starts pulling water out of the endothelium; below that, a 20- or 22-gauge in the forearm usually holds for a 12-hour infusion. Between 900 and 1200, you’re in the gray zone where some protocols accept a PICC or midline with site rotation every 24 hours and others default to central. Above 1200, the phlebitis and thrombosis rates climb fast enough that no one argues for peripheral access. A typical central TPN — D25W, 10% amino acids, electrolytes, and 20% lipid — sits between 1500 and 2000 mOsm/L, which is exactly why central lines exist as a category. Reference points from clinical practice anchor the scale: D5W is ~250 mOsm/L, normal saline is ~308, D10W is ~505, and a one-liter bag of D50W pushed peripherally would burn through the vein in minutes.
The estimator at Elysia Tools implements the consensus thresholds as a three-band rule — peripheral OK below 900, borderline 900 to 1200, central required above 1200 — and labels the output accordingly. The rule is institution-dependent and the disclaimer on the result page reads exactly that, but the bands are close enough across Mirtallo 2004, Pittiruti 2009, and Dugan 2014 that you can act on the number at 02:00 when the pharmacy is closed.
The four solutes and the one denominator
The sum-of-solute formula is what the tool computes on every keystroke. Dextrose is the largest contributor by mass: 25 g in a liter (D2.5W) adds 125 mOsm, 100 g (D10W) adds 500, 250 g (D25W) adds 1250. Amino acids carry roughly twice the osmotic weight per gram because they ionize: 50 g of a 10% solution in a liter contributes 500 mOsm on its own. Electrolytes vary by admixture — a maintenance PN with standard Na/K/Ca/Mg/acetate/P reads around 300 to 500 mOsm/L on the label, while neonatal formulas with high calcium and phosphate push past 800.
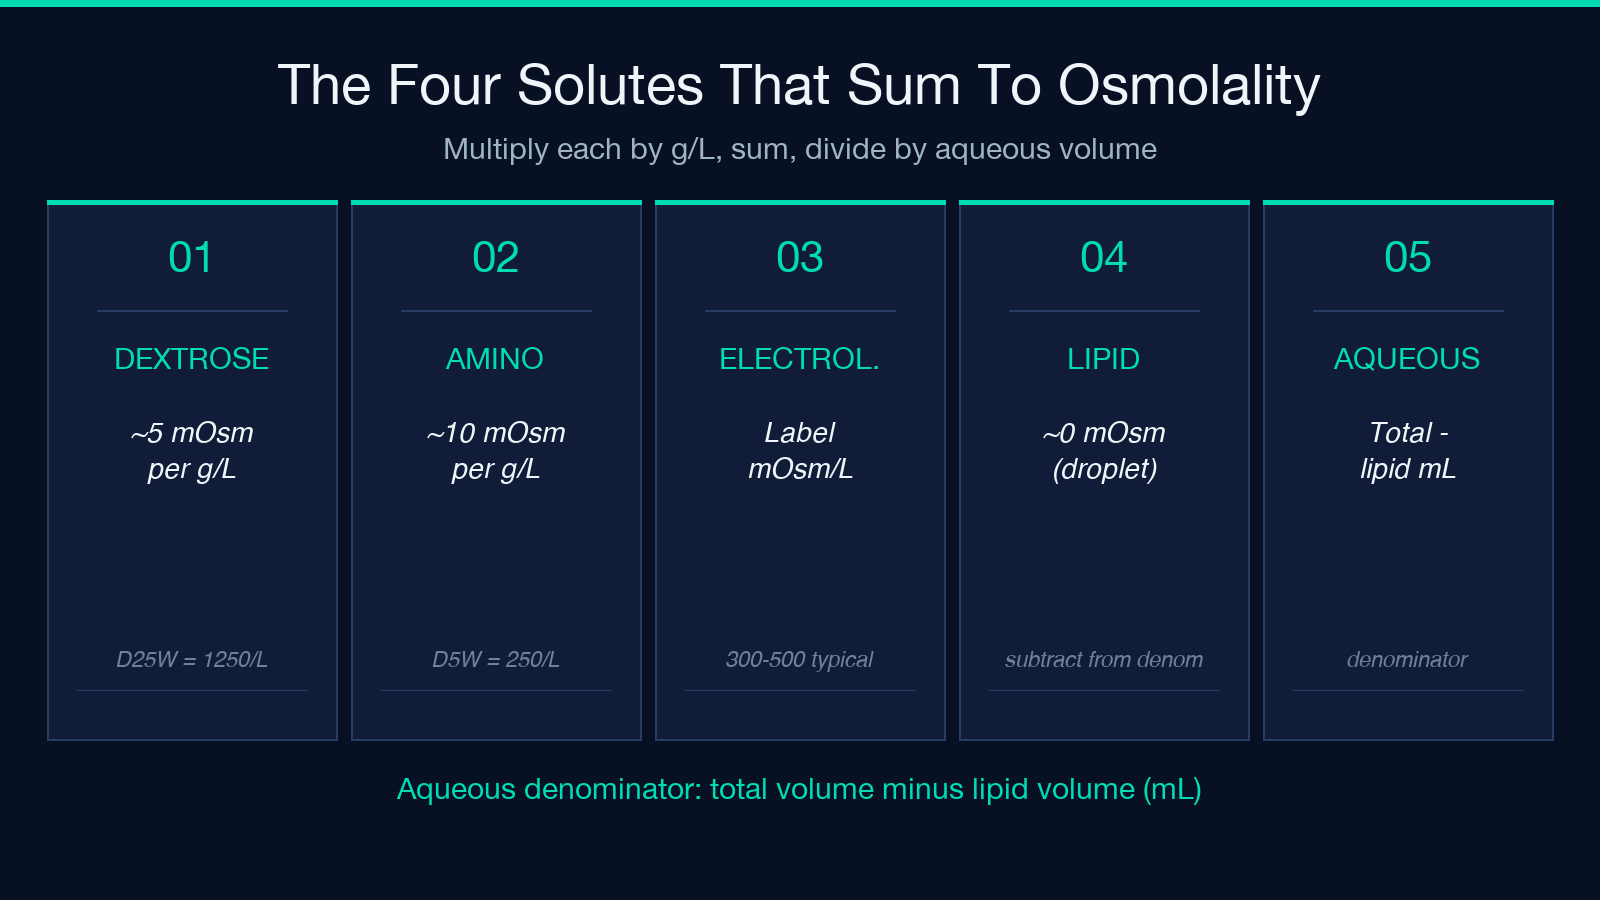
Lipid is the special case. 20% lipid emulsion is iso-osmolar with plasma (~300 mOsm/L) but contributes essentially zero to the measured osmolality because the fat droplets do not dissolve in the aqueous phase — the freezing-point depression probe ignores them. The estimator handles this by subtracting the lipid volume from the denominator before applying the ×5 and ×10 multipliers, so the math stays aligned with what a lab analyzer would report.
Two worked examples show the bands in action. The first — 1000 mL of D10W, 500 mL of amino acids 5%, 250 mL of 20% lipid, 350 mOsm/L electrolytes — comes out to roughly 850 mOsm/L and clears the peripheral threshold. The second — D25W 1000 mL, AA 10% 500 mL, lipid 250 mL, electrolytes 600 — lands at ~1767 mOsm/L and demands central access. Try both against the live estimator and the difference shows up as a labeled access recommendation under the output box.
The seven fields and what each one means
The form mirrors a PN label rather than a textbook equation, which matters at the bedside. Dextrose concentration is the percent w/v — D25W means 25 g per 100 mL, so the field accepts 25 for a 25% solution and multiplies internally. Dextrose volume is total milliliters of the dextrose component, not total PN volume. Amino acid concentration follows the same percent w/v convention — 8.5% is the standard hospital stock, 10% is common in critical care. Amino acid volume is total milliliters. Lipid volume is the 20% emulsion volume; the tool assumes 20% as standard, which is the universal pharmacy stock in the US. Electrolyte additive is the only field that reads from the PN label directly — most pharmacies print a single “mOsm/L from electrolytes” line, and 300 to 500 is a typical maintenance range, 600 to 800 for aggressive repletion.
The seventh field — decimal places — controls output precision only. Default 0 keeps the answer in whole mOsm/L, which matches how threshold rules are written; bumping to 2 lets you see the formula’s own drift from lab-measured osmolality, which routinely runs 100 to 200 mOsm/L away from the calculated value on high-electrolyte or neonatal admixtures.
What the estimator cannot do
Osmolality is one of two concerns when mixing a PN. The other is calcium-phosphate solubility — above certain concentration products, CaHPO₄ precipitates out of solution and the particles can travel to the pulmonary vasculature on infusion. The tool does not compute that curve, because precipitation depends on pH, temperature, amino-acid brand, and the order of mixing, not just on final concentrations. Pharmacy software handles calcium-phosphate compatibility as a separate module.
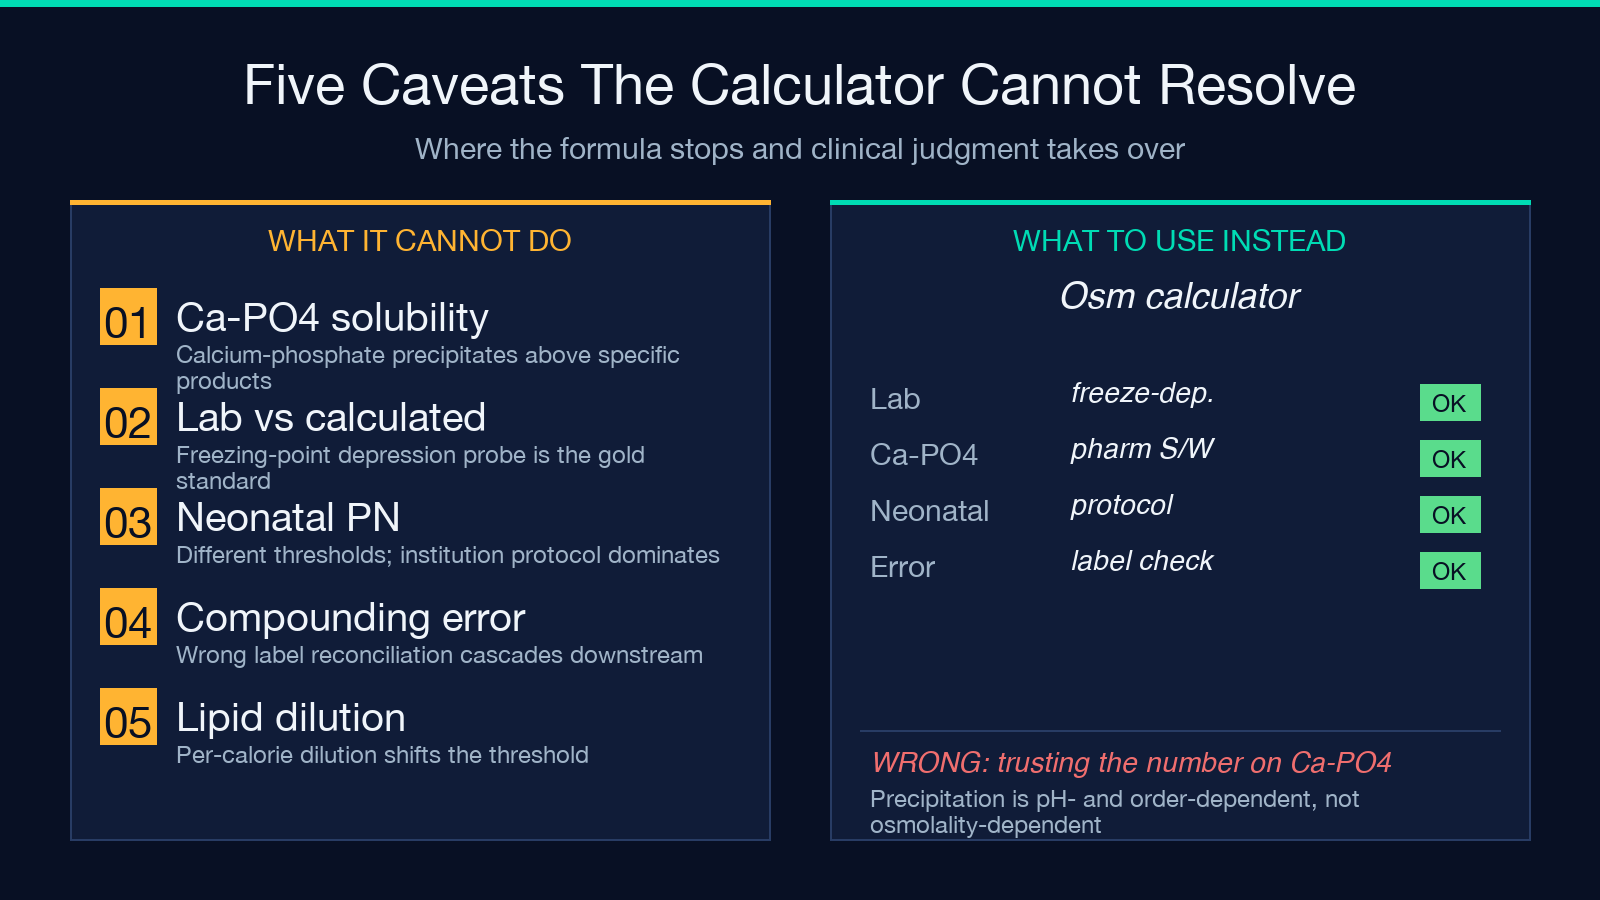
The estimator is also not a lab. The freezing-point depression osmometer (or vapor-pressure osmometer, less commonly) returns the gold standard, and the calculated value should agree within roughly 10 percent on a clean admixture and within 100 to 200 mOsm/L on a complex one. If the difference is larger, suspect a misread label or a compounding error before you trust the access recommendation. The disclaimer on the result page spells this out and links back to the three primary references behind the formula.
Reading the output without misreading the threshold
The output is a single number with a label. Below 900 reads “peripheral OK” and means a forearm or hand vein is reasonable for a 12-hour bag with site rotation. The 900 to 1200 band reads “borderline” and means the choice is institution-specific — some accept a PICC or midline with dilution, others centralize. Above 1200 reads “central access” because the phlebitis risk climbs faster than any rotation strategy can manage. The label is not a prescription; it is the consensus rule, and the discharge order, the protocol, and the patient always outrank it.
When to ignore the number
Three situations override the estimator. Neonatal PN — the thresholds were derived on adult veins; neonatal peripheral lines tolerate more, central lines are used more sparingly, and the institution-specific protocol dominates. High-electrolyte admixtures with aggressive calcium and phosphate — the calculated value is reliable but the calcium-phosphate solubility risk is the primary safety concern, not osmolality. Compounding errors — if the pharmacy printed a label you cannot reconcile with the actual stock bottles used, the number is downstream of a worse problem.
Beyond osmolality
The estimator at Elysia Tools is one tool in a larger pharmacy-math cluster — infusion rate calculators, electrolyte repletion estimators, anion gap, corrected sodium, and corrected calcium all sit nearby and feed off the same labels. Browse the full cluster at elysiatools.com and the related clinical-decision tools are a tab away.
Inputs the calculator expects and the references the thresholds rest on
The form mirrors a PN label rather than a textbook equation, which matters at the bedside. The seven fields break down as follows. Dextrose concentration is percent w/v and dextrose volume is total milliliters of the dextrose component. Amino acid concentration and amino acid volume follow the same convention. Lipid volume is the 20% emulsion volume; the tool assumes 20% as standard, which is the universal pharmacy stock in the US. Electrolyte additive is the only field that reads from the PN label directly — most pharmacies print a single “mOsm/L from electrolytes” line, and 300 to 500 is a typical maintenance range, 600 to 800 for aggressive repletion. Decimal places controls output precision; default 0 keeps the answer in whole mOsm/L, bumping to 2 shows the formula’s drift from lab-measured osmolality (typically 100 to 200 mOsm/L on complex admixtures).
The threshold bands and the formula rest on three primary sources. Mirtallo JM et al. Safe practices for parenteral nutrition formulation. JPEN 2004 — the standard reference for the four-solute sum and the peripheral-vs-central cutoffs. Pittiruti M, Hamilton H, Biffi R, MacFie J, Pertkiewicz M. ESPEN Guidelines on parenteral nutrition: central venous catheters (access, care, diagnosis and therapy of complications). Clin Nutr 2009 — the European consensus on access route thresholds and phlebitis risk. Dugan S, Le J, Jew RK. Maximum tolerated osmolarity for peripheral infusion in neonates: a retrospective chart review. JPEN 2014 — the pediatric and neonatal data that fills in the gap the adult literature leaves open.
