
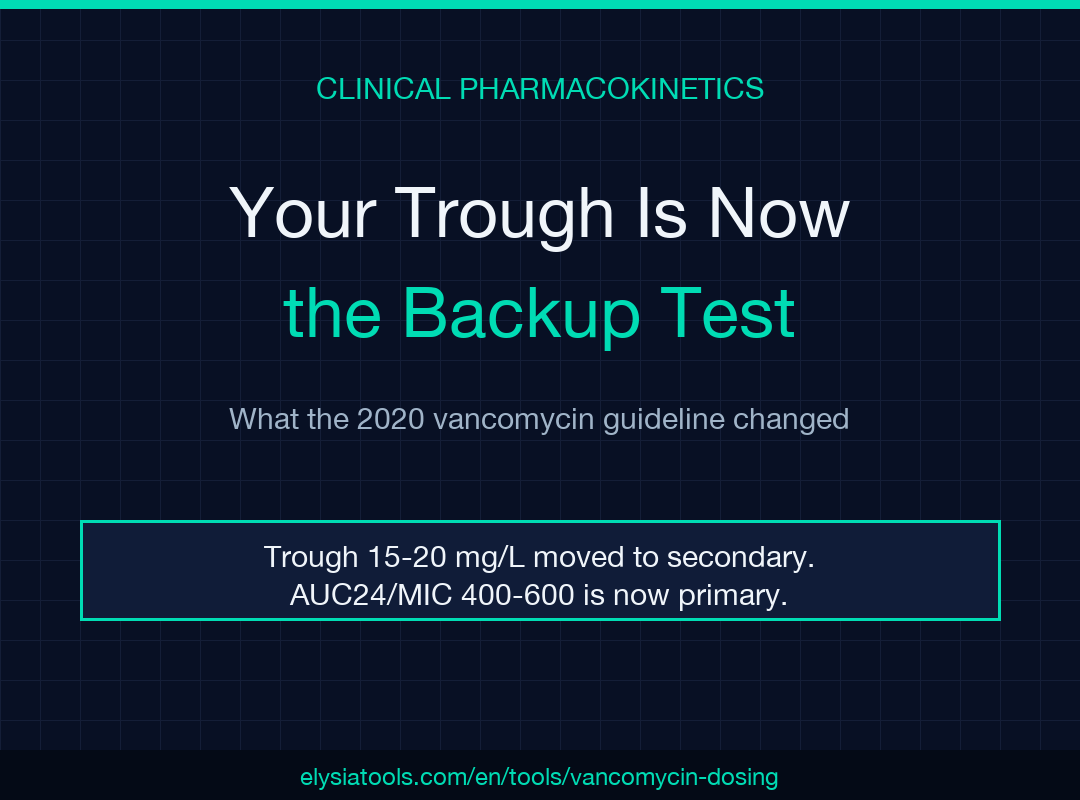
The trough was never the dose. For twenty years the number clinicians chased was one level drawn before the next infusion, held between 15 and 20 mg/L, read as proof the patient was covered. In 2020 the ASHP/IDSA guideline demoted that target and made exposure over the first day the primary measure. The drug did not change, but the arithmetic around it did, and the difference is not cosmetic.
The vancomycin empiric dosing calculator shows that shift in a useful place, because it computes both models at once and reports the number a lab would hand you. Read it closely and you find a seam, a cap, and two hard cliffs that no printed table reveals.
The target moved in 2020. The drug did not.
A trough is one photograph. AUC24 is the whole day of film.
Two patients can sit at a measured trough of 16 mg/L with completely different exposures: one clearing the drug at 80 mL/min on a twelve-hour interval, one at 45 mL/min on that same interval, with the level drawn eight hours early. The trough reads the same. The drug-day does not.
That is why the 2020 guideline cut trough-only monitoring from the primary role. Total exposure across one dosing day, expressed as AUC24 divided by the organism’s MIC, is the quantity that tracks both cure and nephrotoxicity. According to the guideline, that target should be reached within the first 24 to 48 hours. A reported trough of 15 to 20 mg/L survives as a secondary target, acceptable for serious MRSA cases when AUC tools are unavailable.
The calculator reflects that ordering honestly: it computes dose ranges, suggests an interval, and classifies a measured trough against the secondary band. What it cannot do is compute the exposure itself. Hold that thought; it returns as a limitation later.
Two ranges are stitched at 20 mg/kg
Loading dose runs 20 to 25 mg/kg. Maintenance runs 15 to 20 mg/kg. Put them side by side for a 75 kg adult and the seam is visible:
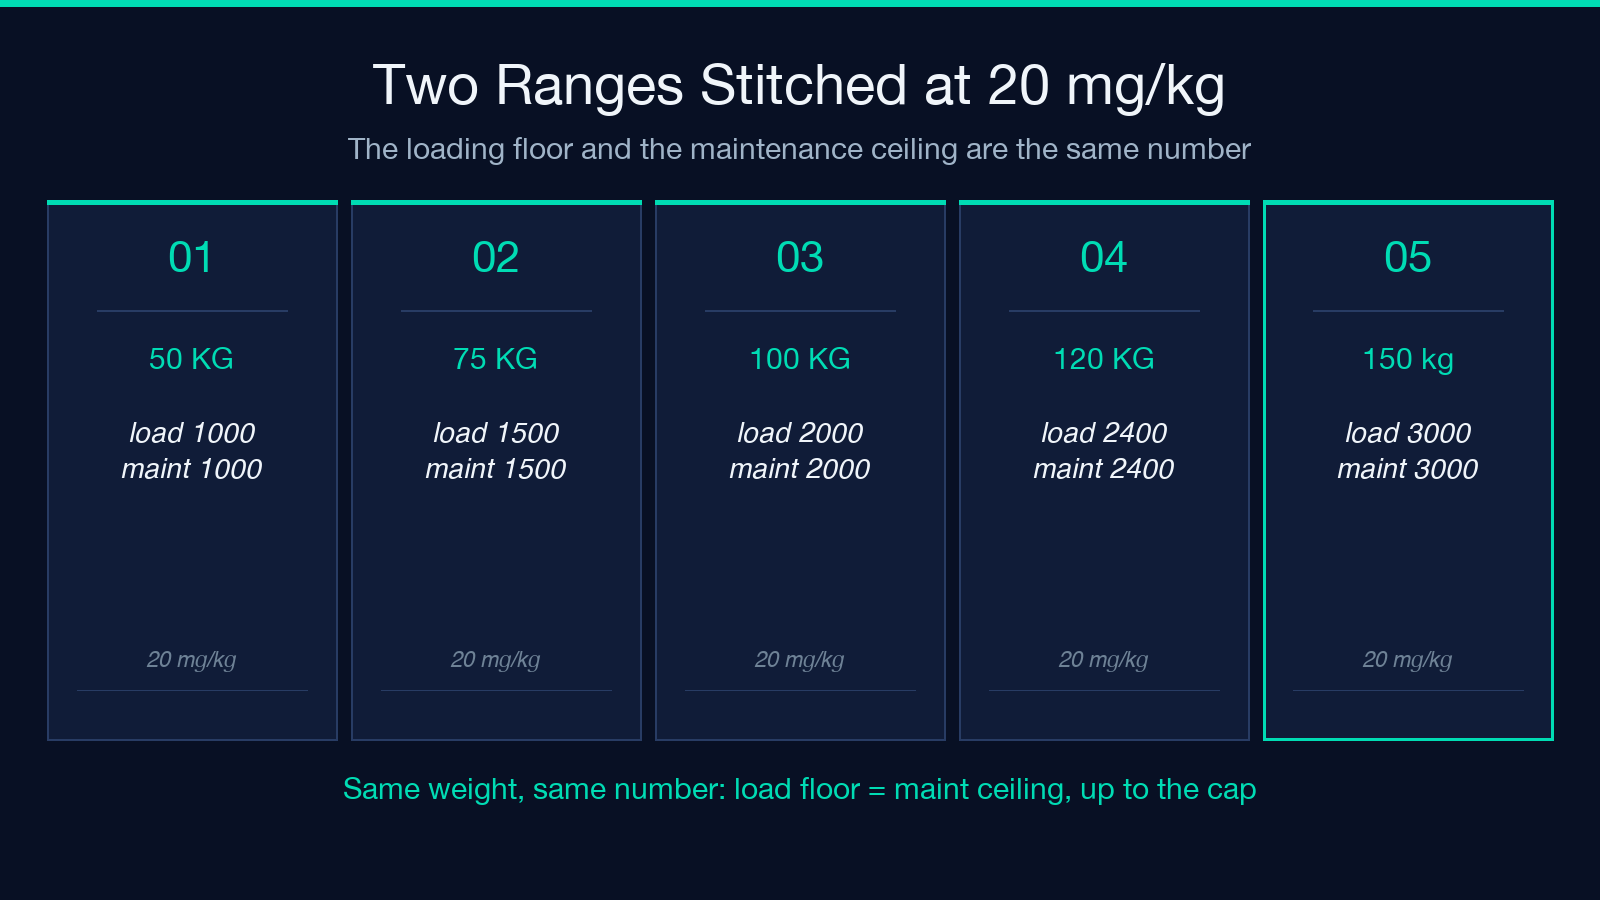
- Loading: 1500 to 1875 mg
- Maintenance: 1125 to 1500 mg
The top of maintenance and the bottom of loading are the same number, 1500 mg, because both are 20 mg/kg. That is not a coincidence in the guideline, and it is not a rounding artifact. A loading dose fills the volume the drug distributes into; a maintenance dose replaces what the body clears between intervals. The 20 mg/kg constant is where those two ideas meet, and the seam holds for all weights below the cap.
The consequence is worth carrying to a bedside: if the maintenance ceiling lands above the loading floor, one of the two numbers was never meant for this patient.
The 3000 mg cap flattens the loading range
The cap is applied to both ends of the range, not only the top. That single implementation detail changes what the output means.
- 120 kg: loading 2400 to 3000 mg. The range loses its right side.
- 149 kg: loading 2980 to 3000 mg. A 20 mg range, narrower than one vial.
- 150 kg: loading 3000 to 3000 mg. Two identical numbers with a dash between them.
A range that is zero milligrams wide is not a range. For example, the 200 kg case returns 3000 mg: 15 mg/kg, printed with no note attached. At 150 kg the tool has quietly converted “20 to 25 mg/kg” into “20 mg/kg exactly,” and the printed number stops responding to weight at all. Nothing in the output flags the shift, because the cap is a constant and constants do the same thing at all weights.
The label makes it worse. The tool’s description calls 3000 mg an obesity cap, but there is no obesity input: no BMI, no ideal body weight, no body-size correction. The cap forces the same number on all weights above 150 kg, lean or not. The clinical correction for adiposity, which the guideline does describe, has to be applied by whoever reads the screen.
Above 150 kg, maintenance outruns loading
Maintenance is uncapped. It stays 15 to 20 mg/kg of actual body weight no matter how heavy the patient is, while loading stops dead at 3000 mg.
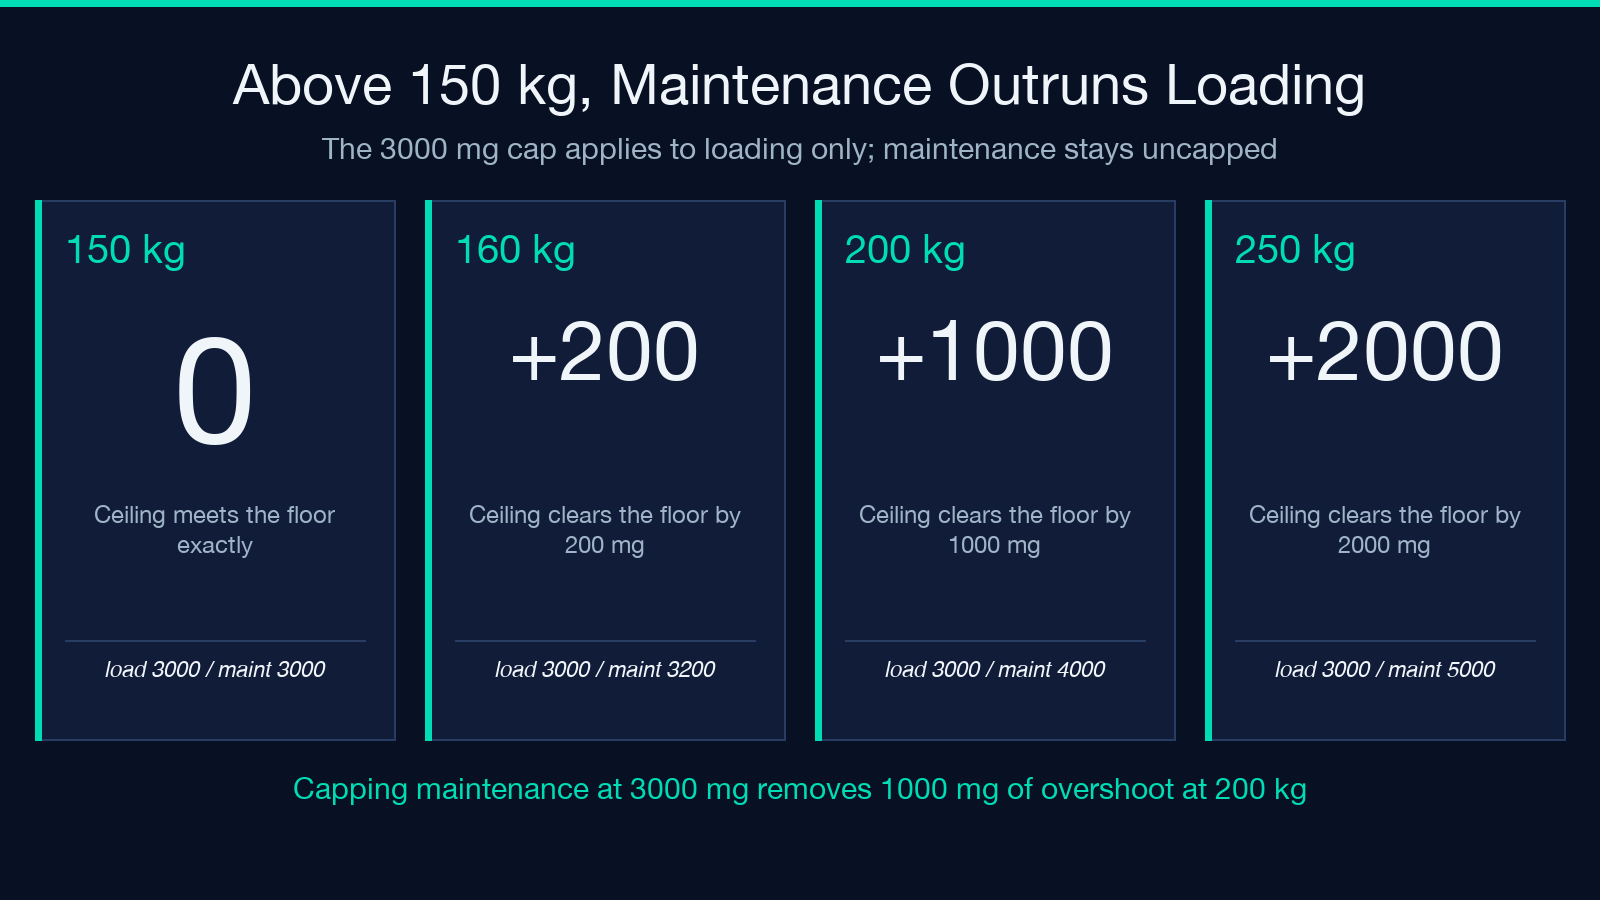
- 160 kg: loading 3000 mg, maintenance 2400 to 3200 mg. The ceiling clears the floor by 200 mg.
- 200 kg: loading 3000 mg, maintenance 3000 to 4000 mg. The ceiling clears it by 1000 mg.
This is a contradiction, not a rounding problem. A maintenance dose whose upper bound exceeds the loading dose’s lower bound implies the concentration keeps climbing after the load finishes, which no one-compartment model supports. The crossover is exact and easy to prove: the maintenance ceiling exceeds the loading floor whenever 20 times weight is greater than the smaller of 20 times weight and 3000, so the break begins at any weight above 150 kg.
The fix is not exotic. Apply the same 3000 mg ceiling to the maintenance range, which removes 1000 mg of overshoot at 200 kg, or compute the loading dose from adjusted body weight in the obese patients where the guideline designed it to apply. The tool reports plain weight-based arithmetic; the correction is yours.
CrCl buys you an interval, not a dose
Creatinine clearance does one job here, and it does that job with hard edges.
- CrCl 90 or above: q8h
- CrCl 50 to 89: q12h
- CrCl 30 to 49: q18-24h
- CrCl 10 to 29: q24h
- CrCl below 10: q24-48h
The boundaries are cliffs, not slopes. A CrCl of 49.9 returns q18-24h; a CrCl of 50.0 returns q12h — one tenth of a milliliter per minute cuts the planned daily dose by a third to a half. There is no q16h option at all, so the ladder jumps from 12 hours to 18 and forces a six-hour gap that real patients land in routinely.
That is not a flaw in the calculator; it is a flaw in using a single number as a stand-in for clearance. CrCl assumes stable renal function, which a septic patient on day two does not have. It also cannot see the direction of travel. Two readings of 50 mL/min are identical to this tool whether the patient is recovering or sliding.
The trough kept exactly one job
The secondary classification is a set of half-open bands, which means a small move crosses a label:
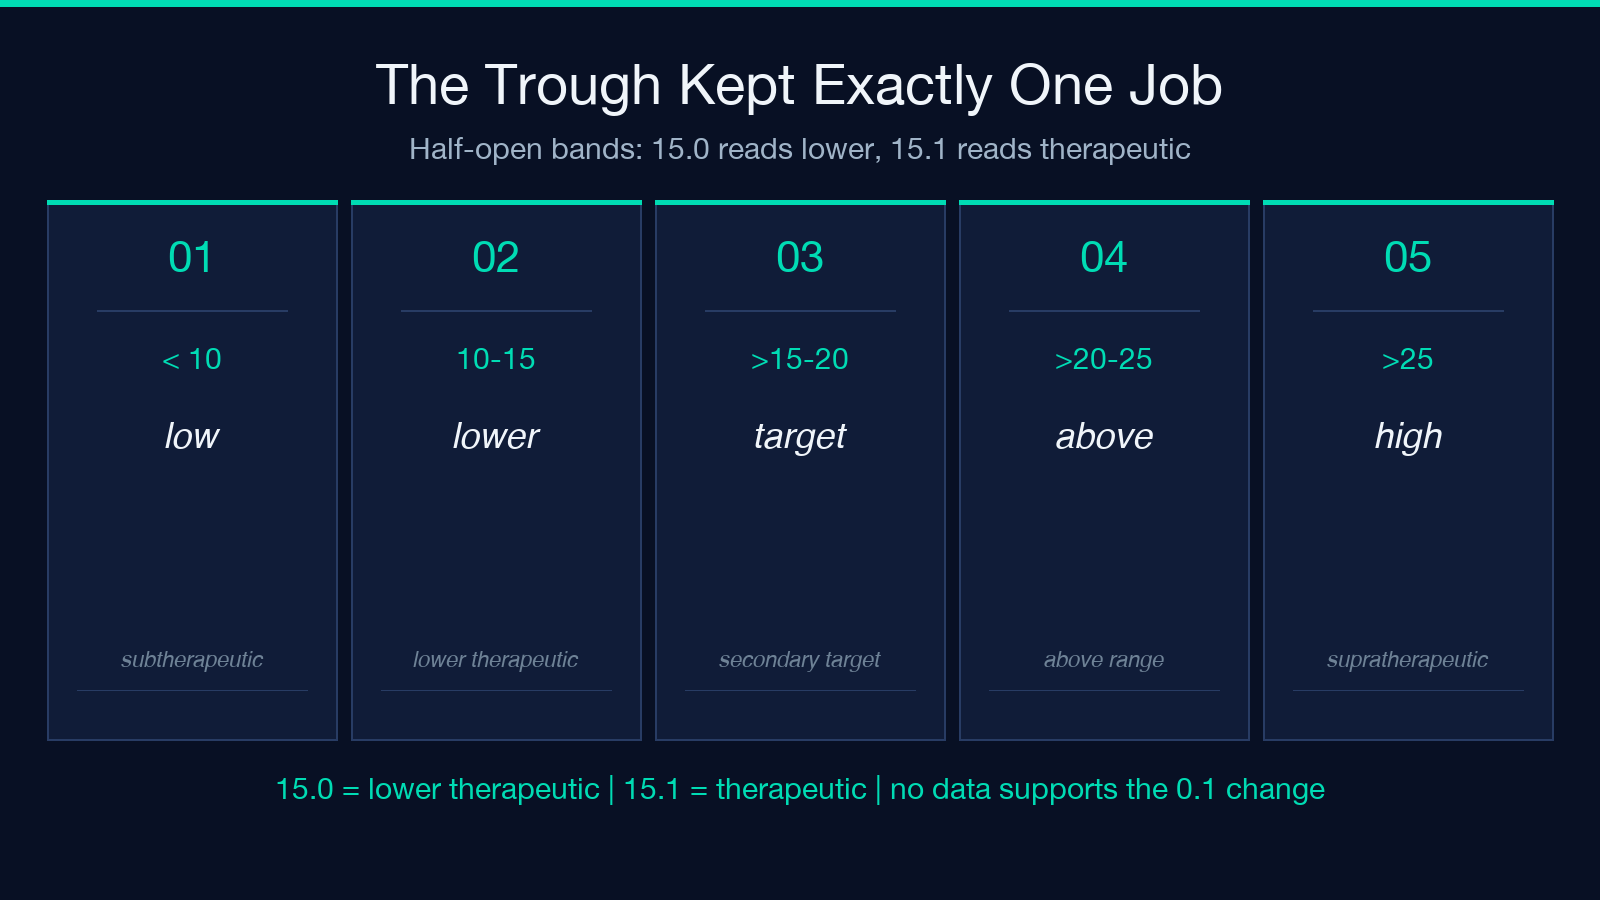
- Below 10 mg/L: subtherapeutic
- 10 to 15 mg/L: lower therapeutic
- Above 15 to 20 mg/L: therapeutic, secondary target
- Above 20 to 25 mg/L: above traditional range
- Above 25 mg/L: supratherapeutic
Read the boundaries closely. An observed trough of 15.0 mg/L is labeled lower therapeutic. The same patient at 15.1 is labeled therapeutic. A tenth of a milligram per liter moves the patient from one category to another, and the label carries an action sentence with it. Here is the split at a glance: 15.0 closes the lower band, 15.1 opens the therapeutic one, and the action sentence flips with the label.
No data supports treating a 0.1 mg/L difference as a change in care. The labels are the weakest part of therapeutic drug monitoring and the easiest part to over-read. A band is a prompt to look at the whole day, not a verdict. The guideline says the same thing in plainer language: “trough-only monitoring is no longer recommended as primary.”
What this calculator will never tell you
The honest limits, in the order they will bite you:
- It does not compute AUC. It prints the target string, not the exposure. Two levels and a Bayesian fit, or a validated AUC tool, still have to do that work.
- It has no renal replacement therapy path. A CrCl under 10 collapsing to q24-48h is a coarse substitute for dialysis dosing.
- It excludes pediatrics and neonates, where clearance scales with age, not weight.
- It cannot detect obesity, despite capping for it.
- The input label reads “Target trough (mg/L),” but the code classifies a measured one. Target and measured are a plan and an observation, and the tool treats them the same.
None of these is hidden. The tool states plainly that it produces “empiric starting doses only,” to be individualized by AUC-guided monitoring, and that it is not medical advice. What it does not show is where its own arithmetic stops being clinically meaningful — and that is the part worth naming.
The 60-second order-set read
Before you accept any vancomycin order, four questions break most of the ambiguity:
- Which weight is the dose based on: actual, ideal, or size-corrected?
- Did the interval come from a CrCl, or from a habit?
- Is monitoring planned as AUC or trough-only, and does the order say which?
- Is there a reassess date, or does the order run open-ended?
Each answer maps to a number this tool prints, and none of them is a number this tool can choose for you. Run the arithmetic at Elysia Tools with your own patient’s weight and clearance, then compare the output against the order in front of you. The gap between the two usually shows where the real question sits.
Explore more tools at elysiatools.com.
I treated that trough number as the answer for years. It was a proxy, and a decent one, until the guideline priced the real measurement. Next time a level lands in front of you, ask two things: what hour it was drawn, and what exposure it stands in for. If the answer is 400 to 600 over the first day, the trough was never lying. It was answering a smaller question than yours. Which question is your order set asking?
本文有中文版:万古霉素谷浓度,如今只是备选检查
