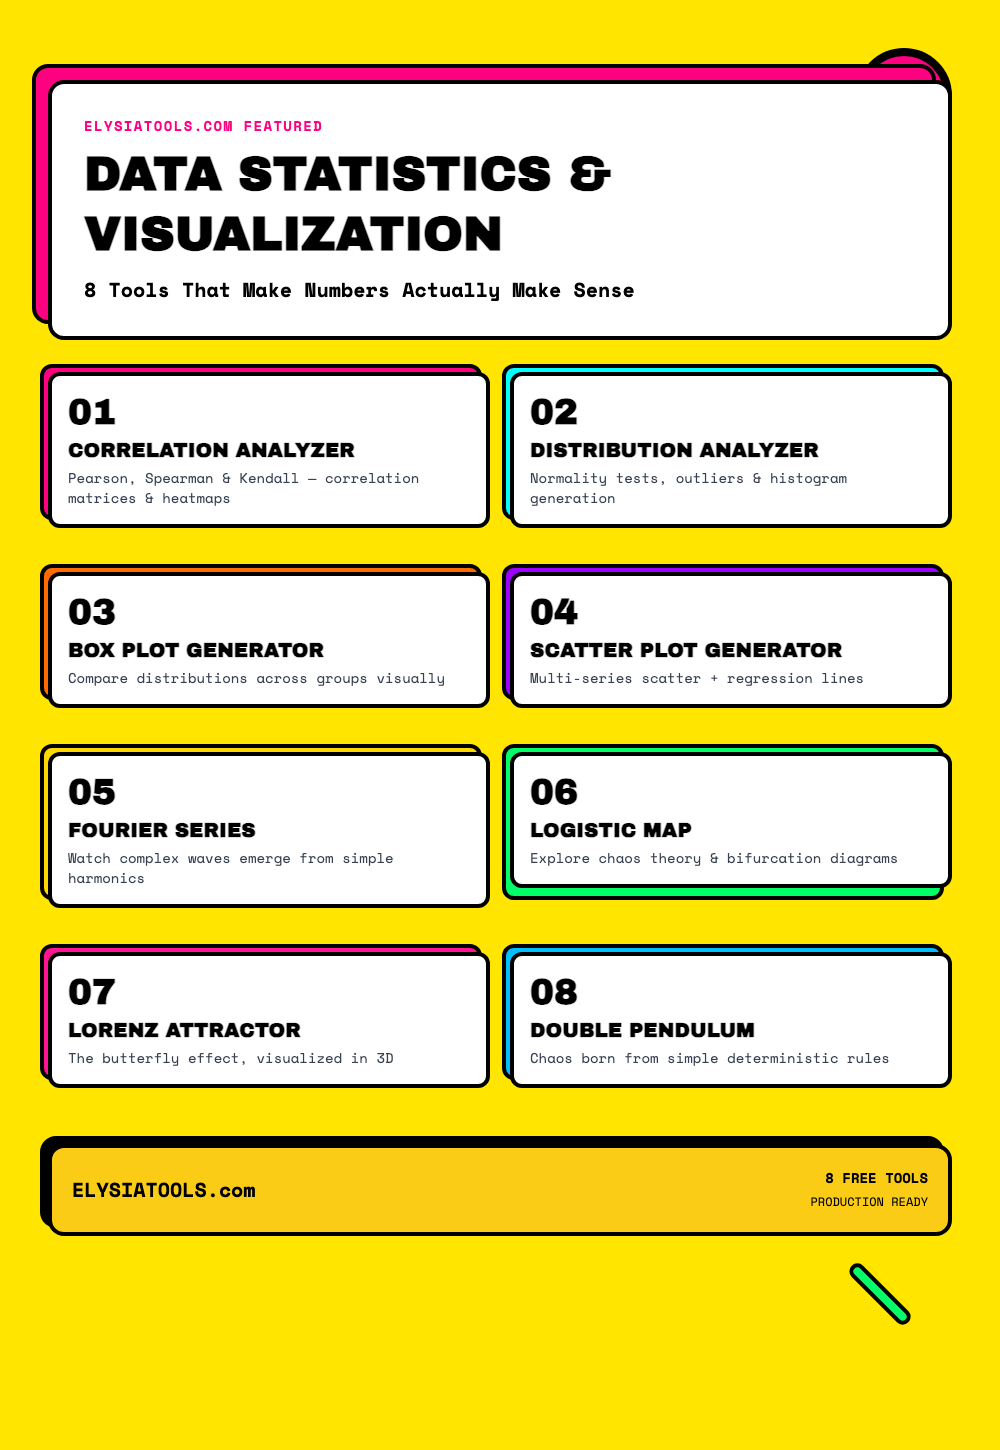
Every dataset tells a story. But before you can read that story, you need the right tools to decode it. Whether you’re a data scientist hunting for correlations, a student wrestling with statistics homework, or just someone who wants to actually understand what their data is saying — the tools you use matter more than you think.
In this post, we’re exploring 8 free, browser-based tools from ElysiaTools that transform raw numbers into crystal-clear insights. No installation required. No credit card. Just open the browser and go.
🗺️ Part 1: Data Analysis Tools
1. Correlation Analyzer
Correlation is one of the most powerful concepts in statistics — and one of the most misunderstood. The Correlation Analyzer doesn’t just calculate correlation coefficients; it gives you the full picture with Pearson, Spearman, and Kendall methods, confidence intervals, p-values, and even a heatmap visualization.
What makes it exceptional:
- Auto-detects numeric columns from your CSV data
- Handles missing values with 5 different strategies
- Outlier detection using IQR, Z-score, and modified Z-score methods
- Group analysis — compare correlations across different categories
- Detailed statistical significance testing
Drop in a dataset with stock prices, temperature readings, or survey responses — and within seconds you have a complete correlation matrix showing which variables move together and which ones don’t.
2. Data Distribution Analyzer
Most statistical tests assume your data follows a normal distribution. But how do you actually check that? The Data Distribution Analyzer puts every major normality test at your fingertips: Anderson-Darling, Shapiro-Wilk, and Jarque-Bera — all in one place.
But it doesn’t stop there. It also:
- Detects outliers using IQR and Z-score methods
- Calculates skewness, kurtosis, and the coefficient of variation
- Generates histogram frequency data and percentile analysis
- Identifies the best-fit distribution for your data
- Provides plain-English interpretation of results
Throw in a dataset of exam scores, enzyme activity measurements, or website load times — the tool tells you what distribution your data follows and whether parametric tests are even valid.
3. Box Plot Generator
The box plot is one of the most elegant charts in statistics. In a single glance, you can see the median, quartiles, whiskers, and outliers for multiple groups — perfect for comparing distributions side by side.
The Box Plot Generator makes this effortless:
- JSON or key-value data formats supported
- Customizable colors, orientation, and box width
- Optional mean markers (shown as diamonds)
- Detailed statistics table: count, mean, std dev, Q1, Q3, and outlier count
- SVG output — crisp at any resolution
Comparing customer wait times across 3 different support centers? Box plots show you everything at once — no squinting at spreadsheets required.
4. Scatter Plot Generator
Scatter plots are the go-to visualization for exploring relationships between two variables. The Scatter Plot Generator handles both single-series and multi-series data with style.
Standout features:
- Multiple data series with distinct colors
- Optional linear regression lines with R² values
- Auto-scaling or manual axis range control
- Customizable point size, opacity, and background colors
- Interactive tooltips showing point coordinates
Plot revenue vs. marketing spend across 5 regions, or map height vs. weight for different age groups. The regression line and R² make it immediately clear whether the relationship is strong or weak.
🦋 Part 2: Interactive Math Visualizations
Numbers come alive when you can see them move. ElysiaTools also hosts a stunning collection of interactive math visualizations that make abstract concepts tangible.
5. Fourier Series
Here’s one of the most beautiful truths in all of mathematics: any periodic function — even a jagged square wave — can be constructed entirely from sine and cosine functions. The Fourier Series visualization lets you watch this happen in real time.
Draw a custom curve on the canvas, or select a square wave or sawtooth wave. As you increase the number of terms (harmonics), watch the epicycles trace out increasingly perfect shapes. It’s equal parts mesmerizing and illuminating — the kind of visualization that makes a professor’s explanation finally click.
Use it to understand: signal processing, audio synthesis, image compression, and the fundamental mathematics behind everything from JPEG compression to quantum mechanics.
6. Logistic Map
One of the most famous equations in chaos theory fits on a single line: x(n+1) = r · x(n) · (1 – x(n)). Yet this innocent-looking recurrence relation produces behavior so complex that it revolutionized our understanding of deterministic chaos.
The Logistic Map visualization shows you the bifurcation diagram — as you increase the parameter r, the system transitions from orderly to periodic to fully chaotic behavior. At certain values, tiny changes in the starting conditions produce wildly different outcomes. That’s chaos.
Use it to understand: population dynamics, chaos theory, the butterfly effect, and why long-term weather prediction is fundamentally impossible.
7. Lorenz Attractor
Edward Lorenz wasn’t trying to discover chaos. He was running a weather simulation in 1963, and to save computing time, he rounded his initial conditions from 6 decimal places to 3. The result: a completely different weather pattern. That 0.0001 difference — what we now call sensitive dependence on initial conditions — birthed chaos theory.
The Lorenz Attractor visualization renders this famous “butterfly” shape in real time 3D. You can rotate it, zoom in, and watch trajectories that start centimeters apart diverge into entirely different paths. It’s the mathematical emblem of the butterfly effect.
Use it to understand: atmospheric dynamics, chaotic systems, the limits of prediction, and why deterministic systems can be fundamentally unpredictable.
8. Double Pendulum
There’s something almost philosophical about the double pendulum. Two simple rods, two pivot points, one equation of motion. The result? A system so chaotic that its long-term behavior is fundamentally unpredictable — even though it’s governed entirely by deterministic physics.
The interactive visualization lets you set initial conditions and watch the pendulum swing through its mesmerizing, never-quite-repeating dance. It’s simultaneously a fun toy and a profound demonstration of how simple deterministic rules can produce endlessly complex, unrepeatable behavior.
Use it to understand: Hamiltonian mechanics, chaotic dynamics, nonlinear systems, and why even “simple” physical systems can be impossible to predict over long time horizons.
🎯 Why ElysiaTools?
Every tool on ElysiaTools is:
- 100% free — no paywall, no “pro” version hiding basic features
- Browser-based — no installation, no downloads, works on any device
- Production-ready — outputs are clean, reproducible, and exportable
- Multilingual — interfaces available in English, Chinese, Spanish, French, German, Portuguese, Russian, and more
Whether you’re crunching numbers for a research paper, building dashboards for a startup, or just exploring math for the joy of it — ElysiaTools has your back.
🚀 Get Started
All 8 tools are live and free right now at ElysiaTools.com. No signup required. Bookmark it, share it with your students or colleagues, and start turning data into understanding.
Because the best analysis tools are the ones you’ll actually use.