# 8 Free Chemistry Visualizations That Make Invisible Concepts Actually Click
In chemistry, the most important things are invisible. You can’t see electrons flowing. You can’t see a molecule’s shape. You can’t see pH changing drop by drop — until something turns blue, or red, or stops conducting altogether.
That’s the gap these tools are built to fill.
ElysiaTools maintains a free library of interactive chemistry visualizations that let you manipulate variables, watch reactions in real time, and build genuine intuition rather than memorizing equations. Here are eight worth bookmarking.
—
1. Acid-Base Indicators — See pH as Color, Not a Number
Most students learn pH as a scale from 0 to 14. But the actual experience of watching a solution change color at a specific pH — that’s what makes it real.
The Acid-Base Indicators tool lets you simulate titration with multiple indicators: litmus, phenolphthalein, methyl orange. Control pH directly or run a full titration and watch the color transition happen in real time.
Each indicator has a specific transition range. Phenolphthalein goes clear below pH 8.2 and pink above 10.0. Methyl Orange shifts from red to yellow between 3.1 and 4.4. These ranges aren’t arbitrary — they correspond directly to the pKa of the indicator molecule.
This means choosing an indicator isn’t guesswork: you pick one whose transition range brackets the equivalence point. For a strong acid-strong base titration, either phenolphthalein or methyl orange works. For a weak acid-strong base, phenolphthalein is the right choice precisely because its range (8.2–10.0) captures the steep equivalence point region.
When to use it: When you’re trying to understand why a particular indicator is chosen for a particular titration. Or when you need to visualize the relationship between pH and indicator color without running an actual lab.
—
2. Chromatography — Watch Separation Happen, Not Just Read About It
Chromatography is one of those techniques that sounds simple in a textbook (“components separate based on their affinities”) but feels abstract until you see the peaks form on a chromatogram.
The Chromatography Principles tool simulates a chromatographic column and generates a live chromatogram as you adjust parameters: flow rate, column length, particle size, temperature. You can see how retention time shifts when you change the mobile phase composition — a change that in real labs can take hours of preparation to test.
The tool also calculates resolution (how well two peaks are separated) and theoretical plates (a measure of column efficiency). In pharmaceutical quality control, these metrics determine whether a separation is “good enough” to release a drug batch.
When to use it: Before a lab session, to build intuition for what variables actually affect separation quality. Or when you’re studying analytical methods and want to see how theory translates to the shape of a chromatogram.
—
3. Galvanic Cell — One Equation Explains Everything, If You Can See It
The Nernst equation is notorious: E = E° – (RT/nF)lnQ. Students memorize it. But why does the voltage drop when concentration changes? Why does a dead battery recover slightly when it warms up?
The Galvanic Cell EMF tool puts the Nernst equation into an interactive cell diagram. You adjust electrode materials, concentrations, and temperature — and watch the cell potential respond. The visualization shows the electrode half-reactions updating in real time.
Temperature dependence is particularly instructive: the equation’s RT/nF term means warmer cells produce higher voltage. This is why some batteries perform better in the cold and why EV range drops in winter — not just because of heating demands, but because the electrochemical reactions themselves slow down.
When to use it: When the Nernst equation feels disconnected from physical reality. This tool bridges the gap between the formula and what’s actually happening at the zinc and copper electrodes.
—
4. Spectrophotometry — Beer-Lambert Law Made Visible
Spectrophotometry sits at the intersection of chemistry and physics. You shine light through a sample, measure how much gets absorbed, and calculate concentration. The governing equation — A = εbc — is clean. But knowing when it breaks down is where real analytical chemistry begins.
The Spectrophotometry tool visualizes the Beer-Lambert Law and then shows you exactly where it stops working: at high concentrations (molecular interactions change absorption), at narrow bandwidths, when stray light is present. You see absorbance and transmittance curves shift as you change concentration, path length, and wavelength.
In clinical diagnostics, spectrophotometry is how blood glucose is measured. In environmental science, it’s how nitrate and phosphate levels in water are quantified. The law is foundational; so are its limitations.
When to use it: When studying analytical chemistry or preparing for lab work that involves UV-Vis spectroscopy. The deviation section alone is worth the visit.
—
5. VSEPR Model — Molecular Shape Is Everything
In chemistry, structure determines reactivity. A molecule’s shape controls whether it will fit into an enzyme’s active site, whether it will be polar, whether it will absorb light at a particular wavelength.
The VSEPR Model tool lets you input a central atom and its bonded atoms or lone pairs, then watch the geometry arrange itself. Linear, trigonal planar, tetrahedral, trigonal bipyramidal, octahedral — the tool shows electron pair arrangements, bond angles, and the resulting molecular shapes side by side.
The ammonia molecule (NH₃) is a classic example: one lone pair on nitrogen creates a trigonal pyramidal geometry with a 107° bond angle rather than the 109.5° you’d expect from tetrahedral electron geometry. That shape makes ammonia polar, which is why it dissolves so readily in water — and why it acts as a base.
When to use it: When 3D molecular geometry feels like a memorization problem rather than a logic problem. VSEPR has clear rules; this tool makes those rules tangible.
—
6. pH Calculator — Not Just a Number, a Landscape
pH is logarithmic. A solution at pH 3 isn’t slightly more acidic than pH 4 — it’s ten times more acidic. A pH 2 solution is one hundred times more acidic. This scale compresses an enormous range of hydrogen ion concentrations into manageable numbers, but it also makes the math invisible.
The pH Calculator goes beyond simple pH-from-concentration calculations. It shows the full titration curve, plots pH versus [H⁺] on a log scale, and lets you compare strong acid vs. weak acid behavior with the same parameters.
For a strong acid-strong base titration, the equivalence point sits exactly at pH 7. For a weak acid-strong base, it’s above 7 — because the conjugate base of the weak acid hydrolyzes. This is the difference that makes or breaks buffer selection, and this tool shows it visually.
You can also overlay indicator ranges on the titration curve — which is exactly how indicators are chosen in practice.
When to use it: When working through acid-base titration problems and you want to verify your calculations. Or when you’re trying to understand why a weak acid titration curve looks the way it does.
—
7. Buffer Solution — Why Your Blood Doesn’t Change pH When You Drink Coffee
Buffers resist pH change. That’s their whole job. But the mechanism — a conjugate acid-base pair absorbing added H⁺ or OH⁻ without the pH swinging — is something most students nod at without truly internalizing.
The Buffer Solution tool shows buffer action dynamically. You set up a buffer (choose the acid and its conjugate base, set their concentrations), then add acid or base and watch the pH curve respond. The buffer capacity curve — β vs. pH — shows you exactly where your buffer is most resistant to change and where it collapses.
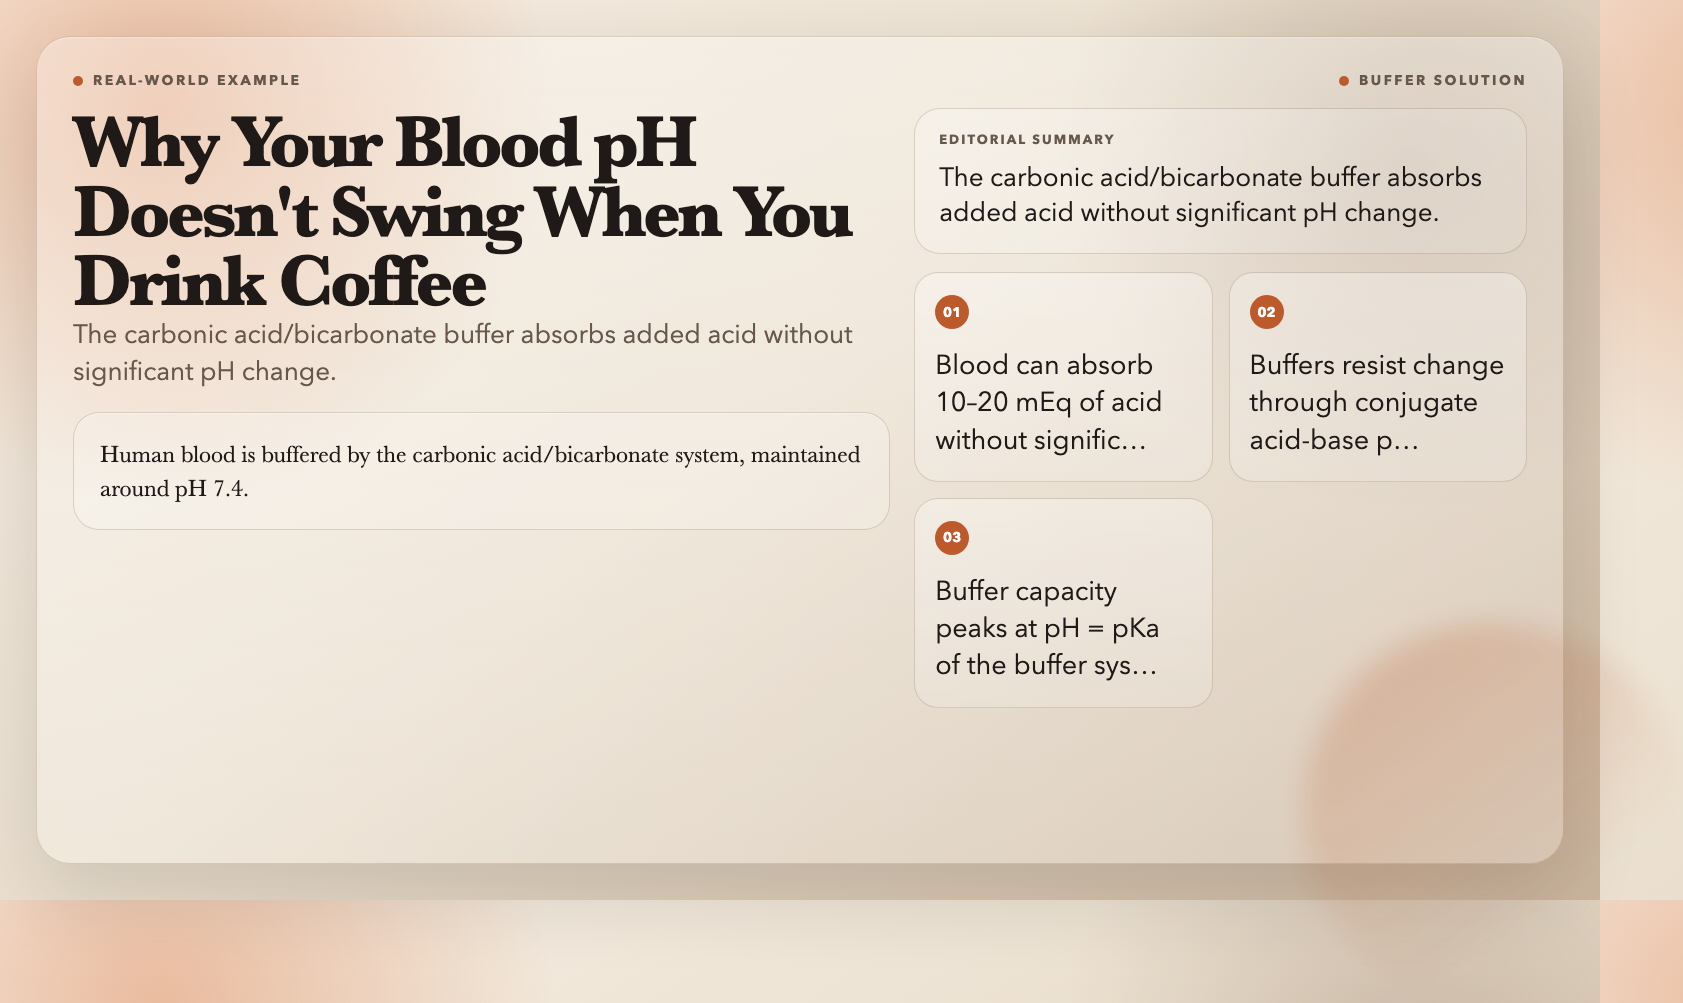
Human blood is buffered by the carbonic acid/bicarbonate system, with a pH maintained around 7.4. Add a strong acid (like the acid in coffee) and the bicarbonate absorbs the H⁺, forming carbonic acid. The pH barely moves. This is why your body can handle a morning coffee without your blood becoming dangerously acidic — the buffer system handles roughly 10–20 mEq of acid without significant pH change.
The tool includes preset common buffer systems (acetate, phosphate, carbonate) so you can see how real-world buffers are designed.
When to use it: When you need to understand why buffers matter — in biological systems, in lab preparations, in pharmaceutical formulations. The buffer capacity visualization in particular clarifies something textbooks usually state but rarely show.
—
8. Redox Titration — Watching Electrons Transfer in Slow Motion
Redox titrations are hard to visualize because the action is invisible: electrons moving between species, potentials shifting, equivalence approached and passed. Unlike acid-base titrations, there’s no color change unless you add an indicator — and even then, the change is often subtle.
The Redox Titration tool animates the full process. You set the analyte and titrant concentrations, their standard reduction potentials, and the number of electrons transferred. The tool generates the complete potential-vs-volume curve, highlights the equivalence point jump, and shows how different indicators behave across that jump.
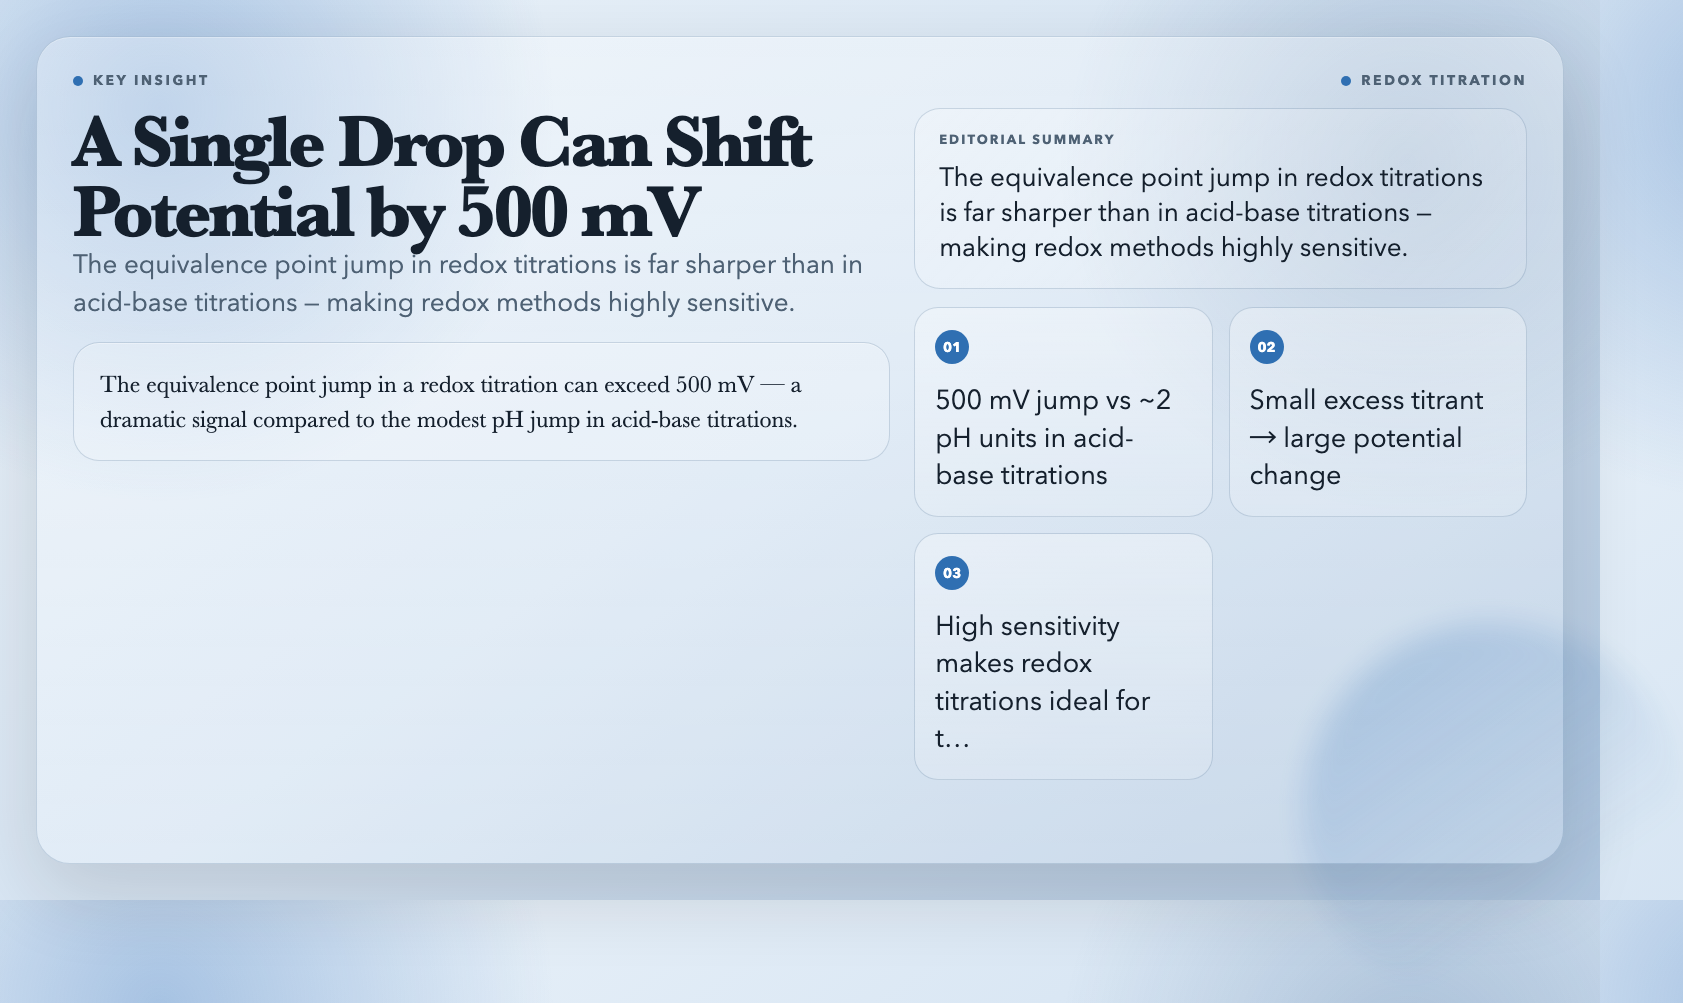
The equivalence point jump in a redox titration can exceed 500 mV — a dramatic signal compared to the modest pH jump in acid-base titrations. This large jump is what makes redox titrations highly sensitive: a small amount of excess titrant produces a large change in electrode potential.
When to use it: When studying analytical methods or electrochemistry. Redox titrations connect directly to the galvanic cell topic above — the same Nernst principles apply, now applied to a quantitative determination method.
—
The Unsolved Problem
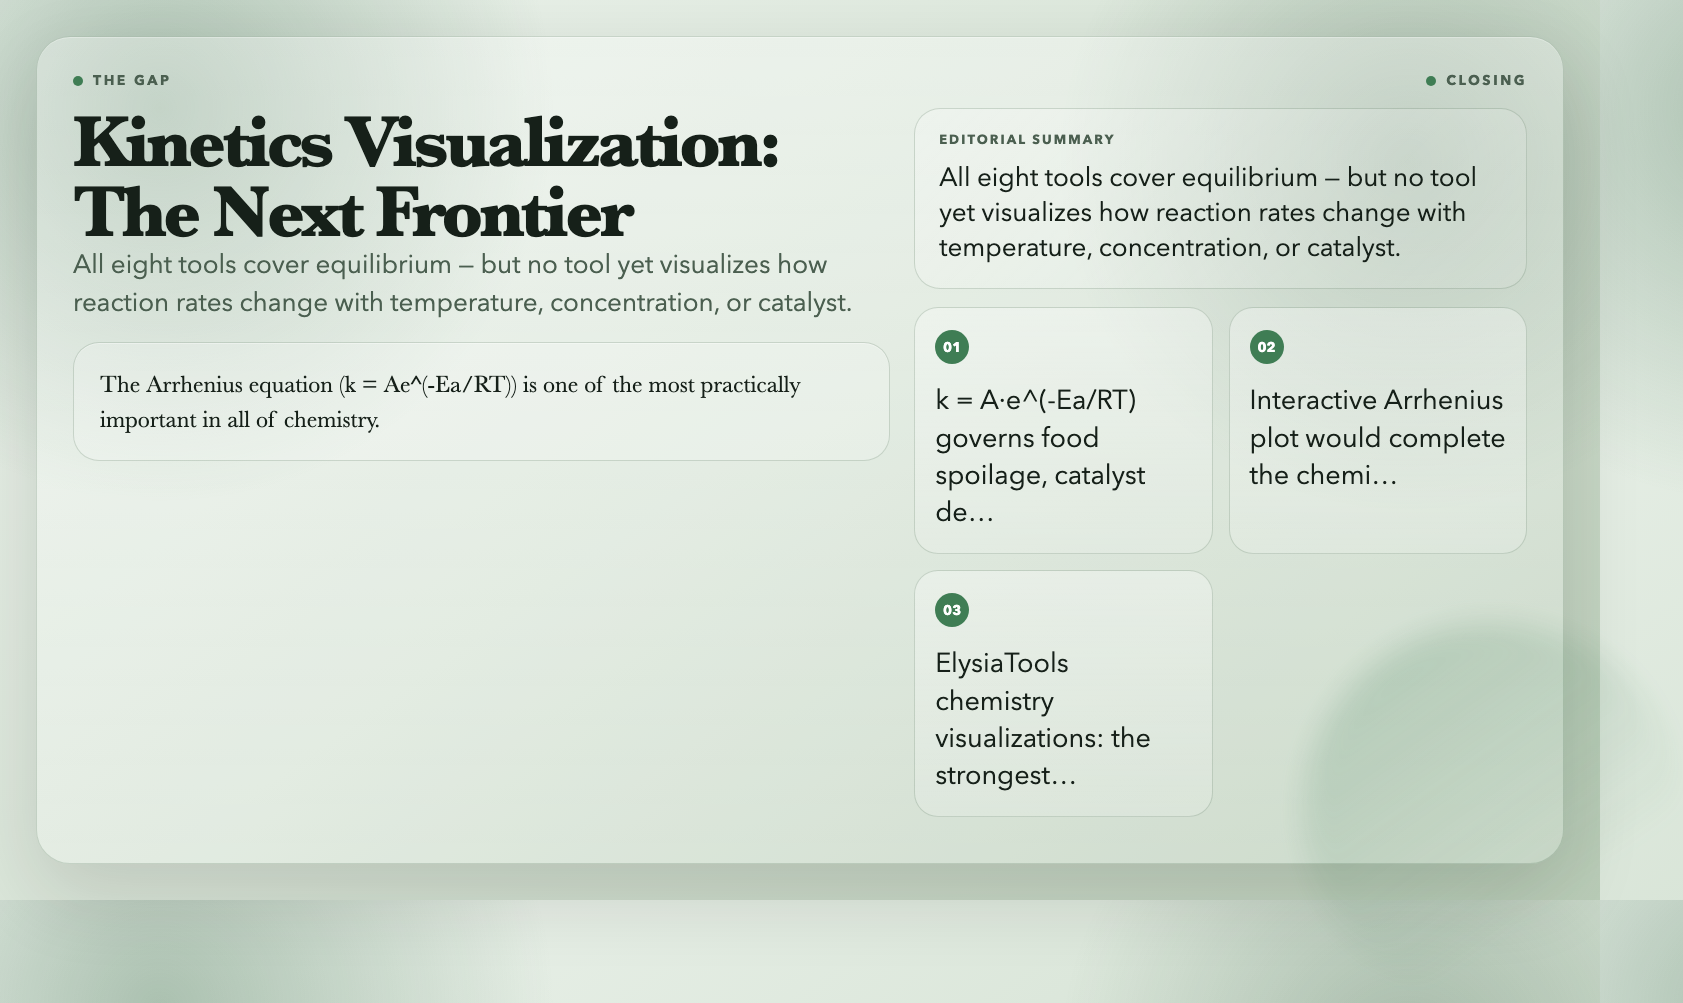
These eight tools cover a lot of ground. But there’s a gap worth naming: real-time reaction kinetics visualization. You can model equilibrium, titration, and electrochemistry interactively — but watching a reaction rate change as you adjust temperature, concentration, or a catalyst? That visualization is harder to build and harder to find.
The Arrhenius equation (k = Ae^(-Ea/RT)) is one of the most practically important in all of chemistry — it describes everything from how food spoils at room temperature to how industrial catalysts accelerate chemical production. An interactive treatment as good as what these eight tools offer would be genuinely valuable. The chemistry visualizations above are the best place to start, but kinetics remains the next frontier.