The Math Law Behind Every Fraud Detection Tool You’ve Ever Used
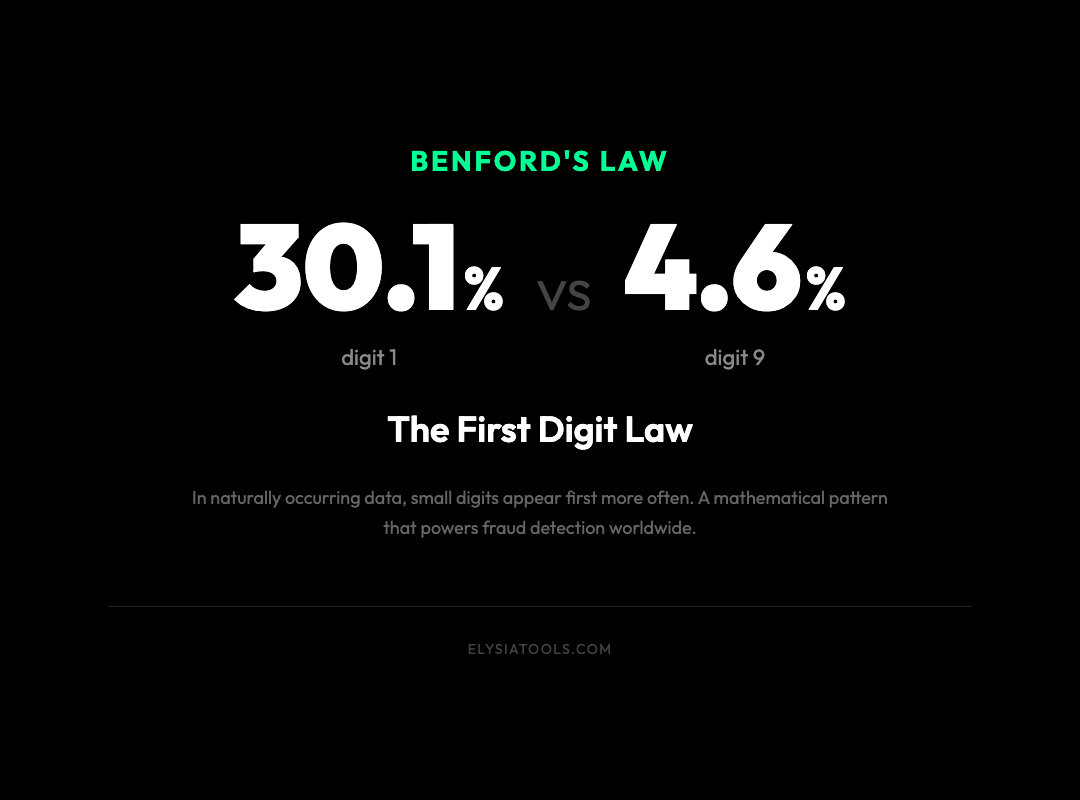
Here’s a number that should bother you: in naturally occurring data, the digit 1 shows up as the first number about 30% of the time. The digit 9? Just 4.6%.
That gap is not a coincidence. It is Benford’s Law — and it is one of the most counterintuitive patterns in mathematics.
The Pattern Nobody Expects
Benford’s Law states that for many real-world datasets, the probability of a leading digit *d* follows:
P(d) = log₁₀(1 + 1/d), for d = 1, 2, …, 9
This gives you a precise distribution: 1 appears first about 30.1% of the time, 2 about 17.6%, 3 about 12.5%, and so on down to 9 at just 4.6%.
You would expect all nine digits to appear equally — about 11% each. Benford’s Law says they do not. And once you see why, the pattern feels obvious.
Why It Works: Logarithmically Speaking
Numbers cluster on a logarithmic scale. From 1 to 2, you cross most of the logarithmic range. From 8 to 9, you barely move. Naturally growing data — populations, stock prices, river lengths — spans multiple orders of magnitude, and that logarithmic spacing makes smaller leading digits more likely to appear first.
This is why Benford’s Law surfaces everywhere data crosses several magnitudes. World country populations. City elevations. Stock prices. The Fibonacci sequence. Distances between cities. Prime number distributions. All converge toward this same probability curve.
Uniform random numbers, though, break the pattern immediately. Random numbers between 1 and 100,000 do not follow Benford’s Law — because they are artificially bounded, not naturally grown.
Why Auditors, Journalists, and Scientists Care
Benford’s Law’s real power is as a detection tool. When real-world data follows the curve closely, it suggests the numbers were generated naturally. When it deviates, something may be wrong.
– Election analysis: Vote counts that break Benford’s distribution have flagged irregularities in several national elections.
– Financial audits: Tax returns, expense reports, and financial statements that don’t conform to the curve are worth investigating. The 2019 report on Greece’s economic data is one well-documented case where analysts used Benford’s Law to question reported figures.
– COVID-19 reporting: Several research groups applied the law to test whether case count reports from different countries showed signs of manipulation.
– Scientific papers: Journals have started using Benford’s Law as a screening tool to flag datasets that may have been fabricated.
The test is simple: compute the chi-squared statistic between observed leading digits and the theoretical distribution. If the result exceeds the critical value at 95% confidence, the data is statistically inconsistent with Benford’s Law. That does not prove fraud — but it tells you where to look.
A Free Tool That Runs the Test in Seconds
The Benford’s Law Visualization on ElysiaTools handles this entire workflow in your browser — no spreadsheet required.
You get three ways to feed data in:
1. Preset datasets: World population by country, world GDP, Fibonacci numbers, powers of 2, perfect squares, prime numbers, and uniform random numbers as a control group.
2. Custom data: Paste any comma-separated or newline-separated list of numbers. Paste a column of figures from a report you are auditing and the tool will analyze the leading digit distribution immediately.
3. Formula generator: Enter any formula — n², 2ⁿ, n!, prime(n) — and the tool generates a sequence and tests it against Benford’s Law. This is especially useful for exploring how different mathematical processes converge toward (or diverge from) the expected distribution.
For each analysis, the tool displays:
– A bar chart comparing your observed distribution against the theoretical Benford curve
– A chi-squared test result with the statistic, critical value, and a plain-English conclusion
– A detailed table breaking down each digit’s theoretical probability, observed frequency, count, and deviation
You can adjust sample size from 10 to 10,000 data points with a slider, watching how the observed distribution converges toward the theoretical curve as sample size grows — a live demonstration of the Law of Large Numbers.
The Skeptical View
Benford’s Law is not magic. It does not catch every type of manipulation. Numbers constrained to a narrow range — like human heights in centimeters, or test scores on a 0–100 scale — will not follow the distribution. And sophisticated fraud can be engineered to pass the test. The law is a detector of naive faking, not a forensic audit on its own.
But that is exactly why it is useful as a first pass. If you are reviewing a budget proposal, auditing a supplier’s invoices, or checking the statistical claims in a research paper, running a Benford’s test takes seconds. A conforming result lets you move on. A non-conforming result tells you where to dig.
Try It
Head to Benford’s Law Visualization and paste in your own data. See whether your company’s expense figures conform. Check the county-level COVID statistics you downloaded last year. Run your own city’s population data against the curve.
You might not find fraud. But once you have run a few datasets through the tool, you will start to see the pattern everywhere — in the numbers in your spreadsheets, in the figures in the reports you read, in the statistics cited in the articles you come across. Benford’s Law will quietly rewire how you read any column of numbers.
The visualization is free, runs entirely in your browser, and requires no account. Open Benford’s Law Visualization and paste in your first dataset today.