# 7 Free Physics Visualizations That Reveal What Your Textbooks Won’t Show You
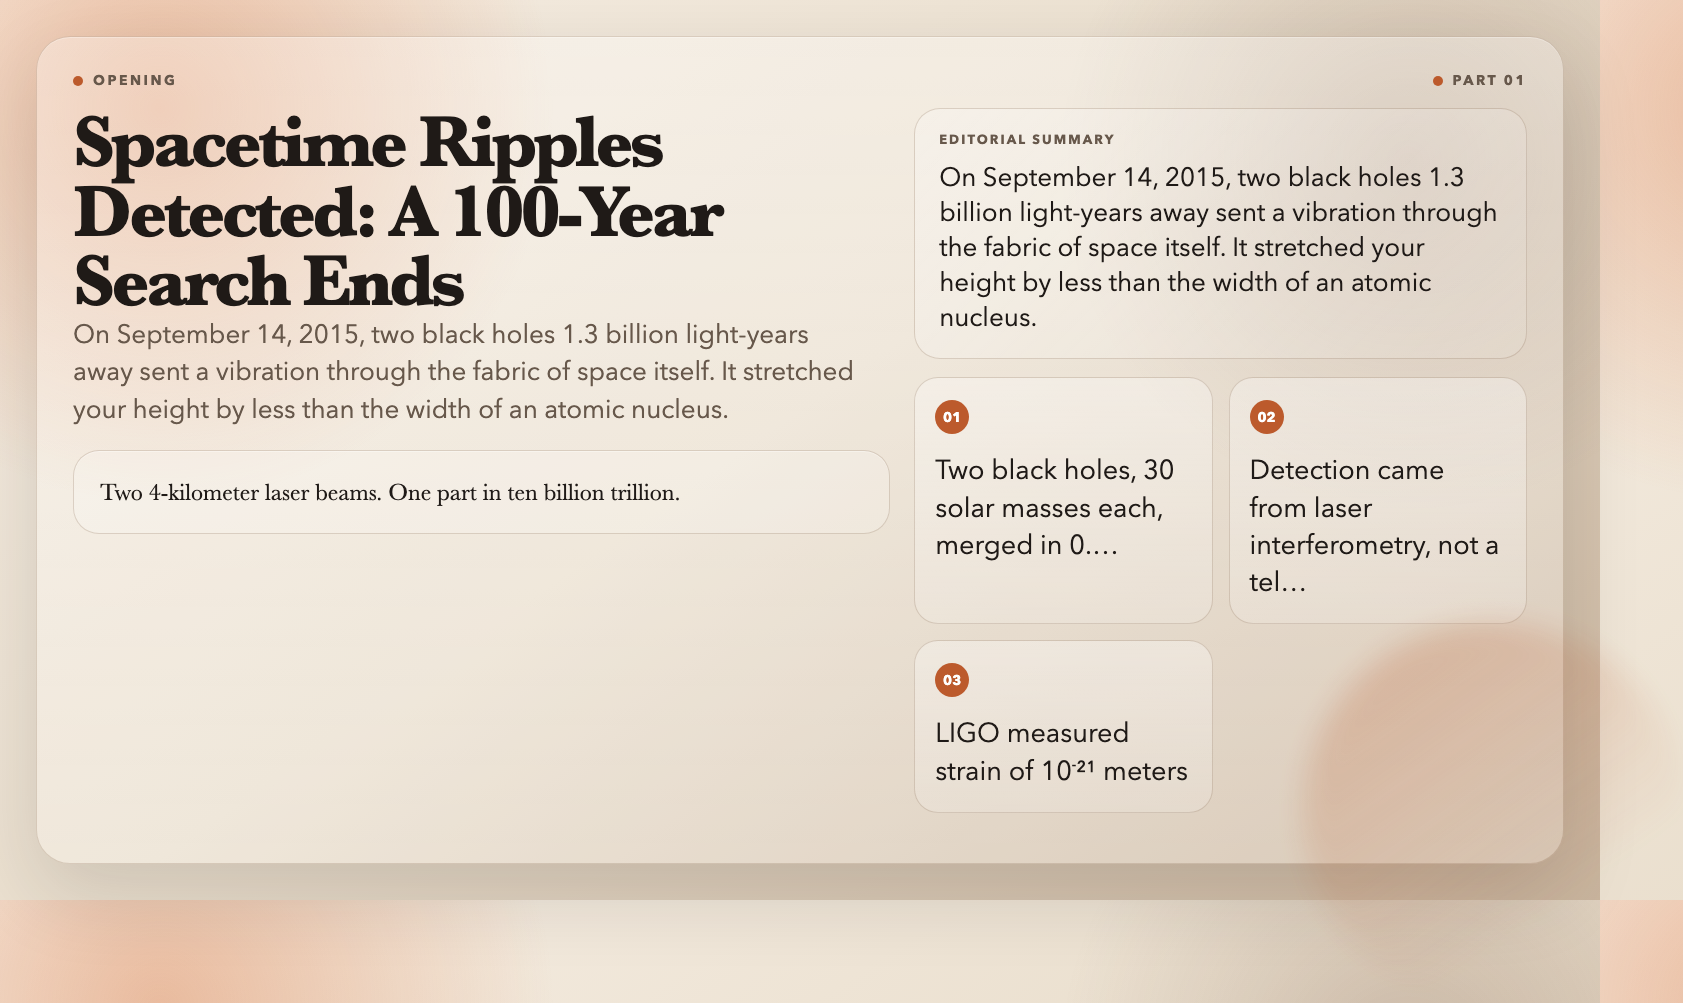
On September 14, 2015, two black holes 1.3 billion light-years away collided. The event lasted 0.2 seconds and sent a ripple through the fabric of spacetime itself. It stretched your height by less than the width of an atomic nucleus, then was gone. Physicists had been searching for it for 100 years.
That detection—LIGO’s first gravitational wave observation—didn’t come from a telescope. It came from two 4-kilometer laser beams arranged in an L-shape, measuring distances so precisely that the noise floor was measured in 10⁻¹⁸ meters. That’s not a typo.
The visualizations below do something textbooks can’t: they let you see the invisible. Not just the equations, but the actual phenomena—the geometry of curved spacetime, the probability clouds of quantum tunneling, the pressure gradients that keep aircraft aloft. All free, all running in your browser, all interactive.
—
1. Black Holes Aren’t Eternal — They Evaporate
Here’s what textbooks rarely emphasize: black holes die.
In 1974, Stephen Hawking showed that black holes aren’t perfectly black. Quantum effects at the event horizon produce thermal radiation—now called Hawking radiation—and black holes slowly lose mass over time. The smaller the black hole, the hotter it burns. A black hole the mass of a car would evaporate in about a nanosecond, releasing energy equivalent to roughly 10 megatons of TNT.
This is mainstream physics, not speculation. And it opens one of the deepest unsolved problems in science: the black hole information paradox, which sits at the intersection of quantum mechanics and general relativity. When a black hole evaporates completely, what happens to the information that fell into it? Quantum mechanics says information can’t be destroyed. General relativity says it goes into the singularity. Both can’t be right.
The Black Hole Hawking Radiation visualization lets you set an initial mass and watch it evaporate in real time. Adjust display scale (linear vs. logarithmic), initial mass, visualization speed, and toggles for the accretion disk and relativistic jets. The final explosion phase is particularly striking—as mass approaches zero, temperature spikes toward infinity and power output detonates.
Why it matters: A stellar-mass black hole has a Hawking temperature of about 10⁻⁸ Kelvin. But a primordial black hole—something that could theoretically have formed in the early universe with the mass of an asteroid—would run at thousands of Kelvin and be visible in X-rays. None have been detected yet. But their absence in the cosmic X-ray background is itself a constraint on the nature of dark matter.
—
2. Gravitational Waves — When Space Itself Ripples
Gravitational waves are not pressure waves or electromagnetic waves. They’re a stretching and compressing of space itself—distance measured perpendicular to the wave’s direction of travel. When a gravitational wave passes through LIGO, one 4-kilometer arm stretches by about 10⁻¹⁸ meters while the other compresses by the same amount.
The LIGO detection in 2015 came from two black holes, each about 30 solar masses, spiraling into each other. The merger released energy equivalent to about 3 solar masses converted entirely into spacetime curvature traveling at the speed of light. The signal was visible for 0.2 seconds. The chirp—from a frequency of 35 Hz to 250 Hz in a fraction of a second—is still one of the most striking sounds in physics.
The Gravitational Waves visualization shows the binary black hole merger in real time. Switch between the spacetime grid view, the LIGO detector response panel, and charts showing frequency and amplitude evolution. Presets include the LIGO-type stellar-mass merger, supermassive black hole inspirals, and neutron star collisions.
Why it matters: Gravitational wave astronomy is a new kind of telescope. Before 2015, we could only observe the universe through electromagnetic radiation. Now we can listen to it. LIGO and Virgo have since detected over 200 events, including the 2017 neutron star merger that was simultaneously observed by 70 conventional telescopes across the globe—the beginning of true multi-messenger astronomy.
—
3. Quantum Tunneling — When Particles Walk Through Walls
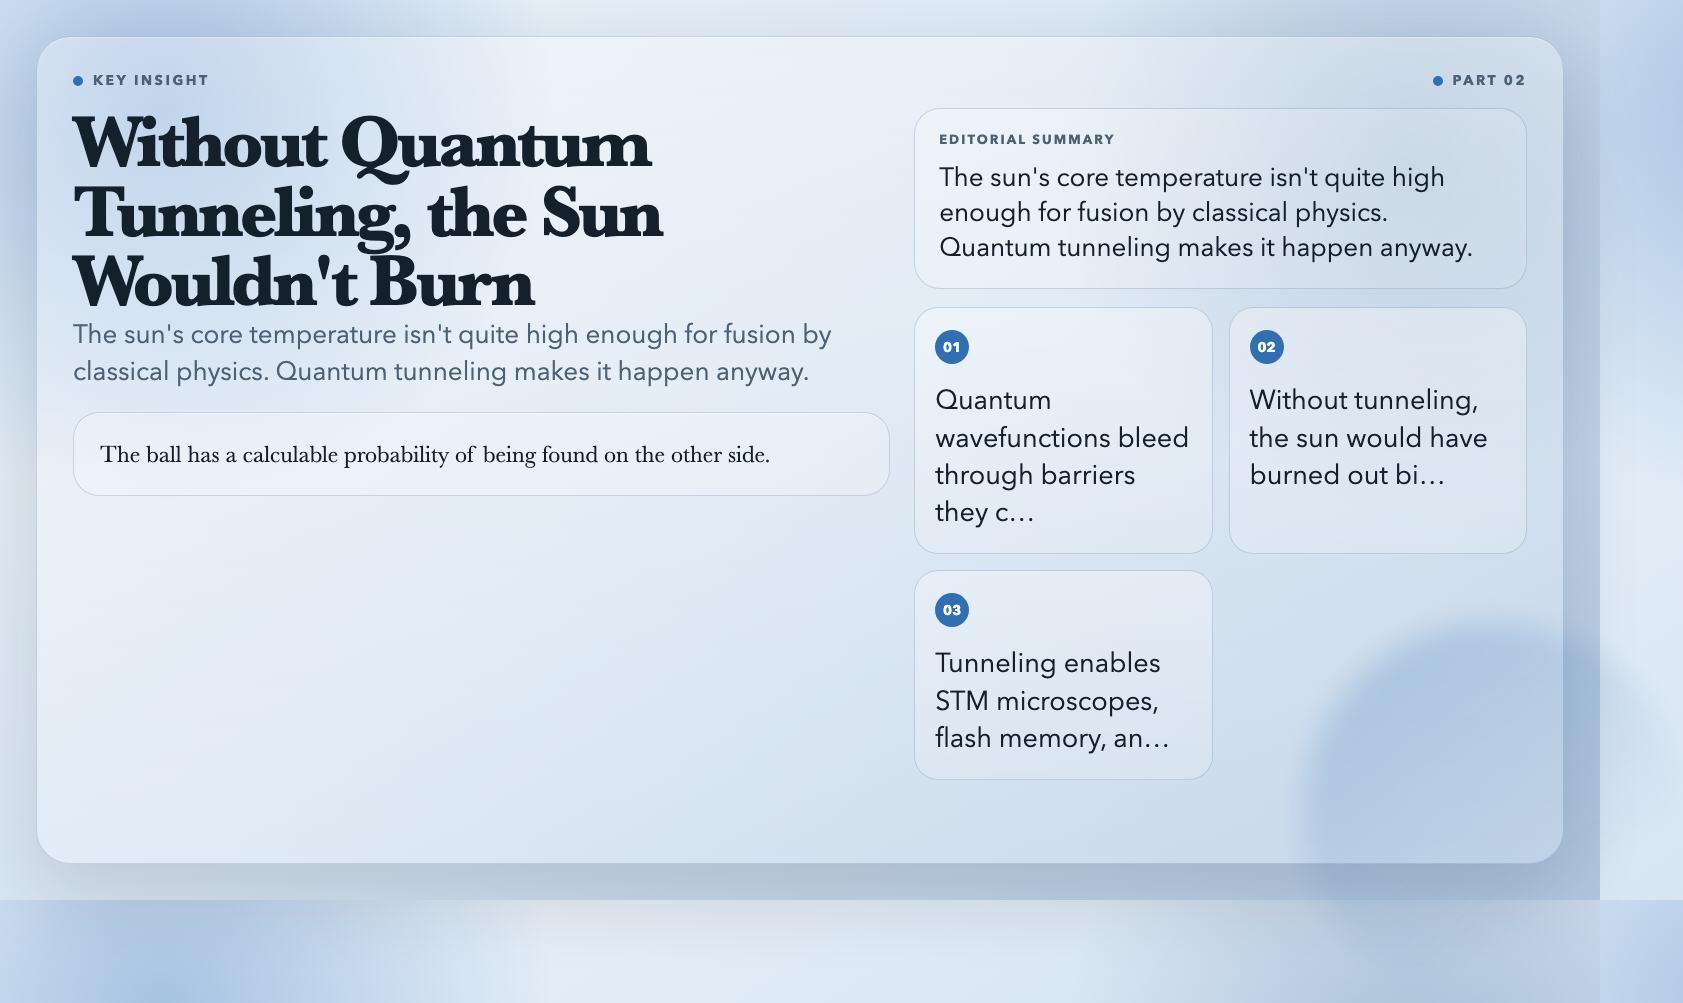
In classical physics, a ball that doesn’t have enough energy to climb a hill rolls back. In quantum mechanics, that same ball has a calculable probability of being found on the other side—not by going over the hill, but because quantum wavefunctions don’t stop at barriers. They bleed through.
This is called quantum tunneling, and it’s responsible for the sun burning. The fusion reactions in the solar core require hydrogen nuclei to overcome their mutual electrostatic repulsion. At the sun’s actual core temperature of about 15 million Kelvin, classical collision energy isn’t quite enough. But quantum tunneling makes fusion happen anyway. Without it, the sun would have exhausted its fuel billions of years ago.
The Quantum Tunneling visualization shows a wave packet approaching a potential barrier. Adjust particle energy, barrier height, and barrier width to see how tunneling probability changes in real time. The visualization shows the full complex wavefunction—real part, imaginary part, and probability density—with a classical-vs-quantum comparison panel. Tunable presets include alpha decay energy scales, STM imaging, and semiconductor junction behavior.
Why it matters: Scanning tunneling microscopes image individual atoms because electrons tunnel through vacuum gaps. Flash memory stores data by controlling electron tunneling through oxide barriers. Transistors in every chip depend on controlled barrier behavior. Proton therapy for cancer exploits differential tunneling probabilities in biological tissues. Tunneling isn’t exotic—it’s foundational to modern technology.
—
4. The Coriolis Force — Why Long-Distance Everything Curves
Stand at the equator and throw a ball directly north. In an inertial frame, it travels in a straight line while the Earth rotates beneath it—so it lands east of where you’d expect from the rotating perspective. That’s the Coriolis effect: not a real force, but the geometric consequence of observing motion from a rotating reference frame.
At human scales, the deflection is negligible—which is why the “water drains clockwise in the Northern Hemisphere” claim is essentially a myth. Bathtubs and toilets are dominated by plumbing geometry, not planetary rotation. But at planetary and atmospheric scales, the Coriolis force dominates everything. Hurricanes spin counterclockwise north of the equator, clockwise south of it. The jet streams flow eastward. Ocean gyres rotate in characteristic patterns determined by Coriolis deflection combined with continental boundaries.
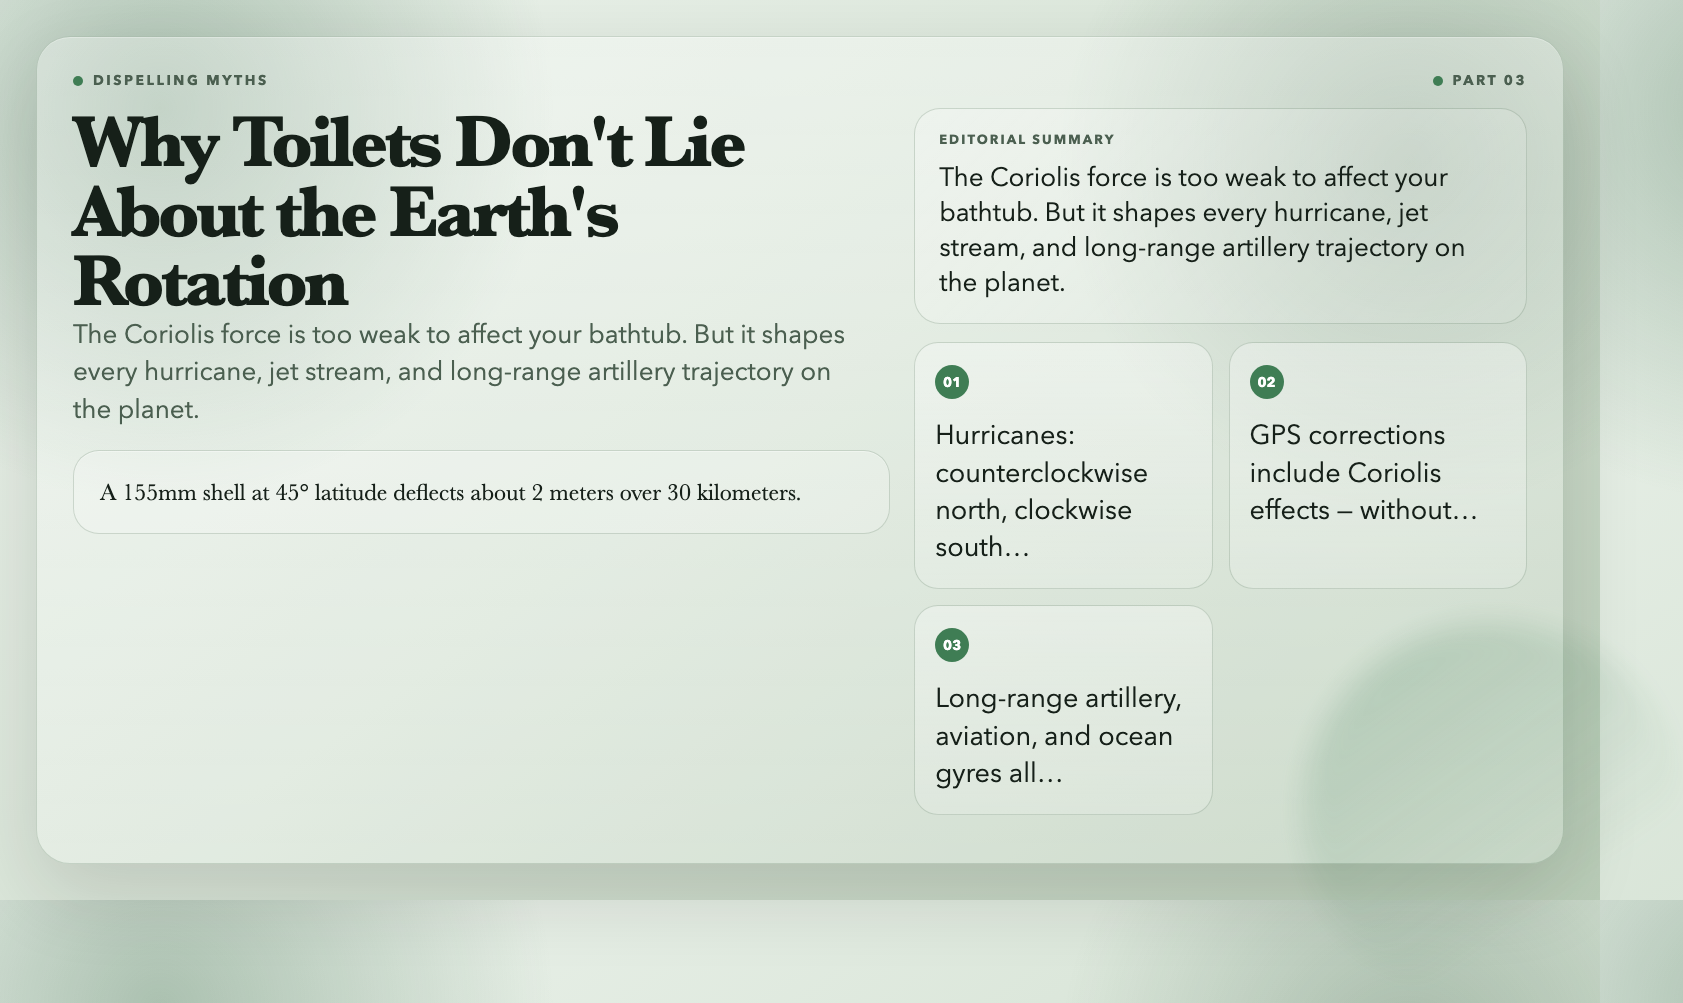
The Coriolis Force visualization shows Earth from above at adjustable latitudes. Launch projectiles and watch their trajectories deflect, observe the Foucault pendulum precession, and watch atmospheric circulation patterns emerge. Presets include mid-latitude artillery (a 155mm shell at 45° latitude deflects about 2 meters over a 30-kilometer range), polar dynamics, equatorial conditions, and cyclone/anticyclone comparison.
Why it matters: GPS satellites orbit at 20,200 km altitude, moving at 3.9 km/s. At that speed and altitude, Coriolis and relativistic effects are already significant in the satellite’s orbital frame. GPS timing corrections include both—and without them, civilian GPS accuracy would degrade by roughly 10 meters per day. Every Uber fare you’ve paid, every Google Maps turn you’ve followed, depends on Coriolis corrections.
—
5. Bernoulli’s Equation — The Reason Planes Fly
The short explanation—”air travels faster over the curved top of a wing, creating lower pressure, generating lift”—is incomplete but not wrong. The full story is richer. Bernoulli’s equation states that for flowing fluid, an increase in velocity comes with a decrease in pressure. The velocity increase over a wing’s curved surface isn’t just a side effect—it’s the mechanism of lift generation, working alongside angle of attack, circulation, and wing geometry.
What’s remarkable is that Daniel Bernoulli published this equation in 1738, and it’s still one of the most practical equations in all of engineering.
The Bernoulli’s Equation visualization shows flow through a Venturi tube at adjustable speeds. Color-coded pressure maps along the pipe walls show exactly where pressure rises and falls as the fluid accelerates through the constriction and decelerates on exit. Presets include airplane wing cross-section, Venturi flow meter, aspirator pump, and garden hose nozzle. The relationship between pipe cross-section and pressure is something you can see directly rather than just derive.
Why it matters: Every perfume atomizer, carburetor, paint sprayer, and asthma inhaler works on the Venturi principle. Industrial flow meters, wind tunnel design, cardiovascular modeling, and hydraulic engineering all start here. The Bernoulli equation is nearly 300 years old and has never been superseded—only extended with viscosity corrections and compressibility effects.
—
6. Lissajous Figures — The Shape of Everything That Oscillates
When a point moves with harmonic motion in both X and Y directions simultaneously, the path it traces depends on the ratio of the two frequencies and their phase difference. Change either parameter slightly and the pattern morphs. Keep them in a simple integer ratio and the figure closes, forming a stable, repeating shape.
These are Lissajous figures—named after Jules Antoine Lissajous, who studied them in 1857. A figure-8 appears when one oscillation runs at exactly twice the frequency of the other. A circle appears at equal frequencies with a 90° phase offset. Higher ratios—2:3, 3:4, 3:5—produce increasingly intricate curves. These patterns appear everywhere: in oscilloscope displays, in the resonance patterns of tuning forks, in orbital mechanics, in the vibrations of mechanical systems.
The Lissajous Figures visualization is an interactive oscilloscope in X-Y mode. Adjust frequency ratio and phase difference with sliders, or use preset patterns. The phase slider is particularly revealing—drag it continuously from 0° to 360° and watch a circle collapse into a line, open into an ellipse, and resolve into a figure-8, all without changing frequency.
Why it matters: Engineers use Lissajous patterns to diagnose signal purity and tune control systems. When the frequency ratio is rational, the figure is closed and stable. When it’s irrational, the figure never repeats. That transition—from periodic to quasi-periodic motion—is where nonlinear dynamics begins, and Lissajous figures make that boundary visible in real time.
—
7. Huygens’ Principle — How Every Point on a Wave Becomes a New Wave
In 1678, Christiaan Huygens proposed: every point on a wavefront acts as a source of new spherical wavelets, and the next wavefront is the envelope that touches all of them. From that single idea follows everything about how waves propagate, reflect, refract, and diffract.
Mirror reflection: each wavelet from the incoming wavefront generates new wavelets on impact; the envelope of those wavelets is the reflected wave at the correct angle. Refraction: when wavelets enter a medium where wave speed changes, the envelope tilts, producing Snell’s law. Diffraction: wavelets through an aperture generate a spherical wave on the far side even though the original wavefront was planar.
The Huygens’ Principle visualization lets you choose between planar and circular wavefronts and watch each point generate secondary wavelets in real time. The envelope construction shows exactly how the new wavefront forms at every instant. Parameters include wave speed, wavelength, and medium properties.
Why it matters: Huygens’ principle explains why sound bends around corners but light’s bending is subtler. It’s why the resolution of optical instruments is fundamentally limited by diffraction, why radio telescopes require large apertures, and why ultrasound imaging has the resolution limits it does. It also underlies modern computational methods for acoustic and seismic wave propagation.
—
The Map Is Not the Territory
On September 14, 2015, LIGO’s detector measured a spacetime strain of 10⁻²¹. That’s one part in ten billion trillion. The visualizations above take phenomena operating at those scales and translate them into something you can see, manipulate, and develop genuine intuition about.
Physics equations are maps. The territory—quantum tunneling probability, gravitational wave chirps, Coriolis deflection angles, Venturi pressure drops—is what these tools let you visit directly.
All seven are free, run in your browser, and require no sign-up. Explore them at ElysiaTools, along with 230+ visualizations covering mechanics, thermodynamics, quantum physics, electromagnetism, and beyond.
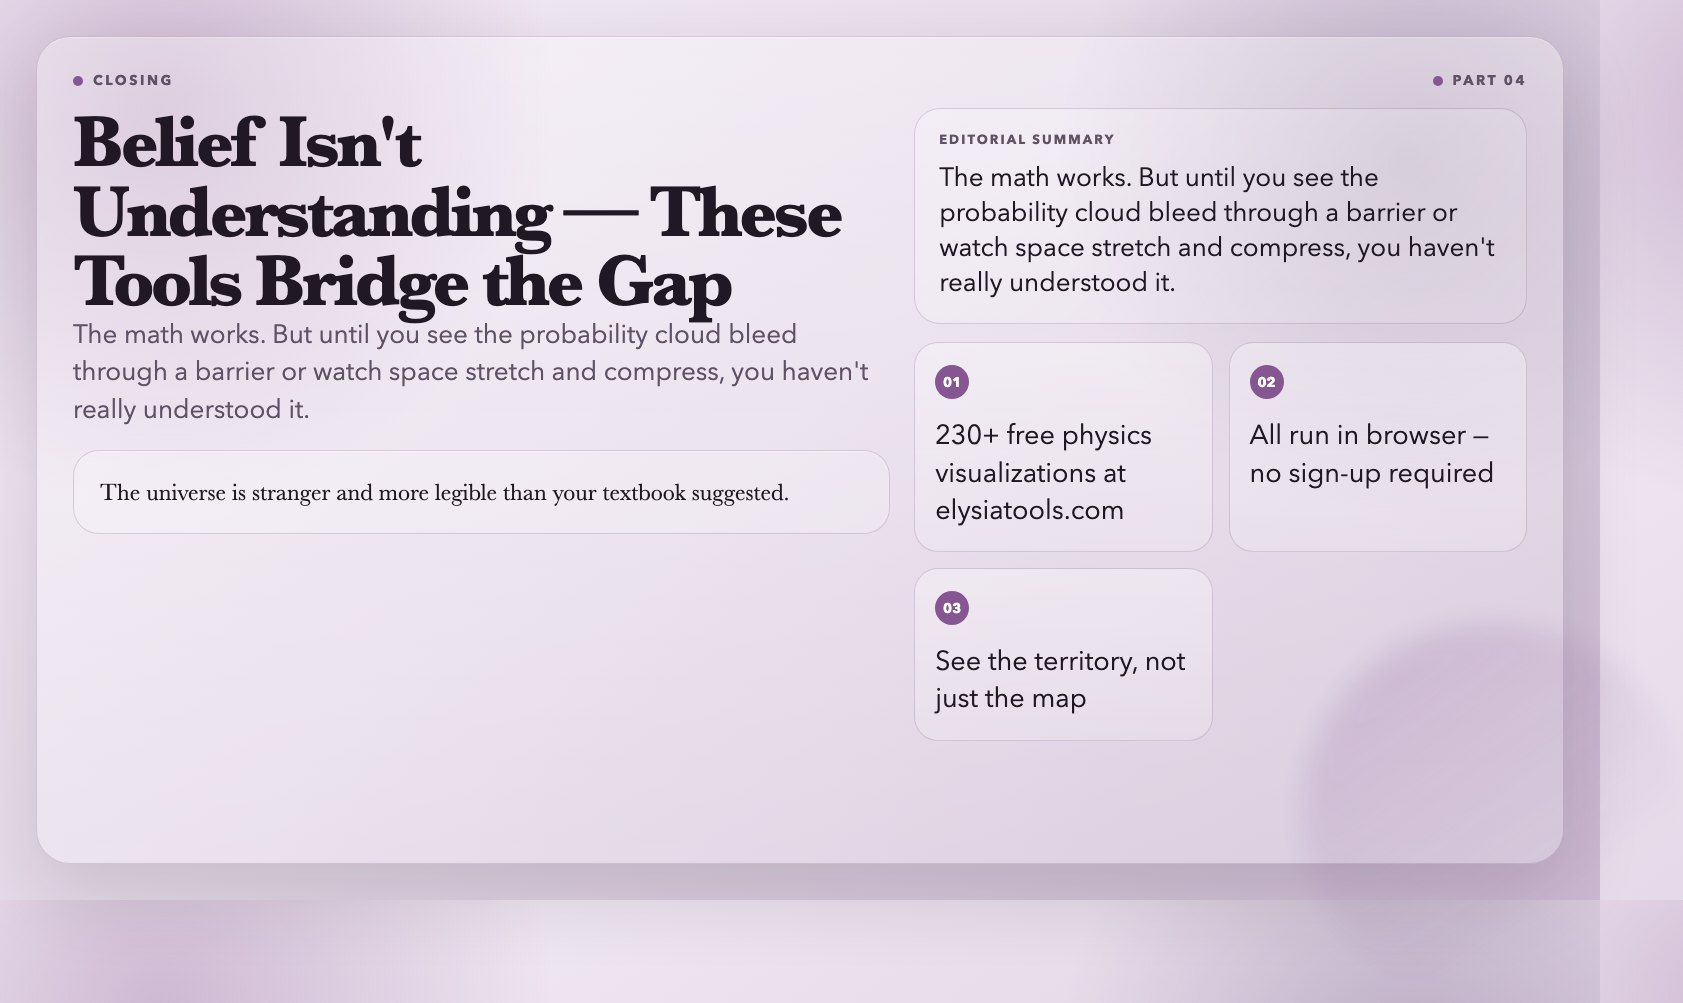
Here’s the thing about spacetime strain measurements: they work. The math predicts what happens. But until you see the binary merger visualization show you exactly how space stretches and compresses—until you slide the quantum tunneling barrier and watch the probability cloud bleed through—you haven’t really *understood* it. You’ve just believed it. These tools are where belief becomes understanding.