Why Some Outbreaks Die Quietly and Others Become Pandemics
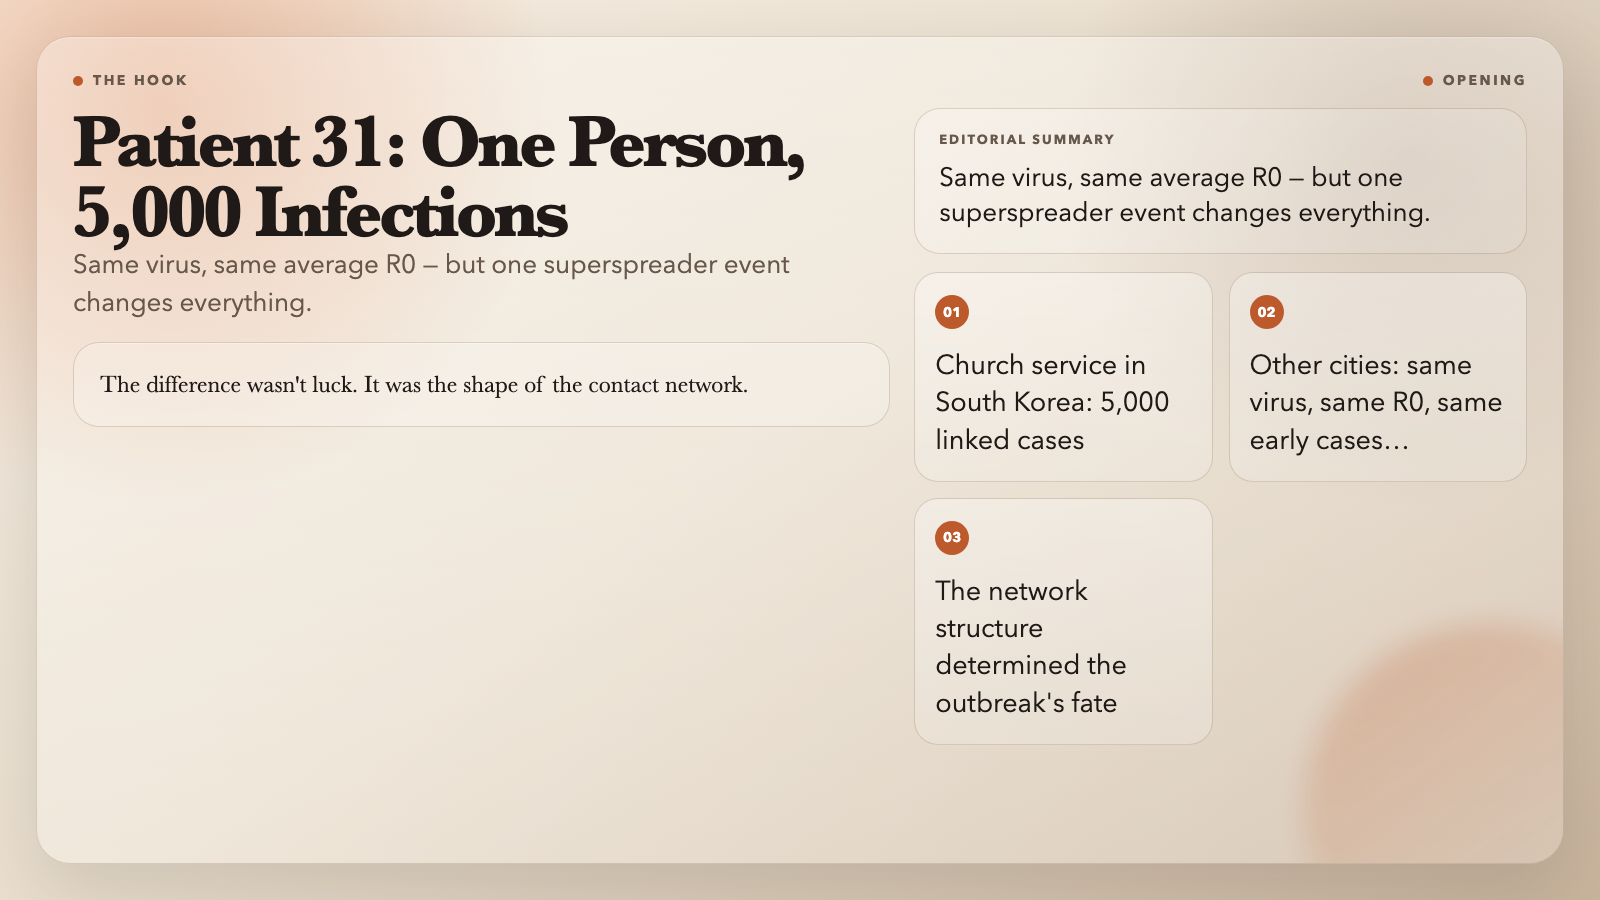
In February 2020, a South Korean woman attended a church service. Within weeks, more than 5,000 COVID-19 cases traced back to that single gathering. A few weeks earlier, in a different city, the same virus infected its first local cases. Those clusters fizzled out without spawning a major outbreak.
Same virus. Same average R0. Completely different outcomes.
The difference wasn’t luck. It was the shape of the contact network.
The SIR Model: Three Letters That Explain a Pandemic
Epidemiologists use a simple framework called the SIR model to track how diseases spread:
- S = Susceptible. People who can catch it.
- I = Infected. People who have it and can pass it on.
- R = Recovered. People who’ve had it and are now immune.
At each time step, infected nodes infect susceptible neighbors with probability β (beta), and infected nodes recover with probability γ (gamma). Three letters, two numbers.
But the classic SIR model assumes everyone is equally connected. Real populations don’t work that way. Your risk of catching a disease depends almost entirely on who you know and who they know. Change the network topology — the pattern of connections — and the same disease behaves like a completely different pathogen.
Three Network Types, Three Different Epidemic Futures
The ElysiaTools SIR Model on Networks lets you explore three fundamentally different network structures. Each one tells a different story about how fast, far, and dangerously a disease spreads.
Random Networks (Erdos-Renyi)
Every pair of people is connected with equal probability. Picture a perfectly uniform society where everyone knows roughly the same number of people, and those connections are scattered randomly.
In a random network, diseases spread predictably but slowly. When R0 drops below 1, it dies out cleanly. There are no “shortcuts” for the pathogen to skip over immune individuals.
Small-World Networks (Watts-Strogatz)
Real social networks aren’t random. Your friends also know each other. Your coworkers overlap. This creates clustering — tight groups where everyone in the group is connected to everyone else.
But you also have a few long-range connections: a cousin abroad, a colleague in another city, someone you met at a conference. These shortcuts change everything. The disease hops across the network in sudden global leaps even though most of your connections are local.
This is the Watts-Strogatz model, and it matches real social networks with eerie accuracy. It explains why diseases smolder in one region for weeks — then appear on multiple continents within days. Those shortcut connections are launch pads.
Scale-Free Networks (Barabasi-Albert)
Most real-world networks — airline routes, social media, sexual contact networks, protein interactions — follow a power-law distribution. A few nodes have thousands of connections. Most have only a handful.
These highly-connected nodes are hubs. In a scale-free network, a hub is a superspreader waiting to happen.
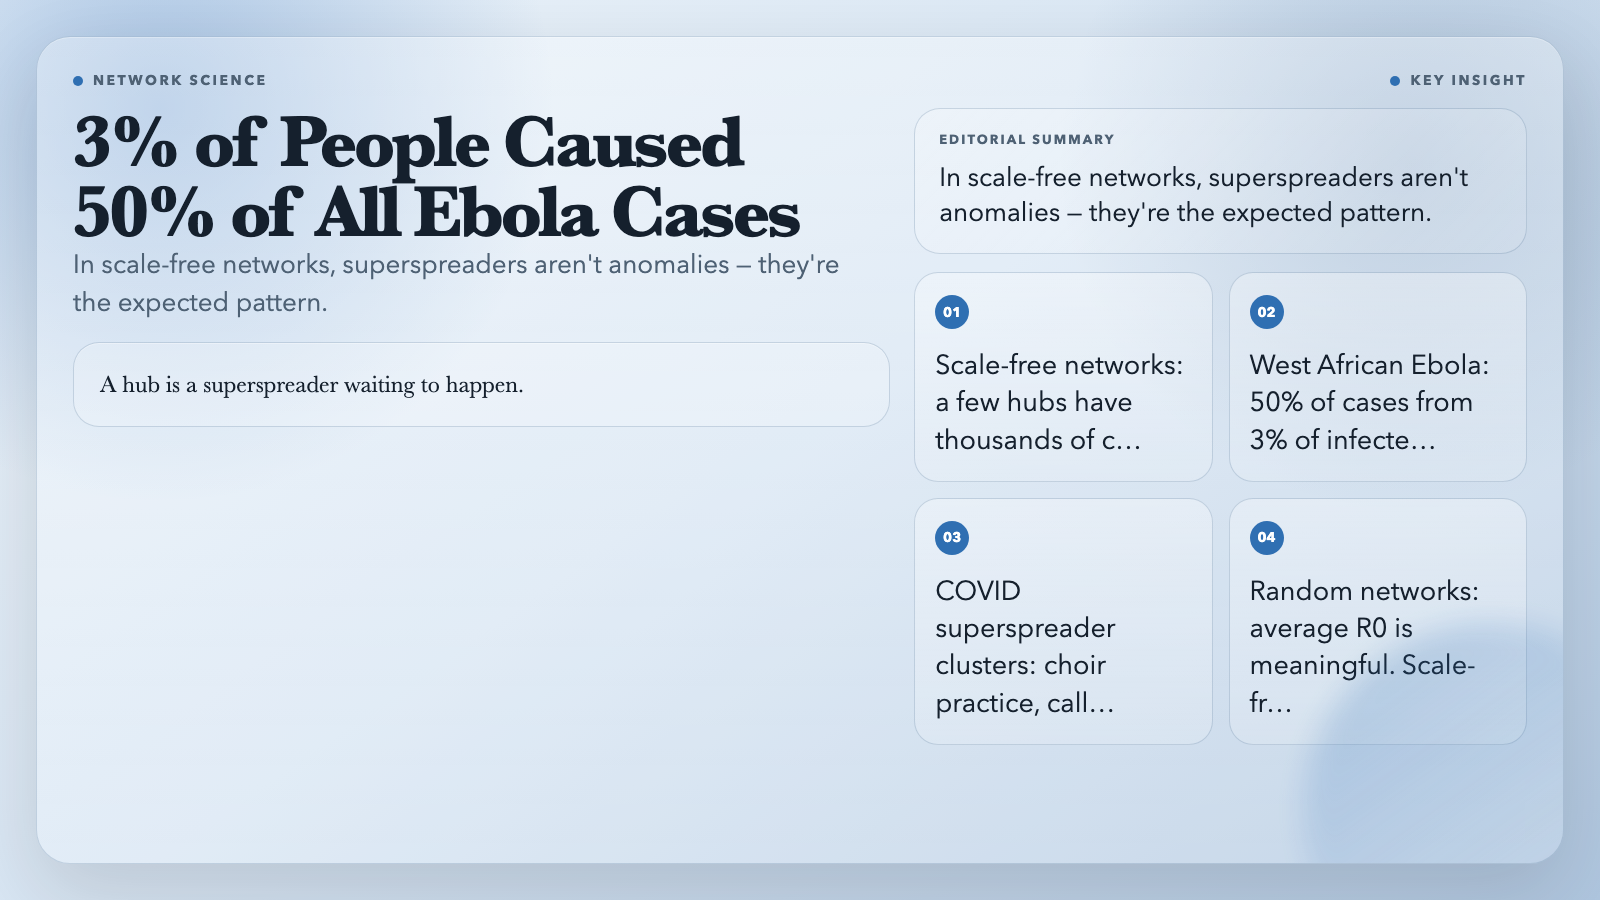
During the West African Ebola outbreak, researchers traced roughly 50% of all cases to just 3% of infected individuals. During COVID-19’s early spread, a choir practice in Washington, an apres-ski gathering in Austria, and a call center in Seoul each spawned dozens of secondary cases. The average R0 looked manageable. The superspreader events told a different story.
The R0 Formula and Why It Can Mislead
The basic reproduction number R0 = β × ⟨k⟩ / γ determines whether an epidemic will spread. (⟨k⟩ is the average number of connections per person.) When R0 > 1, sustained transmission. When R0 < 1, it burns out.
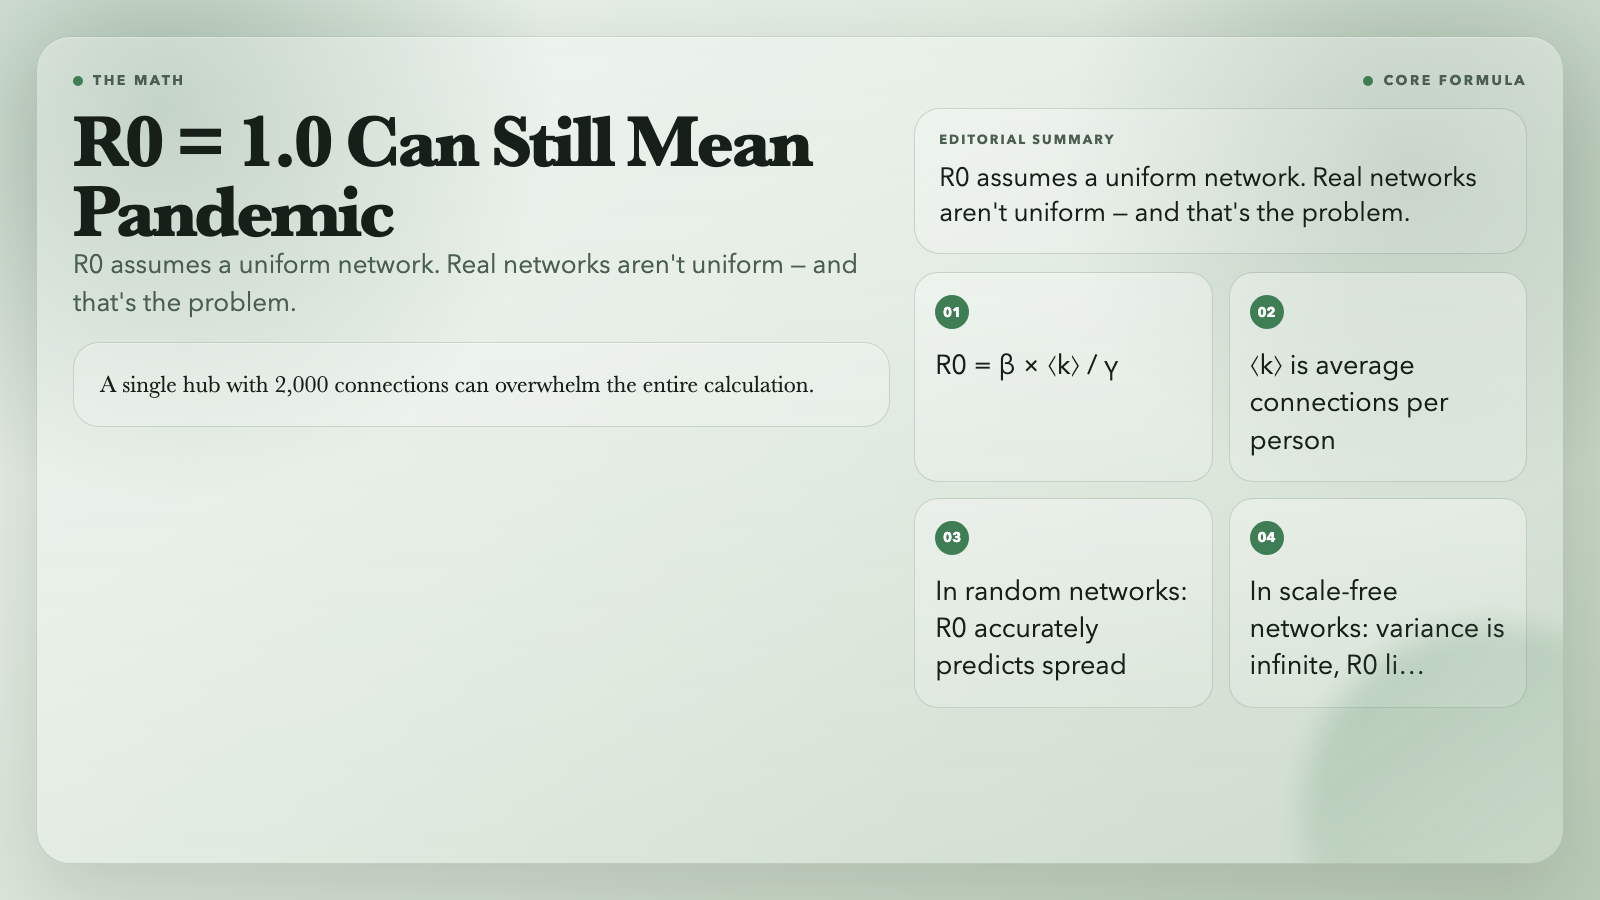
But R0 is an average. In a random network, it works well because everyone has roughly the same number of connections. In a scale-free network, the average can be nearly meaningless for predicting outbreak size — because the variance is infinite, and a single hub with 2,000 connections overwhelms the entire calculation.
What the Visualization Reveals That Papers Don’t
The ElysiaTools SIR model puts these abstract concepts into interactive form:
- Seed the epidemic by clicking any node. Click a low-connection node and watch it spread locally, staying contained. Click a hub and watch it go global in under 10 time steps.
- Change the network type and run the same disease — watch it behave like three different pathogens.
- Tune β and γ to find exactly where the threshold between controlled spread and exponential catastrophe lies.
- Watch SIR curves update in real time — the Susceptible line drops, the Infected line peaks, and the Recovered line rises. The entire epidemic arc unfolds in seconds.
Try the “Superspreader” preset and compare it to “Slow Burn.” Same network. Same parameters. Same disease. Just changing which node gets infected first produces radically different epidemic curves. The gap between controlled spread and global pandemic can be a single click.
Why Targeted Immunization Works
In a scale-free network, vaccinating random people barely dents transmission. Vaccinating the most connected individuals — the hubs — can collapse the entire network’s epidemic potential overnight.
This is targeted immunization, and it explains why aggressive contact tracing matters during an outbreak. You don’t just want to know who is infected. You want to know who they are connected to.
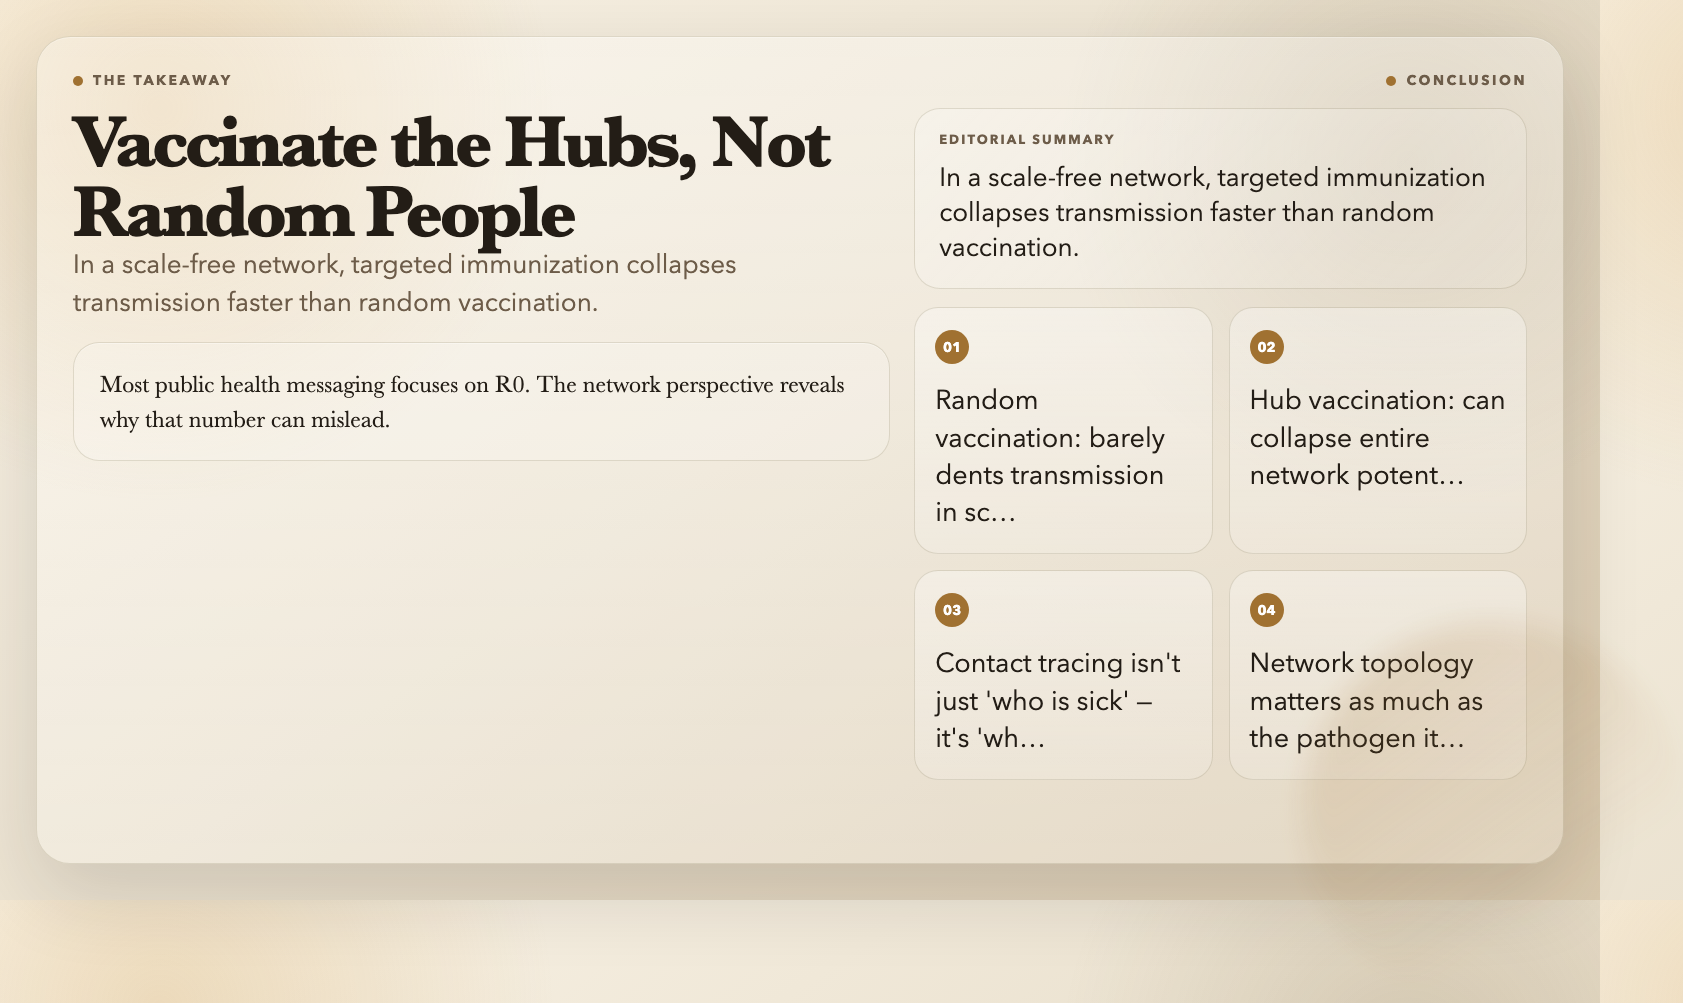
Most public health messaging focuses on R0 as a single number. The network perspective reveals why that number can mislead, and why the shape of the contact network matters as much as the pathogen itself.
Run It Yourself
Explore all of this — no code, no installation:
Epidemic on Network (SIR Model) →
Tweak the sliders. Change the network type. Click a hub and watch what happens.
The model won’t predict the next pandemic. But it will change how you think about why some outbreaks fizzle and others engulf the world — and why the invisible architecture of human connection determines the outcome more than the pathogen itself.