The Equation That Shows How Chaos Has Rules
In 1976, a young French mathematician was studying the motion of stars in clusters when he made a discovery that would change how we understand randomness. Michel Hénon had been working on a problem in galactic dynamics, running calculations on one of the last mechanical computers in a French research institute, when he stumbled onto something unexpected. He wasn’t looking for chaos — he was trying to understand structure.
What he found instead was one of the most elegant demonstrations of deterministic chaos ever discovered: a pair of equations so simple that any undergraduate can iterate them by hand, yet so rich that fifty years of mathematicians have failed to fully resolve them.
The Hénon Map: Two Lines That Change Everything
The Hénon map consists of two equations:
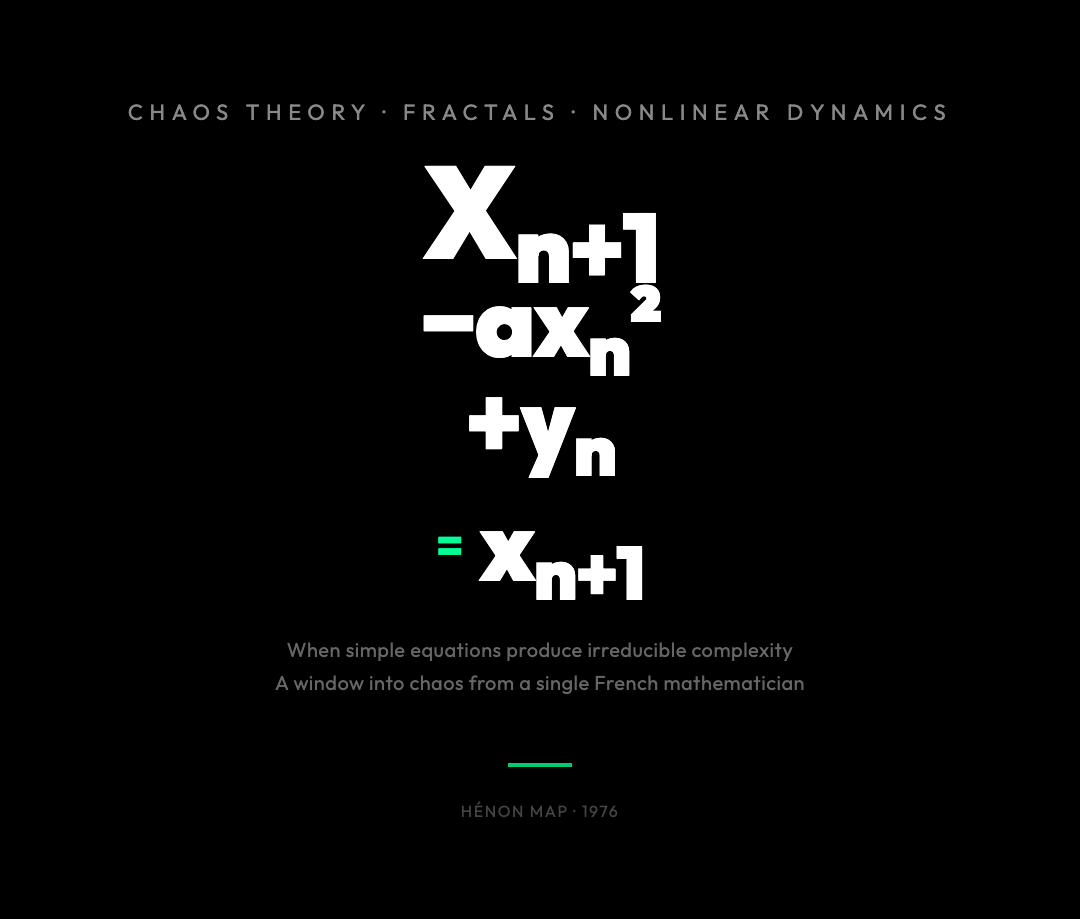
x_{n+1} = 1 - ax_n² + y_n
y_{n+1} = bx_n
Two parameters: *a* controls stretching, *b* controls “squishiness.” The classic values — *a* = 1.4, *b* = 0.3 — produce the most famous strange attractor in nonlinear physics.
Start with a single point, say (0.6, 0.4), and apply the transformation. The x-coordinate gets squared (the nonlinear term) and added to a shifted y-coordinate. The new y-coordinate remembers the old x. Each iteration sends the point somewhere new.
Most systems settle down. Oscillations decay. Trajectories spiral into fixed points or cycles. Not here.
After enough iterations, the point is still moving — it has never stopped, never repeated, never settled. It is tracing out the shape that Hénon first drew by hand: a folded banana with internal holes, a fractal structure that is neither curve nor surface. And here’s the thing — the same initial point always produces the same trajectory. The shape is deterministic. But it never closes. The motion is unpredictable in practice, even though every step is exactly determined by the formula.

This is chaos: deterministic rules producing apparently random behavior.
The Butterfly Effect, Made Mathematical
There’s a famous thought experiment: a butterfly flaps its wings in Brazil, causing a tornado in Texas. The butterfly effect captures the idea that small differences amplify until predictions become meaningless.
The Hénon map lets us measure this precisely.
Start two trajectories separated by one part in ten thousand:
- Trajectory A: x₀ = 0.6, y₀ = 0.4
- Trajectory B: x₀ = 0.6001, y₀ = 0.4
At iteration 5, they differ by 0.001.
At iteration 20, they differ by 0.18.
At iteration 40, they have almost nothing in common.
The divergence isn’t linear — it’s exponential. We measure this with the Lyapunov exponent λ, which captures the average rate of separation per iteration. For the classic Hénon map, the largest Lyapunov exponent is λ₁ ≈ 0.42. Positive means chaos: nearby points double their distance roughly every 2.4 iterations. This isn’t an approximation — it’s a property of the equations.
The Hénon attractor’s fractal structure makes this sensitivity especially visible. Zoom in on any boundary region of the attractor and you find… the same shape. Zoom in again, and again. The structure never resolves into smoothness. The fractal dimension is approximately 1.26 — more than a line, less than a surface. This non-integer dimension is a direct consequence of the stretching-and-folding that the map performs on phase space.
The stretching amplifies perturbations exponentially. The folding keeps trajectories confined to a bounded region. Together they produce endless complexity within finite bounds — the essence of chaos.
The Period-Doubling Road to Chaos
The Hénon map doesn’t produce chaos out of nothing. Change the parameter *a*, and the system reveals a pathway from order to chaos that looks identical across vastly different physical systems.
Start at *a* = 0.9. The attractor is a single fixed point. Iterate long enough, and almost every trajectory lands there.
Increase *a* to 1.2. The fixed point loses stability through a flip bifurcation — the system begins oscillating between two values instead of settling. Period-1 becomes period-2.
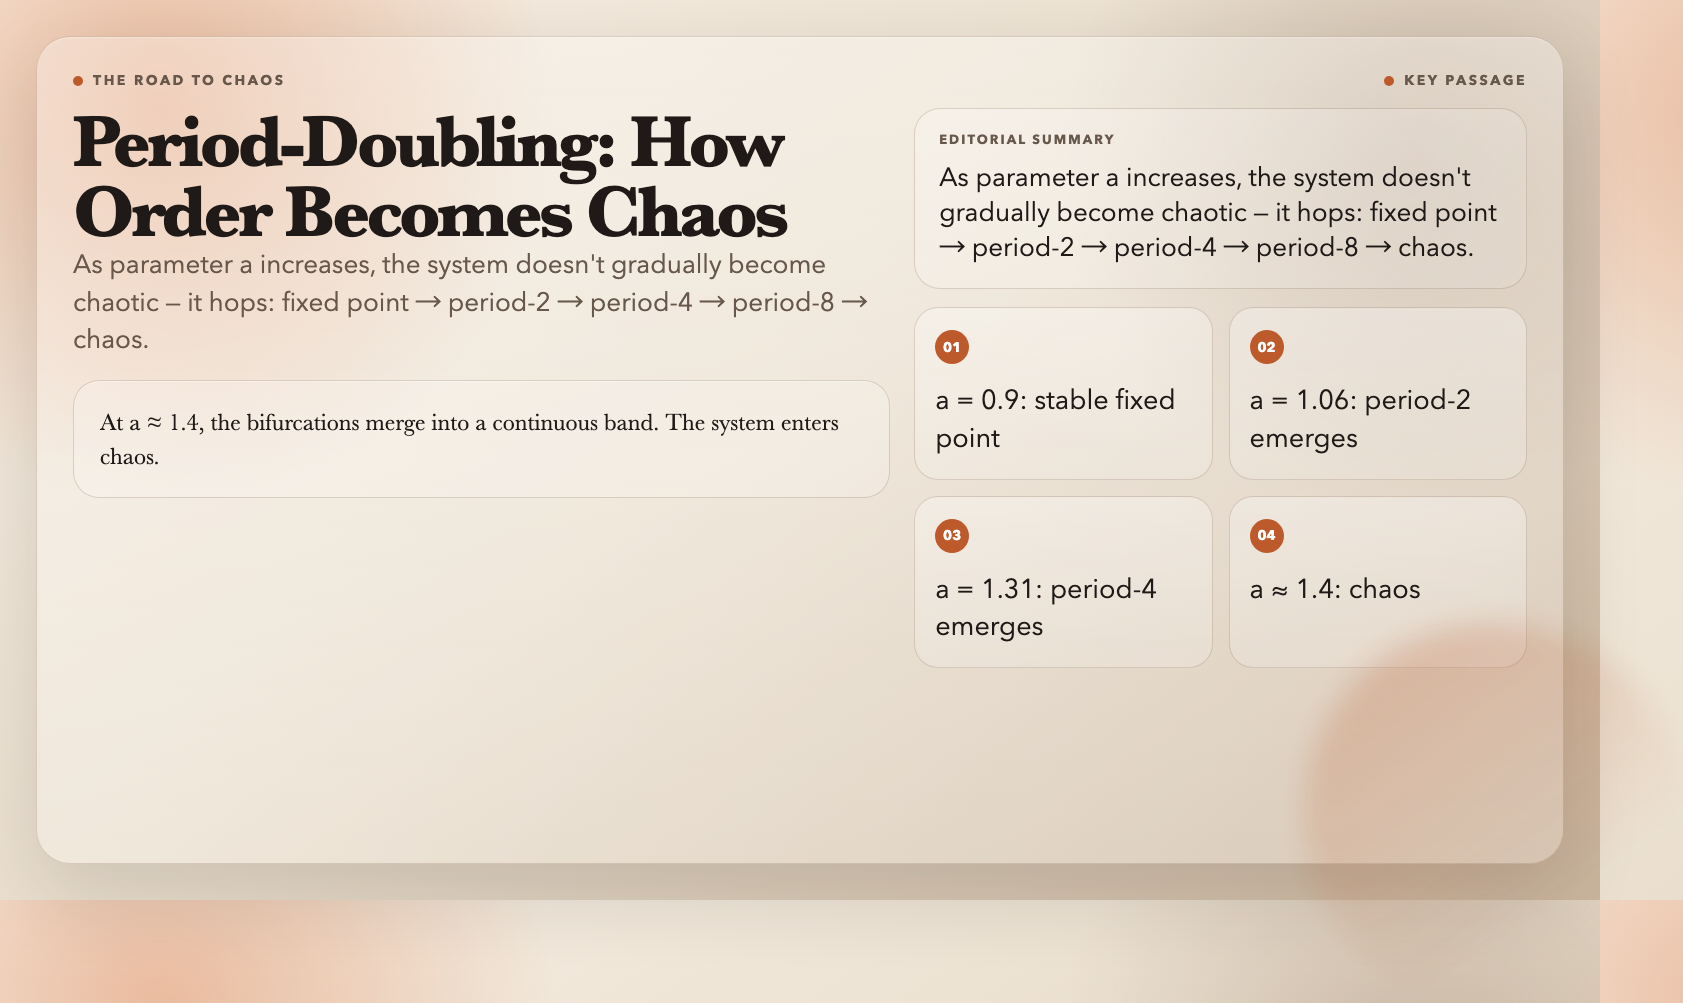
Increase *a* to 1.31. Period-2 becomes period-4. Two iterations become four. Increase again and you get period-8, then period-16. The bifurcations come faster as *a* grows.
At *a* ≈ 1.4, the bifurcations merge into a continuous band of motion. The system enters chaos.
This is the period-doubling route to chaos — one of the most studied phenomena in nonlinear dynamics. It appears in:
- Your kitchen faucet as flow rate increases
- Electronic oscillators as pumping amplitude rises
- Population models as reproduction rate crosses thresholds
- The Hénon map as *a* passes 1.06
And it’s not just qualitatively similar across these systems. It’s quantitatively identical, down to the spacing between bifurcations.
Feigenbaum’s Universal Constant
In 1975, Mitchell Feigenbaum was studying recursion equations on a hand calculator — literally, because his office computer was broken. He noticed something strange: the ratios between successive bifurcation intervals were converging.
Not converging slowly. Converging to a single number, regardless of the equation.
He calculated it: δ ≈ 4.669201609…

This number — now called the Feigenbaum constant — describes how the period-doubling cascade accelerates as you approach chaos. The ratio of the gap between bifurcation *n* and bifurcation *n+1* approaches δ, no matter whether you’re studying the logistic map, the Hénon map, a dripping faucet, or a superconducting Josephson junction.
Feigenbaum initially had trouble publishing his result. Colleagues assumed he’d made a calculator error. He had not. The constant is real — and universal. It appears in every system that follows the period-doubling route to chaos.
There’s a second Feigenbaum constant: α ≈ 2.502907, describing the scaling of the branching widths. Together, these two numbers characterize a phenomenon so general that physicists now consider δ and α to be laws of nature, on par with the speed of light or the gravitational constant.
Understanding chaos isn’t just an academic exercise. The period-doubling cascade appears in cardiac arrhythmias, population dynamics, instabilities in plasma physics, and even the onset of turbulence in fluids. Recognizing the pattern means recognizing the warning signs before chaos arrives.
Why Determinism Doesn’t Mean Predictability
When Hénon first published his map, the response was disbelief. Some reviewers argued the behavior must be random — that the computer had malfunctioned, or that round-off errors were accumulating in some hidden way. The idea that deterministic equations could produce such intricate randomness seemed wrong.
It isn’t. The Hénon map is as deterministic as addition. The same starting point always produces the same trajectory. The equations never introduce noise. Every step is exactly specified.
What changes is our ability to predict. Two points 0.0001 apart — practically indistinguishable by any real measurement — will diverge so rapidly that after a few dozen iterations, their futures have nothing in common. We can’t predict the Hénon map because any uncertainty, however small, eventually becomes large uncertainty.
This is why weather forecasts become unreliable after about ten days. The atmosphere is a high-dimensional Hénon-like system with a positive Lyapunov exponent. The errors don’t stay small. They amplify until predictions dissolve into noise.
Hénon died in 2013, still working on problems in galactic dynamics. His map had become one of the most studied objects in nonlinear mathematics — a touchstone for ideas about chaos, fractals, and the limits of predictability. His original paper, published in *Communications in Mathematical Physics* in 1976, remains one of the most cited papers in the field.
The lesson from Hénon’s story cuts both ways. You don’t need sophisticated equipment to discover profound mathematical truths — he found this on mechanical calculators in a building without climate control. But you do need to look at the output of your equations and ask the right question. Hénon wasn’t trying to prove chaos existed. He was trying to model galaxies.
He noticed the chaos anyway.
And in doing so, he gave us one of the cleanest windows into how simple rules create irreducible complexity — how a two-line recurrence can produce structure that no equation can close, and how the boundary between order and disorder is navigated by following a constant that nature keeps rediscovering in every domain from dripping faucets to galactic arms.
Explore the interactive visualization at Hénon Map to see how parameter changes transform the strange attractor in real time.