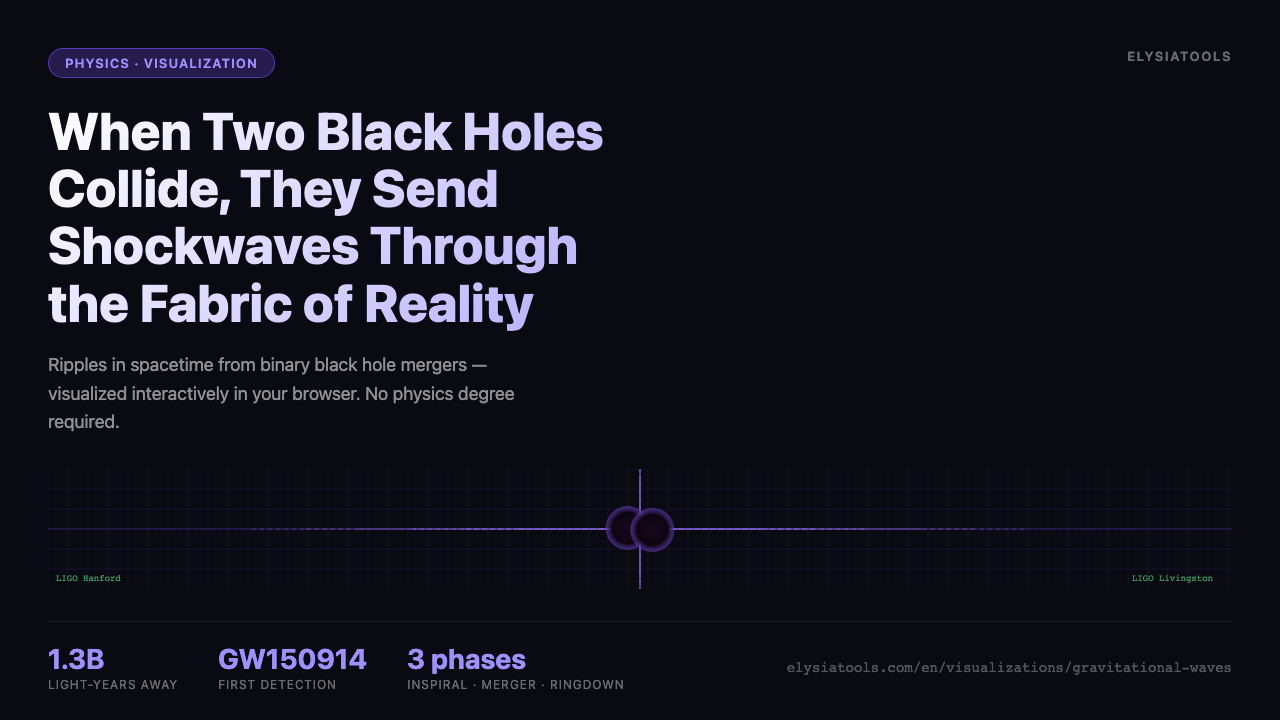
When Two Black Holes Collide, They Send Shockwaves Through the Fabric of Reality Itself
On September 14, 2015, at 4:50 AM Eastern Time, two black holes that had been spiraling toward each other for over a billion years finally merged. The event released more energy in a fraction of a second than all the stars in the observable universe combined — not as light, but as a ripple in the fabric of spacetime itself. Fourteen months later, the Nobel Prize in Physics was awarded for the detection.
That detection was LIGO: the Laser Interferometer Gravitational-Wave Observatory. Its two detectors, in Louisiana and Washington state, each contain a 4-kilometer tunnel arranged in an L-shape. A passing gravitational wave stretches one arm while compressing the other, then swaps — creating a rhythm of expansion and contraction smaller than one ten-thousandth the diameter of a proton.
Einstein predicted this was possible in 1916. He spent decades believing the effect would be too tiny to ever measure.
He was wrong about the measurement — but right about everything else.
What Actually Happens When Black Holes Merge
The merger of two black holes unfolds in three distinct phases, each with a different physical character:
The Inspiral — For millions to billions of years before collision, the two black holes orbit each other, gradually spiraling inward. Each orbit costs the system a tiny bit of energy, radiated away as gravitational waves. The frequency and amplitude of those waves increase steadily, like a siren winding up. By the final orbits before merger, the gravitational waves are oscillating thousands of times per second.
The Merger — When the black holes finally touch, their event horizons merge. This is the most violent, most energetic event in the universe since the Big Bang. In roughly 20 milliseconds, the combined object sheds most of its final mass, converting it directly into gravitational radiation.
The Ringdown — The newly formed black hole is highly distorted, like a bell right after being struck. It “rings down” by radiating away its asymmetries as gravitational waves, settling into a clean Kerr (rotating) black hole geometry within milliseconds.
The signal LIGO detected — GW150914 — came from 1.3 billion light-years away. The energy released outranked the combined output of every star in the visible universe for that instant.
The Spacetime Grid: Why It Helps to See It
Gravitational waves are hard to reason about without visualization. They stretch and compress space itself — not just objects in space, but the space between objects. A ruler placed in the path of a gravitational wave would change length, and so would the markings on the ruler, so you can’t detect the change from inside the affected region.
The only way to detect the wave is to compare the travel time of light across perpendicular arms — which is exactly what LIGO does.
The Gravitational Waves visualization on ElysiaTools lets you interact with this process directly. You can:
- Watch a binary black hole system evolve through all three phases
- See the characteristic “chirp” waveform — frequency and amplitude rising together as the merger approaches
- Toggle between plus-polarization and cross-polarization modes of the wave
- Adjust the masses of both black holes and the distance to the system
- Observe how the LIGO detector responds to each phase of the merger
The visualization is built around the actual physics. The strain formula — h = (2G/c²r) × (d²Q/dt²) — describes how a quadrupole moment change in the mass distribution radiates outward. The chirp mass, which governs the inspiral dynamics, appears explicitly in the parameter controls.
Why This Visualization Is Worth Your Time
You don’t need a physics degree to find this useful. If you’ve ever tried to understand gravitational wave detection and been stymied by the abstractness of “spacetime curvature,” the ElysiaTools visualization gives you something to manipulate and observe. Change the inclination angle and watch the waveform amplitude change. Adjust the mass ratio and see how asymmetric systems produce different merger signatures.
For students: the visualization shows the connection between the math (Einstein’s field equations, the quadrupole formula) and the observable consequence (the LIGO signal). That’s a bridge that textbooks rarely build.
For the simply curious: the real LIGO data from GW150914 and GW170817 (the neutron star merger) is built into the preset parameters. You can run a simulation that mirrors the actual events that changed modern astronomy.
The Signal That Changed Everything
Before LIGO, astronomy was exclusively electromagnetic. Every object we had ever observed — stars, galaxies, nebulae — was detected via light, radio waves, X-rays, or gamma rays. Gravitational waves offered a fundamentally different messenger: not photons, but ripples in geometry itself.
The implications are profound. Black holes, which are invisible to electromagnetic telescopes because no light escapes them, can now be “heard” through their gravitational emissions. The universe, which was previously transparent only to light, became transparent to geometry.
The Nobel citation for the 2017 Physics Prize called LIGO’s detection “a perfect match between precision instrumentation and Einstein’s theory of general relativity.” That combination — theoretical prediction and decades of painstaking engineering — is what made it possible.
What makes the ElysiaTools visualization worth your time isn’t the animations. It’s what the interactions let you ask. What does the waveform look like when the mass ratio is extreme? Why does the ringdown decay so quickly? How does distance reduce the strain amplitude, and what does that tell you about why detection requires enormous collisions billions of light-years away? The simulation gives you a laboratory for questions that textbooks can only describe.
For students: the visualization connects Einstein’s field equations to the actual signal that earned a Nobel. The math and the observable consequence, in the same window.
For the curious: the real LIGO events — GW150914 and GW170817 — are built in as presets. You’re running simulations of the collisions that changed what the word “observable” means.
And now you don’t need a physics department to do it. Just open the Gravitational Waves visualization in your browser and start changing parameters.