Why a Single Drop of Phenolphthalein Turns Water Magenta
The first time you watch phenolphthalein go from clear to vivid pink in a chemistry class, it feels like magic. A single drop, a gentle swirl, and the entire beaker transforms. But there’s no magic here — only one of the most elegant demonstrations of chemical equilibrium you’ll ever see.
Acid-base indicators are among the first tools a chemistry student learns to use. They are also among the most misunderstood. Most people treat them as simple color-changing dyes. The truth is far more interesting: indicators are molecular interpreters, constantly reading the pH of their surroundings and reporting back through color.
What an Indicator Actually Is
An acid-base indicator is a weak acid (or a weak base) that exists in two distinct forms — each with a different color. Chemists label the acidic form HIn and the basic form In⁻.
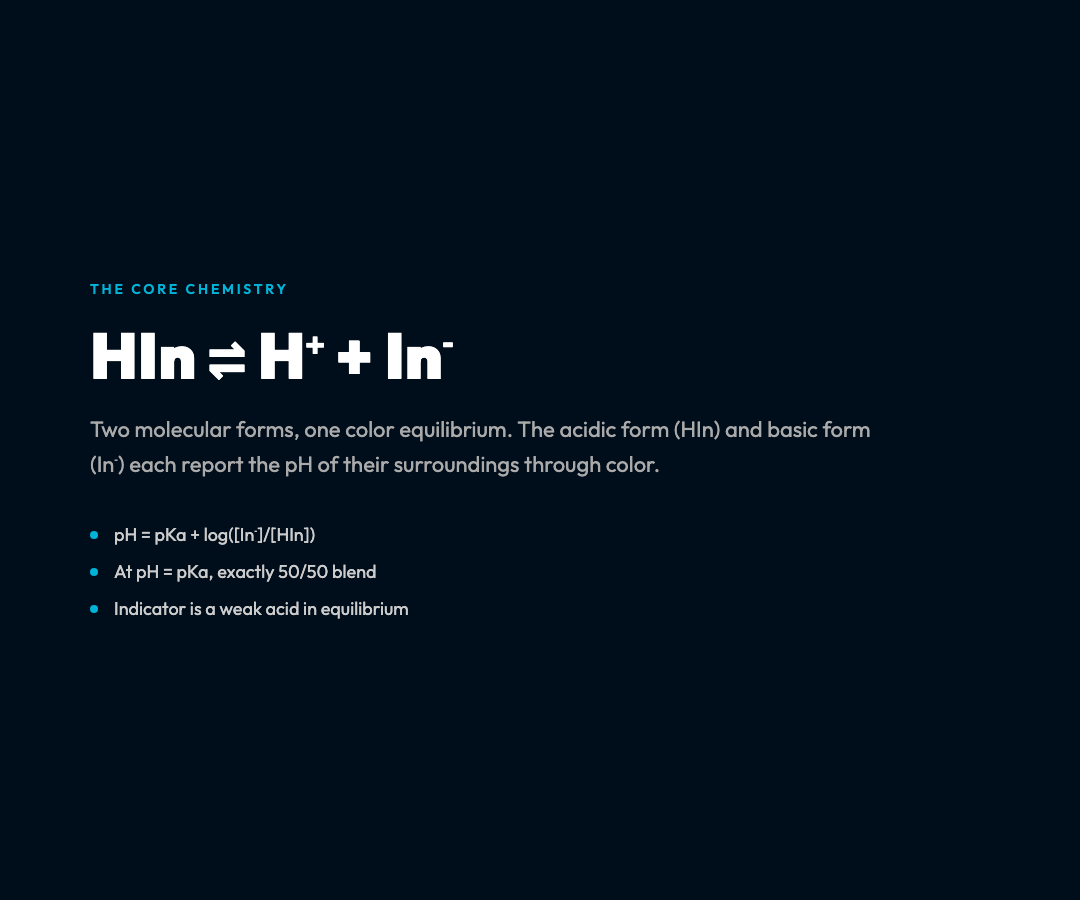
In water, the indicator establishes a quiet equilibrium:
HIn ⇌ H⁺ + In⁻
The acidic form has one color. The basic form has another. What you see in a beaker is the weighted average of both — a blend determined by how many molecules have given up their proton and how many have held on to it.
This is governed by a single equation, taught in every introductory chemistry course:
pH = pKa + log([In⁻] / [HIn])
The pKa is the negative logarithm of the acid dissociation constant. It tells you where the indicator is exactly halfway between its two forms — the midpoint of its color transition.
The Two-Unit Window
Here is a fact that surprises most students: an indicator doesn’t change color at a single pH value. It changes color over roughly two pH units.

Why two? Because the human eye stops reliably detecting one color when it is present at about one-tenth the concentration of the other. Working backward from that ratio through the Henderson-Hasselbalch equation gives you approximately two pH units.
Consider phenolphthalein. Its pKa is 9.7, and its transition range is pH 8.2 to 10.0. Below 8.2, it is completely colorless. Above 10.0, it is fully magenta. Between those values, you see a gradient — pale pink at the low end, deep magenta at the high end.
Methyl orange works the opposite way. Its transition range is pH 3.1 to 4.4 — red in acid, yellow in base. This makes it ideal for titrating strong acids against weak bases, where the endpoint sits below pH 7.
Bromothymol blue covers the neutral zone: pH 6.0 to 7.6. It is the indicator of choice for weak acid-strong base titrations, where the equivalence point lands in that range.
| Indicator | pKa | Transition Range | Acid Color | Base Color |
|---|---|---|---|---|
| Methyl Orange | 3.7 | 3.1 – 4.4 | Red | Yellow |
| Litmus | 6.5 | 5.0 – 8.0 | Red | Blue |
| Bromothymol Blue | 7.1 | 6.0 – 7.6 | Yellow | Blue |
| Phenolphthalein | 9.7 | 8.2 – 10.0 | Colorless | Pink |
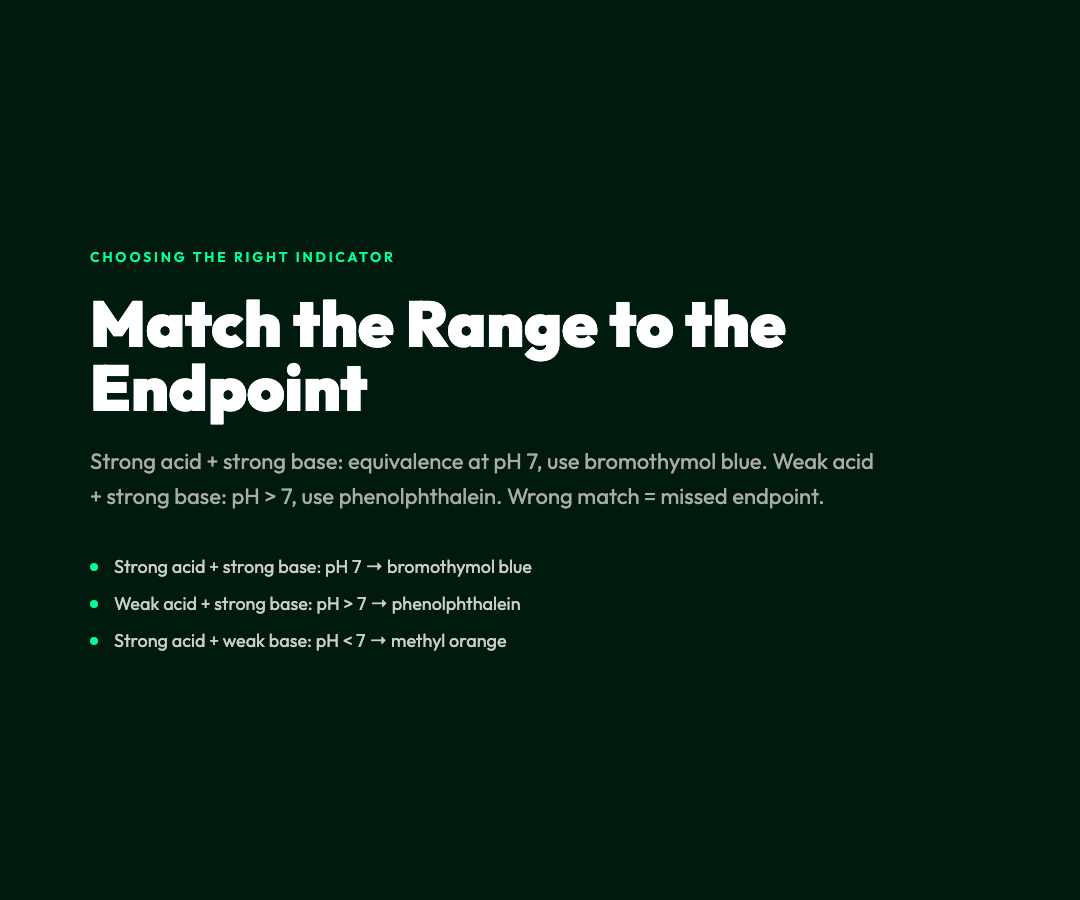
For a strong acid + strong base titration (e.g., HCl + NaOH), the equivalence point sits exactly at pH 7. Any indicator with a transition range near 7 works — bromothymol blue or litmus.
For a weak acid + strong base titration (e.g., acetic acid + NaOH), the equivalence point is basic (pH > 7) because the conjugate base of the weak acid hydrolyzes in water. Phenolphthalein is the correct choice here. Using methyl orange would give you a color change long before the actual equivalence point.
The reverse applies to strong acid + weak base titrations. The equivalence point is acidic (pH < 7), so methyl orange or methyl red is appropriate.
This is not arbitrary convention. It is equilibrium doing its job — the same math that governs every acid-base reaction, whether in a beaker or in your bloodstream.
The Chemistry Hidden in Plain Sight
The Henderson-Hasselbalch equation reveals something remarkable: at the midpoint of the transition range (pH = pKa), exactly half the indicator molecules are in each form. You are looking at a perfect 50/50 blend of two colors simultaneously.
This midpoint is not just a theoretical point. It is a useful one. In acid-base titrations of weak acids or weak bases, the pKa of the indicator is designed to coincide with the buffer region of the acid being titrated. This is what gives a sharp, reproducible endpoint.
Outside the laboratory, acid-base indicators perform quiet, essential work. pH strips use a mixture of indicators — a cocktail that produces a continuous rainbow across the full pH 0–14 range. Blood pH monitors in medical devices rely on the same equilibrium principles. Litmus paper has been detecting acids and bases since the 14th century.
Critical Phenomena: When Small Changes Have Large Effects
Near the endpoints of their ranges, indicators exhibit a property called critical sensitivity — a tiny change in pH produces a large, visible color shift. This is the same mathematical behavior seen at phase transitions in physics: small perturbations near a critical point produce disproportionately large responses.
This is not coincidence. The same language of critical phenomena describes the denaturation of proteins, the onset of convection in fluids, and the color change of an indicator near its endpoint. Indicators have been visualizing critical phenomena in chemistry labs for a century longer than physicists had a name for it.
A Different Way to Think About Indicators
Most students memorize indicator ranges. Fewer understand what they actually represent: a window into the equilibrium between two molecular forms, each reporting on the proton concentration of its environment.
When you see phenolphthalein turn pink in a beaker of sodium hydroxide, you are watching a weak acid give up its protons to the strong base, the equilibrium shifting dramatically in the direction of the deprotonated form — until enough HIn molecules have converted to In⁻ that the pink color finally becomes visible to your eye.
It is, in the end, just physics and math doing exactly what they always do. The magic was never in the indicator. It was in the equilibrium.
Try it yourself: Acid-Base Indicators on ElysiaTools — adjust the pH slider, observe how each indicator transitions across its range, and compare multiple indicators simultaneously during a simulated titration.