The Soviet Theory That Predicted Every Economic Crisis Since 1920
In 1925, a Russian economist named Nikolai Kondratieff looked at a century of price data and noticed something strange: economies don’t just rise and fall randomly. They move in waves. Long ones. Roughly 50 to 60 years from crest to crest.
He was executed for this in 1938. The theory was declared pseudoscience by Soviet authorities. But the waves kept rolling.
Today, the tool that carries his name — the Kondratieff Wave — sits at the center of one of the most provocative forecasts in economics: that the global economy is currently scraping bottom, and that a new wave of prosperity is about to break, driven by AI, new energy, and life sciences.
The Pattern That Won’t Go Away
Kondratieff’s original insight was simple. Look at long-run series of prices, interest rates, and production data across Britain, France, Germany, and the United States from roughly 1790 onward. What you see is not random noise. You see rhythm.
A wave takes about 50 to 60 years to complete one cycle. It starts with a technological revolution — steam power, electricity, the internet. Prosperity builds. Then saturates. Then collapses into depression or war. Then recovers, slowly, until the next technology arrives.
His critics called it mysticism. But the data kept agreeing. The waves kept appearing even in countries he never studied.
The Five Waves, Mapped
The Kondratieff framework identifies five completed waves, each defined by a dominant technology:
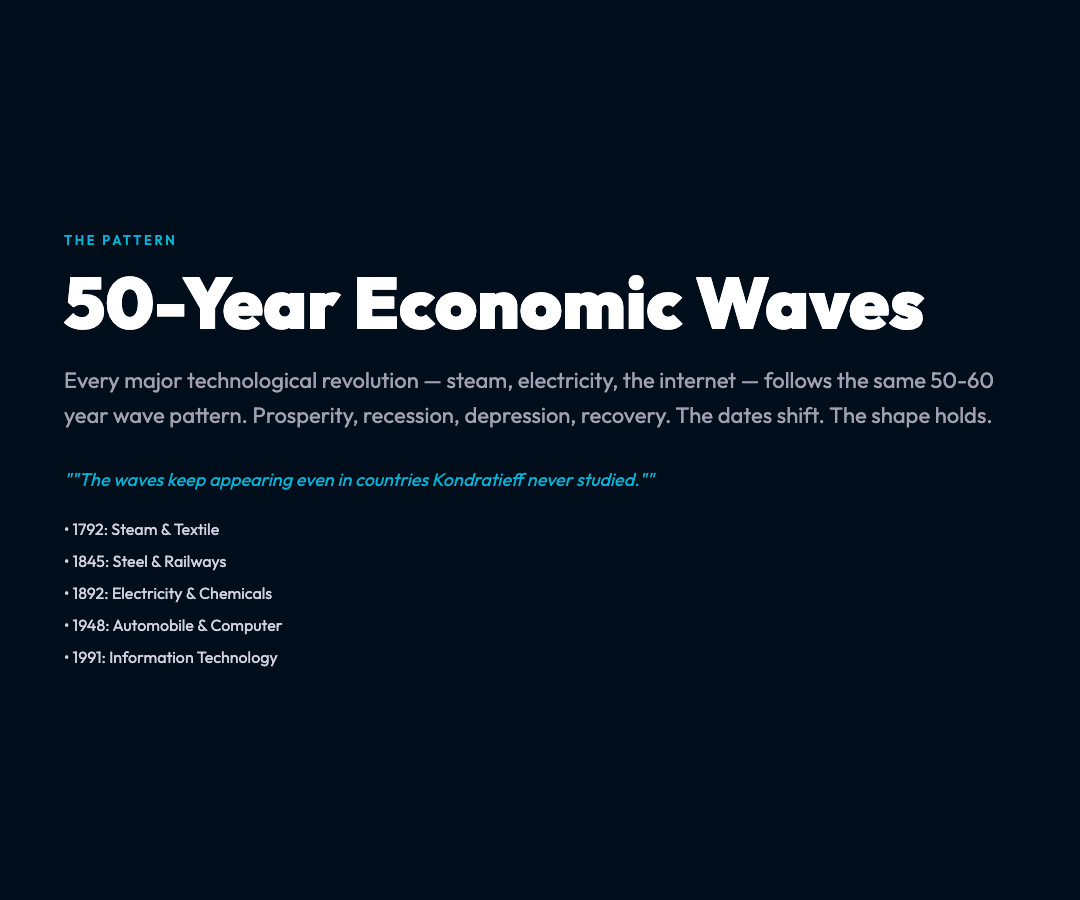
Wave 1 (1782–1845): Textile and Steam The first industrial revolution. Mechanized looms replace hand weavers. Britain becomes the workshop of the world. The wave crests with the Panic of 1825 — the first modern economic crisis — and collapses into a depression that lasts into the 1840s.
Wave 2 (1845–1892): Steel and Railways Bessemer steel makes railroads economically viable. Railway networks span continents. The wave peaks with the Long Depression of 1873–1879, a 6-year crisis that shutters banks and railroads across Europe and America.
Wave 3 (1892–1948): Electricity and Chemicals The second industrial revolution. Electric light transforms factories and cities. The chemical industry produces fertilizers, explosives, and plastics. The wave peaks in the Roaring Twenties, crashes into the Great Depression of 1929, and ends with World War II.
Wave 4 (1948–1991): Automobiles and Computers Mass production drives prosperity. The middle class explodes. The wave peaks in the stagflation of the 1970s, recovers through the 1980s tech boom, and ends with the collapse of the Soviet Union in 1991 — which Kondratieff would have appreciated, given where he first made his name.
Wave 5 (1991–now): Information Technology The internet revolution. Personal computing, mobile networks, e-commerce. The longest bull market in history. The dot-com bust. The 2008 financial crisis. The pandemic shock. And now, in 2026, signs of saturation — slowing productivity growth, plateauing tech valuations, geopolitical fragmentation.
Each wave follows a roughly similar structure: prosperity, recession, depression, recovery. The dates shift, but the shape holds.
The Depression Phase Nobody Talks About
Here is the part that feels most relevant right now.
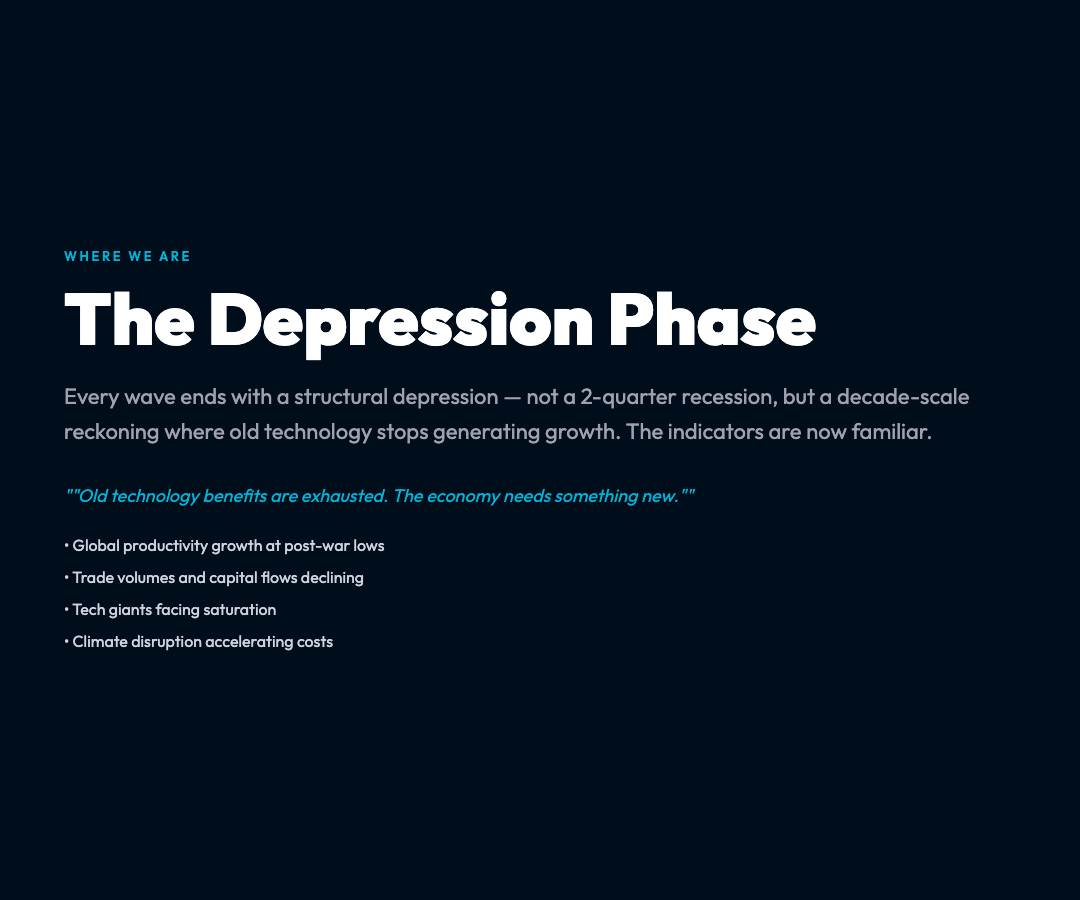
Every Kondratieff wave ends with a depression phase. This is not a recession — a 2-quarter dip in GDP. It is a structural break, a decade-scale reckoning in which old technology stops generating growth and the social systems built around it start fracturing.
The depression phase of Wave 5 began around 2015. The indicators are familiar:
- Global productivity growth slowing to post-war lows
- Declining cross-border capital flows and trade volumes
- Rising wealth concentration despite a growing economy
- Technology giants facing regulatory pressure and saturation in core markets
- Climate disruption accelerating infrastructure costs
Kondratieff called this the phase where “old technology benefits are exhausted.” The innovations of Wave 5 — search engines, social media, smartphones — have diffused into nearly every household on earth. The marginal return on another billion users is near zero. The economy needs something new.
The Mathematical Model Behind the Wave
Kondratieff’s original regression model looked like this:
lnY(t) = α + βt + Σγ(i)D(i) + ε(t)
Where Y(t) is the long-run GDP or commodity price series, t is the time trend, D(i) are dummy variables for structural breakpoints, and γ(i) tests whether each 50-60 year cycle is statistically significant.
Modern implementations use the Hodrick-Prescott filter (with λ=10000) to separate the long-run trend from cyclical noise. This extracts wave components in the 60-120 year frequency band — precisely the range Kondratieff claimed to observe.
The HP filter is not without controversy. Critics argue it can produce spurious cycles. Proponents counter that the cycles appear in raw data before any filtering — the wave is not an artifact of methodology.
The Kondratieff Wave tool on ElysiaTools lets you interact with this model directly. You can slide through time from 1780 to 2028, toggle between GDP and commodity price indicators, and activate comparison mode to see how different series phase-align. The interactive chart makes the abstract formula tangible.
The Sixth Wave: AI + New Energy + Life Sciences
If Wave 5 is ending in depression, what comes next?
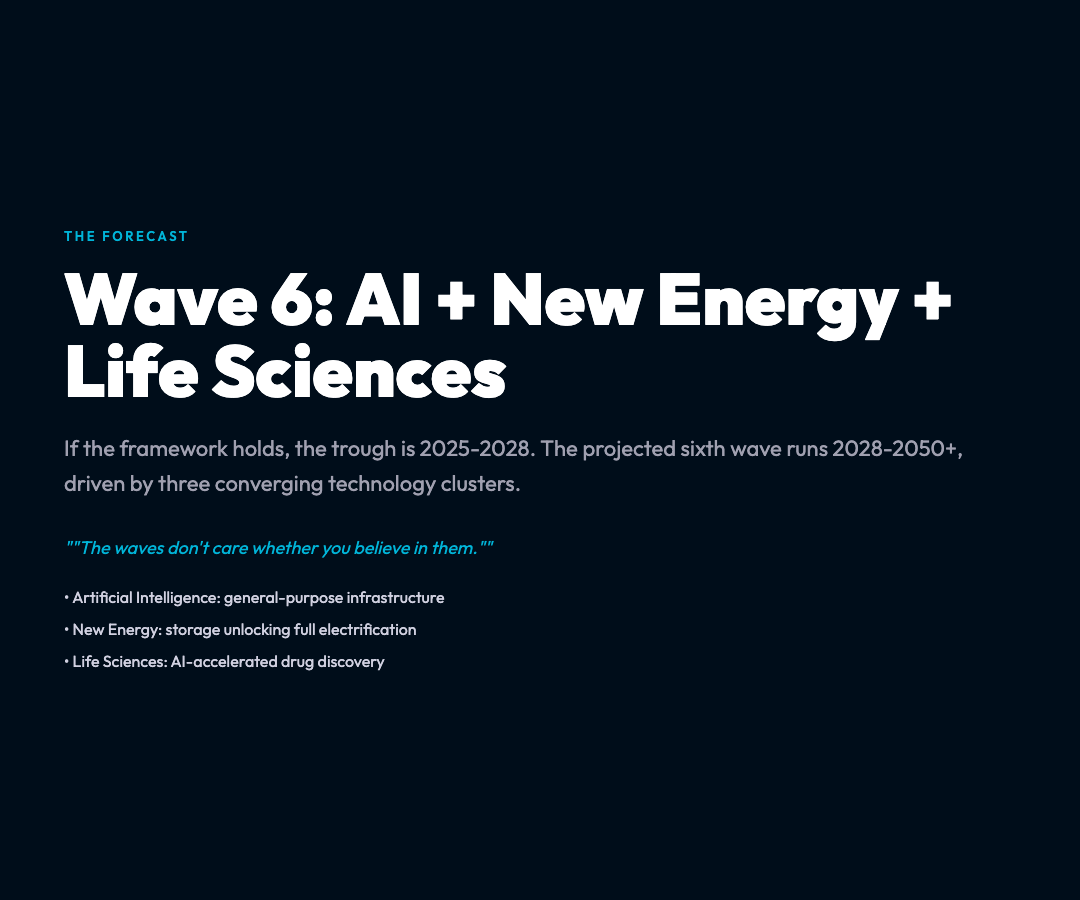
The Kondratieff framework points to a sixth wave. The Kondratieff Wave visualization on ElysiaTools projects it running from approximately 2028 to 2050+, driven by three converging technology clusters:
Artificial Intelligence Not as a single product, but as general-purpose infrastructure — the way electricity was in Wave 3. AI-augmented research accelerates drug discovery, materials science, energy storage, and climate modeling simultaneously. The multiplier effect is potentially enormous.
New Energy Solar and wind have now crossed the cost threshold where they compete with fossil fuels without subsidies in most markets. The next transition is storage — batteries, green hydrogen, grid software — which unlocks electrification of transport, industry, and heating simultaneously.
Life Sciences The convergence of genomics, mRNA vaccine platforms, CRISPR editing tools, and AI-driven protein folding is compressing the timeline from discovery to clinical application. The pandemic proved this pipeline could move at unprecedented speed.
The projected trough — the bottom of the depression phase — is 2025–2028. This is not a confident prediction. Economic forecasting at 50-year frequencies is imprecise by definition. But it is a coherent framework, grounded in historical pattern recognition and supported by structural indicators that economists outside the Kondratieff tradition are also noting.
Why This Framework Persists
The Kondratieff wave has survived decades of academic dismissal. It survives because it is falsifiable in a limited sense — it makes specific predictions about timing and technology that can be checked. And it keeps getting vindicated in broad brushstroke, even as the details resist precise specification.
Modern heterodox economists like Robert Ayres and Chris Freeman extended the framework with technology-ssystem analysis. The Stanford Project on Economic Growth cycles examines similar long-wave data. Even mainstream IMF reports have begun acknowledging “secular stagnation” — a concept uncomfortably close to the depression phase of a Kondratieff wave.
The Soviet authorities who executed Kondratieff for publishing inconvenient data were, in their way, acknowledging the theory’s power. You don’t silence an idea that accurately predicts the collapse of the system you built — unless the prediction itself threatens the system.
The Useful Question
Whether you accept the full Kondratieff framework or not, the question it poses is practical:
What do you do differently if you believe we are at the bottom of a 50-year wave?
If the answer is “nothing” — if you believe the current slowdown is just another recession and recovery will arrive on its own timeline — then the framework is irrelevant. But if you believe the structural features of Wave 5 are exhausted, and that the next wave is building in specific technology clusters, then the Kondratieff lens changes how you allocate capital, choose careers, or evaluate startup ideas.
The Kondratieff Wave tool on ElysiaTools is free to use. You can interact with the data, adjust the time range, and form your own judgment about whether the wave is real, whether the trough is near, and whether the sixth wave will look anything like the projection.
The waves don’t care whether you believe in them.