
Why Your Coffee Cools Slower at the End: The Physics of Cooling Curves
There is a moment every morning when a hot drink sits untouched long enough that you can almost predict when it will become undrinkable. The drop from 90°C to 60°C feels slow. But from 60°C to 30°C — the same 30-degree span — seems to happen faster. Your intuition is not wrong.
The reason lies in Newton’s Law of Cooling, and it applies to far more than just your morning coffee. Metalworkers use it to control crystallization in alloys. Engineers use it to design thermal management systems. And materials scientists use it to read the thermal history locked inside a sample — just by looking at its cooling curve.
What a Cooling Curve Actually Shows
A cooling curve is a plot of temperature versus time as a material loses heat to its surroundings. For a pure substance, the curve has a characteristic shape that reveals the entire thermal story of the sample.
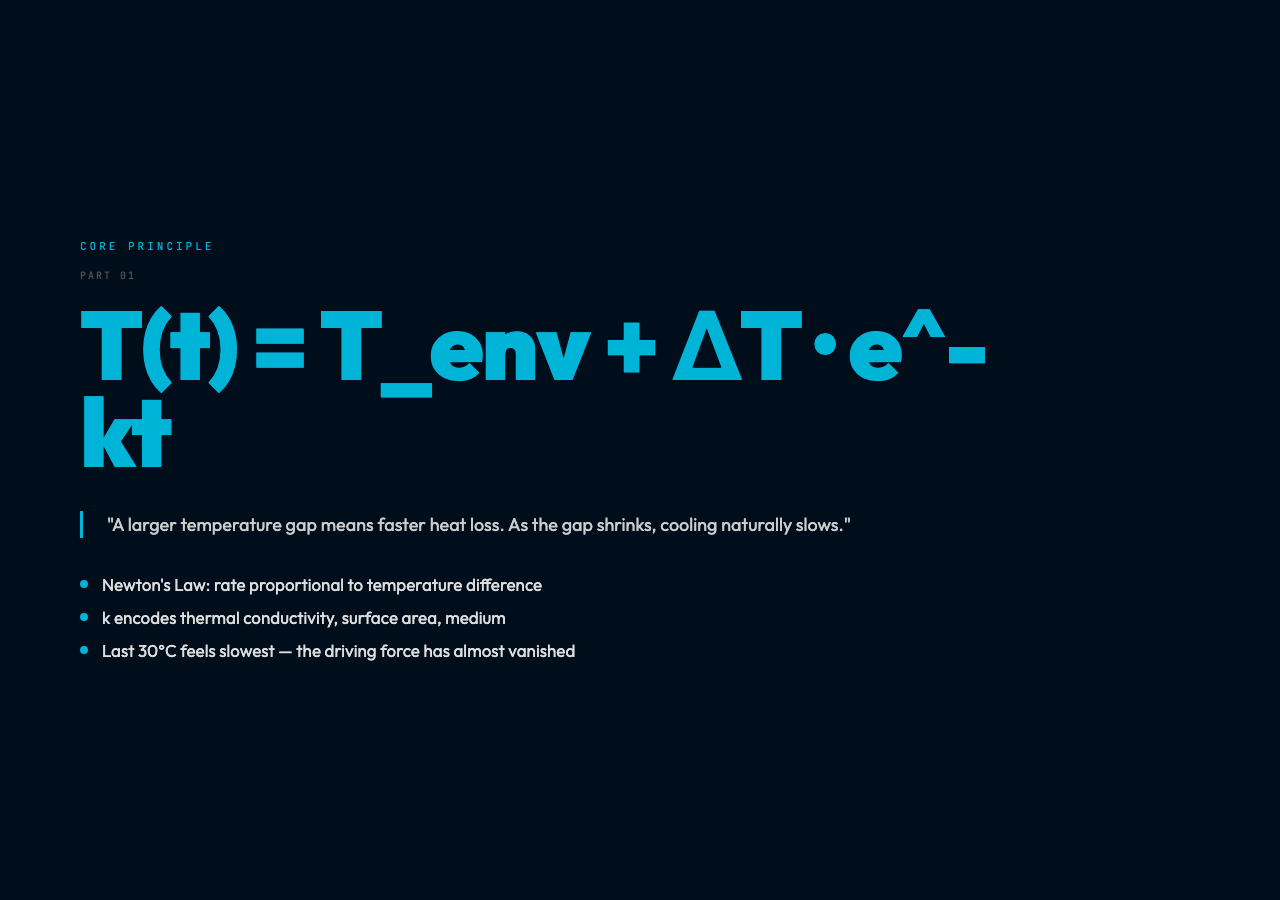
Start with a liquid above its melting point. As it cools, temperature drops steadily — this is sensible cooling, where the thermometer reading falls proportionally with each passing minute. The rate of cooling is proportional to the temperature difference with the environment, as Newton first formalized:
T(t) = T_env + (T_initial – T_env) · e^(-kt)
Where k is the cooling constant, determined by the material’s thermal properties, surface area, and the medium it is in. A larger temperature gap means faster heat loss. As the gap shrinks, cooling naturally slows down.
This is why the last 30 degrees feel slow. By the time your coffee reaches room temperature, the driving force for heat transfer has almost vanished.
The Phase Transition Plateau: Where Time Seems to Stop
The most striking feature of a pure substance’s cooling curve is the plateau. At the melting point temperature, the curve flatlines — temperature stops dropping even though the sample is still releasing heat.
This happens because the heat being lost is not going into changing the temperature. It is being consumed by a phase transition — liquid turning to solid, with the release of latent heat. The crystallization of a pure metal or the solidification of molten glass requires a fixed amount of energy per gram to be removed. Until that energy is fully extracted, the temperature holds steady.
The plateau is not a flaw in the measurement. It is a precise fingerprint of the phase transition. The length of the plateau tells you how much material underwent the transition. The temperature of the plateau tells you what the material is.
This is why cooling curves are used in materials characterization. Drop a sample of unknown alloy, record its cooling curve, and read off the plateau temperatures. Each flat spot corresponds to a phase change, and the combination of plateaus identifies the alloy with remarkable precision.
Supercooling: The Phase Transition That Cheats
For a pure substance, the crystallization plateau should occur exactly at the melting point. In practice, it often occurs below it.

This is called supercooling — a liquid that remains in the liquid phase well below its nominal freezing temperature, as long as it is undisturbed and very clean. Water can be supercooled to -40°C in the right conditions. Metal alloys routinely supercool by 10 to 20 degrees.
When supercooled liquid finally does crystallize, the temperature jumps back up to the crystallization point — a visible spike on the otherwise smooth cooling curve. The released latent heat briefly reverses the temperature drop. The simulation lets you adjust the supercooling degree and watch this rebound happen in real time.
Supercooling matters in industrial casting. If the molten metal in a mold supercools before nucleation begins, it may crystallize in an uncontrolled manner — producing a coarse, uneven grain structure instead of the fine, uniform structure that gives castings their strength. Understanding supercooling behavior allows engineers to design cooling rates that produce the desired microstructure.
Mixtures and Alloys: Multiple Plateaus, Multiple Phases
Pure substances produce a single plateau. Mixtures produce two, three, or more — each corresponding to a different phase transition happening at a different temperature.
In a binary alloy, the first plateau might correspond to the crystallization of one component. As that phase solidifies, the remaining liquid becomes enriched in the other component, changing its composition and its freezing temperature. A second plateau appears at a lower temperature when the remaining liquid finally solidifies.
The result is a cooling curve that tells a complete phase composition story. Materials scientists read these curves to determine eutectic compositions, to identify intermetallic compounds, and to map phase diagrams. Each kink and flat spot on a measured cooling curve maps to a specific physical event inside the sample.
The Cooling Constant: A指纹 of the System
Newton’s Law of Cooling describes the exponential decay of the temperature gap. But the constant k is not fundamental — it is a lumped parameter that encodes the combined effects of thermal conductivity, convection, surface area, and heat capacity.
A small object in still air cools slowly, with a small k. The same object in flowing water cools rapidly, with a large k. Changing the surrounding medium changes k, and the cooling curve changes with it.
This is why the coffee mug matters. A ceramic mug and a thin metal cup with the same coffee inside will have noticeably different cooling curves — even if they start at the same temperature. The mug’s material determines how quickly heat can leave the system.
In the interactive simulation, you can adjust the cooling constant directly. Watch how a larger k compresses the entire curve horizontally — the material cools to equilibrium faster, but the plateau shape and temperature remain the same. The plateau is a property of the material; the cooling rate is a property of the environment.
Reading the Curve: What It Tells You
The shape of a cooling curve encodes a remarkable amount of information:
– The initial slope tells you the cooling rate at high temperature — dominated by convection and the temperature gap – Each plateau identifies a phase transition and its characteristic temperature – The length of each plateau is proportional to the fraction of material undergoing that transition – Post-plateau slopes may differ from pre-plateau slopes because the thermal properties of the solid differ from those of the liquid – Supercooling appears as a dip below the expected plateau before a temperature rebound
From a single smooth line on a graph, you can reconstruct which phases are present, in what proportions, and how the material was cooled. That is why the cooling curve remains a foundational tool in experimental physics and materials engineering — simple to measure, rich in information.