Why a Dam Holds Back Enough Energy to Power a City: The Physics of Hydropower Generation
A reservoir sitting 100 meters above a power plant holds roughly 980 kilowatts of potential energy for every cubic meter of water it contains. That is not a metaphor. That is arithmetic. Stack enough cubic meters together — a river’s worth, accumulating behind a dam wall — and the number becomes large enough to illuminate millions of homes. The physics is straightforward. The engineering is what makes it feel like magic.
The Core Idea: Three Stages of Transformation
Every hydropower plant runs the same energy pipeline in three distinct stages, and understanding each one unlocks a surprising clarity about why dams are so effective.
Stage 1 — Potential Energy to Kinetic Energy Water stored in a reservoir high above the turbine has gravitational potential energy. The formula is familiar from high school physics:
PE = m × g × h
Where m is the water mass in kilograms, g ≈ 9.81 m/s² is gravitational acceleration, and h is the vertical height difference (the “head”) between the reservoir surface and the turbine. When the intake gate opens and water is allowed to fall through the penstock, this potential energy converts to kinetic energy. The water accelerates — not because of pressure, but because of gravity working over that height difference.
Stage 2 — Kinetic Energy to Mechanical Energy The falling water hits turbine blades and transfers momentum. A Francis turbine, the most common design, is essentially a spinning wheel with curved blades that catch water and force it to change direction. Every direction change is a momentum transfer — the water pushes on the blades, and the turbine spins. Mechanical energy leaves the turbine shaft and enters the generator.
Stage 3 — Mechanical Energy to Electrical Energy The generator is a magnetic opposites game. A rotor spinning inside a stator induces an electromotive force in the stator windings. Mechanical rotation becomes electrical current. No fuel is burned. No combustion happens. The energy came from water that fell because gravity exists.
The Power Formula: P = ρ × g × h × Q
For those who prefer equations that actually compute something useful:

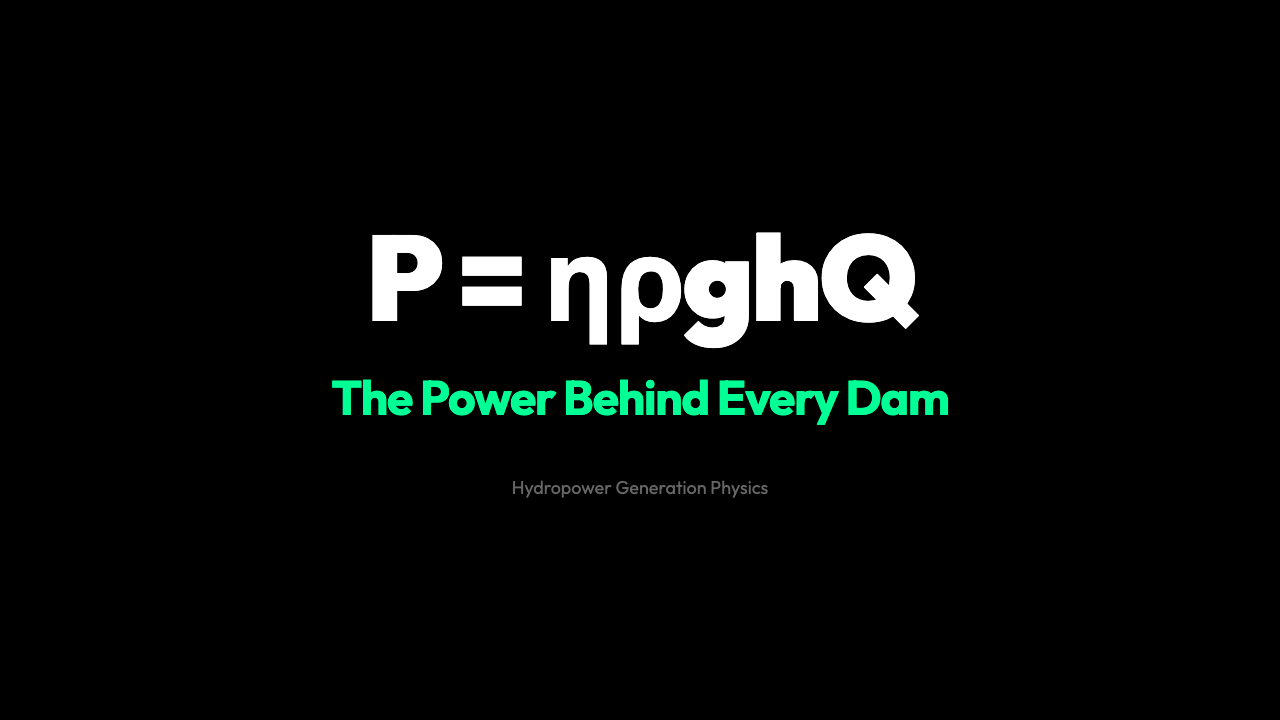
P = η × ρ × g × h × Q
Breaking this down: – η (eta): turbine + generator efficiency, typically 85–95% – ρ (rho): water density = 1,000 kg/m³ – g: 9.81 m/s² – h: net head in meters (vertical distance the water actually falls) – Q: flow rate in m³/s
Plugging in a concrete example — a dam with 100 m head, 500 m³/s flow rate, and 90% efficiency:
P = 0.90 × 1000 × 9.81 × 100 × 500
P ≈ 441 MW
That is enough to power a city of roughly 300,000 homes. The arithmetic is clean. The water does not care about your politics or your grid infrastructure. It simply falls.
What the Interactive Visualization Reveals
The hydropower visualization at elysia-tools lets you manipulate the three control knobs independently:

– Water Head (h): Adjusting this slider from 30 m to 200 m shows how power scales linearly with height. Double the head, double the power output, all else being equal. This is why dam engineers look for locations with maximum elevation change.
– Flow Rate (Q): Changing this slider from 100 m³/s to 1,000 m³/s shows power scaling linearly with flow. More water per second means more energy per second.
– Efficiency (η): The efficiency slider reveals why real plants never reach 100%. Friction in the turbine, heat losses in the generator, and turbulence in the penstock all bleed energy. Modern Francis turbines hit 90–95%; older designs may only manage 80%.
The real-time display shows how these three variables interact. Touch one slider, and the power output curve shifts. The energy transformation diagram animates the chain from potential → kinetic → mechanical → electrical in real time.
Why Hydropower Dominates Renewable Generation
Wind turbines capture energy from moving air. Solar panels capture energy from photons. Hydropower captures energy from water that is already falling. The difference is not trivial — it is structural.

Water is dense. Enormously dense. One cubic meter of water weighs 1,000 kilograms. Air, at sea level, weighs about 1.2 kilograms per cubic meter. Water is roughly 830 times heavier than air. This density means hydropower packs far more energy per unit volume than wind. A modest river, channeled through a dam, can generate gigawatts.
Second, hydropower is dispatchable. Unlike solar (clouds happen) or wind (calms happen), a reservoir stores water. Operators can release more or less water on command, ramping power output up or down within seconds. This dispatchability makes hydropower the grid’s shock absorber — the tool other renewables lean on when conditions are unfavorable.
Third, pumped storage. When generation exceeds demand, instead of spilling water, operators can run the turbine in reverse, using excess electricity to pump water back up into the reservoir. This turns the dam into a giant battery. Globally, pumped storage accounts for more than 90% of all electrical energy storage capacity.
The Physics Limits No One Can Escape
Even perfect engineering cannot defeat the First Law of Thermodynamics. No hydropower plant can produce more electrical energy than the gravitational potential energy of the water that falls through it. The theoretical maximum is set by the fall itself.
For a 100-meter head with no losses, the maximum power per cubic meter per second is:
P/m³·s⁻¹ = g × h = 9.81 × 100 = 981 W per m³/s
A 500 m³/s river falling 100 meters can produce at most 490.5 MW before efficiency losses. You cannot engineer around gravity. You can only work with it.
The practical ceiling for head height is set by geography. The tallest dams in the world — Nurek (300 m), Xiaoheyan (310 m) — push toward the structural limits of concrete. At some point, the pressure at the base of the dam exceeds what any known material can withstand. Physics sets the boundary; engineering tries to get close to it.
The Equation That Runs Every Dam
Strip away the turbines, generators, transformers, and transmission lines, and what remains is a single relationship that governs every hydropower plant on Earth:
P = η × ρ × g × h × Q
No exceptions. No workarounds. Plug in your numbers, and the answer is the answer. The dam either produces that power or it does not. The water falls, the turbine spins, the generator turns, and the grid receives electricity — all because a mass of water lost height in a gravitational field.
That is not magic. That is just physics, doing what physics does.