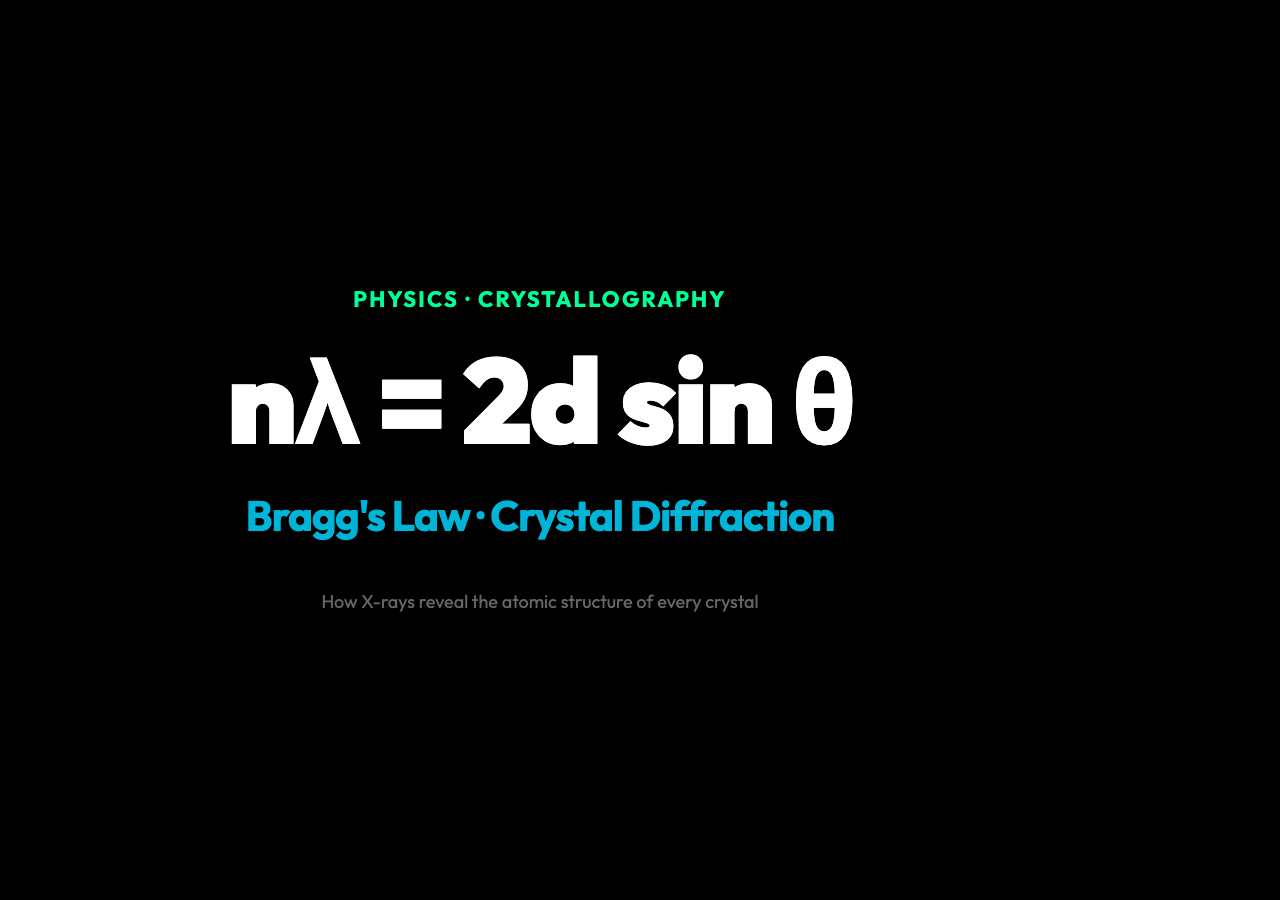
The Problem: You Cannot See Atoms With Light
Imagine you are a scientist in 1912. You have X-rays — discovered just 13 years earlier — and you want to understand how atoms are arranged inside a crystal. The problem: ordinary light waves are thousands of times too large to probe atomic distances. X-rays, with wavelengths around 1 angstrom (1 Å = 10⁻¹⁰ m), are roughly the right size. But how exactly do you extract structural information from what comes back?
This was the challenge that William Lawrence Bragg solved — and the solution is one of the most elegant equations in all of physics.
Bragg’s Law: Two Path Lengths, One Constraint
When an X-ray beam strikes a crystal, it does not bounce off the surface. It penetrates and scatters off planes of atoms arranged in a regular lattice. Each atomic plane reflects a small portion of the beam. The key insight is that the beam reflected from a deeper plane travels a longer path — and when that extra path length equals an integer multiple of the wavelength, the reflections from all the planes line up in phase, producing a strong constructive interference signal.
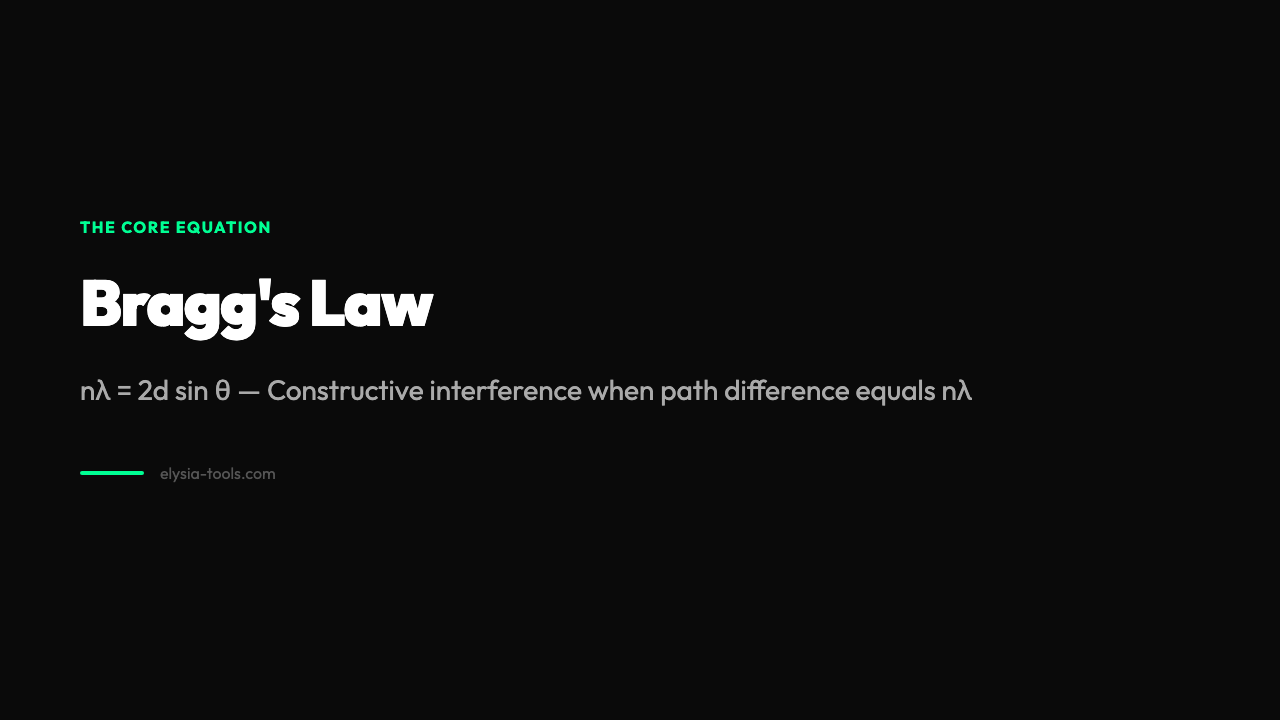
Bragg formalized this with a single constraint:
nλ = 2d sin θ
where: – n is the order of the reflection (an integer: 1, 2, 3…) – λ is the X-ray wavelength – d is the spacing between adjacent crystal planes – θ is the angle of incidence measured from the crystal plane
The geometry is simple: the extra distance traveled by the ray going one layer deeper and back up is 2d sin θ. When this equals nλ, every wave reinforces every other — a bright reflection. Otherwise, they interfere destructively and cancel out.
You can explore this interactively at Elysia Tools, where you can vary the wavelength, plane spacing, and angle and watch the interference intensity respond in real time.
Why 1.54 Angstroms Is the Most Famous Wavelength in Crystallography
Not all X-rays are equally useful for crystallography. The classic choice is Cu Kα radiation, which has a wavelength of λ = 1.54 Å. This is no accident: it is roughly comparable to typical interatomic spacings in crystals (1–3 Å), which means the diffraction angles θ are large enough to measure precisely — typically between 10° and 60° for most crystal planes.
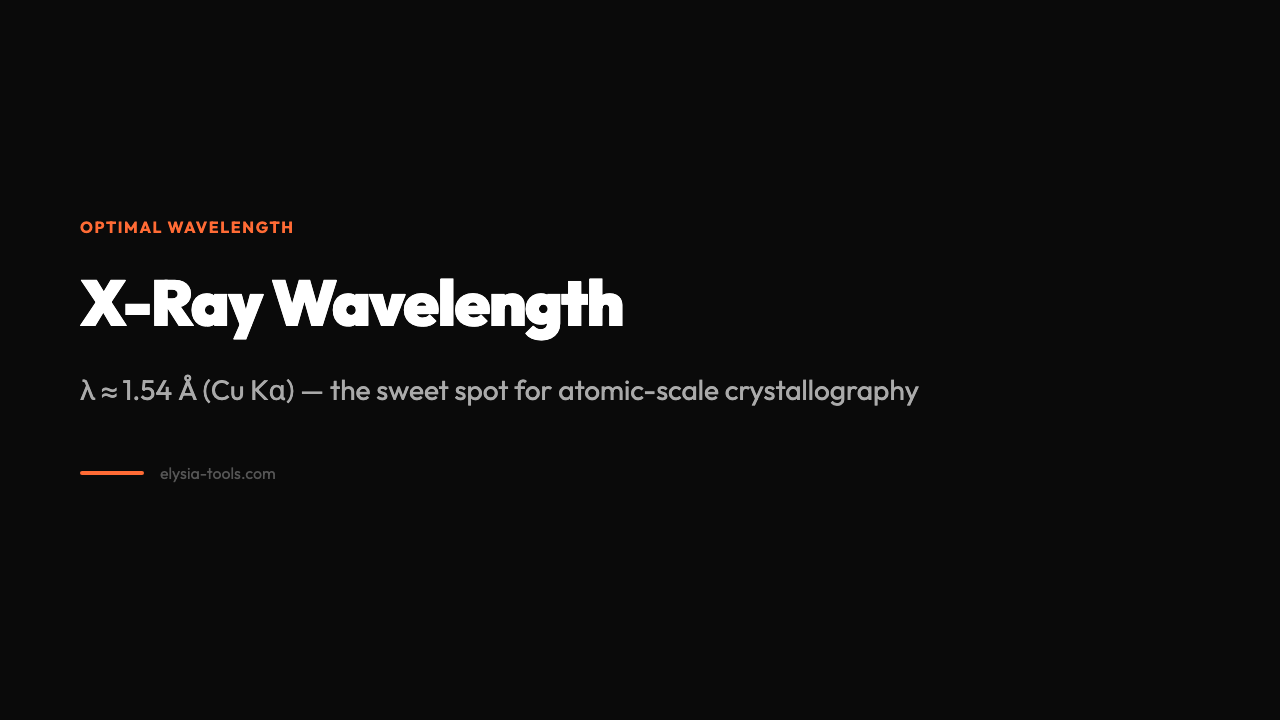
In the interactive visualization, the default wavelength is set to 1.54 Å, matching standard laboratory X-ray sources. Adjusting λ to be much smaller produces very small diffraction angles (difficult to resolve); adjusting it to be much larger produces angles so large that multiple orders overlap. The sweet spot is around 1 Å — right where copper Kα lives.
The Crystal Planes Problem: Which Planes Actually Diffract?
For a cubic crystal, there is an infinite family of possible planes. But not all produce visible reflections. The Miller indices (h, k, l) define each plane family, and the condition for a reflection depends on the relationship between these indices and the wavelength.
For a simple cubic lattice, the interplanar spacing d for planes with Miller indices (hkl) is:
d = a / √(h² + k² + l²)
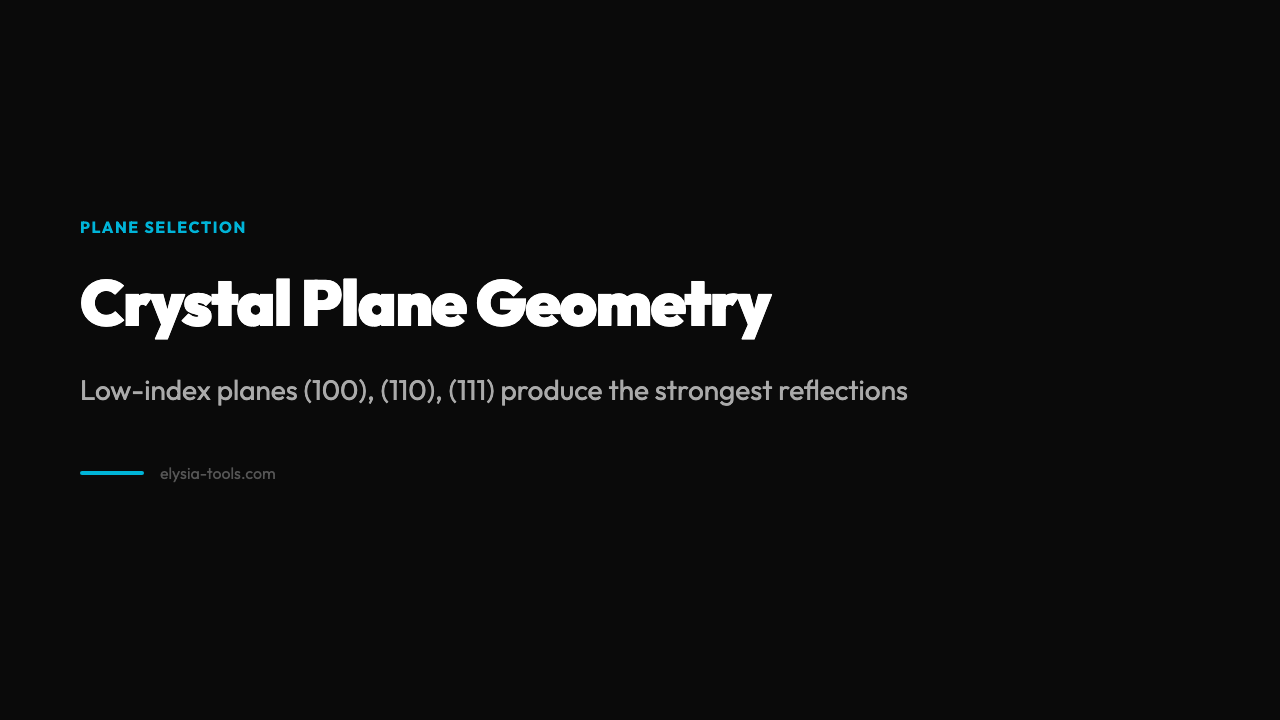
where a is the lattice constant. Planes with larger h² + k² + l² have smaller d, which means they produce diffraction at larger angles (since sin θ = nλ / 2d must remain ≤ 1). This is why low-index planes like (100), (110), and (111) are the most commonly observed — they have the largest d-spacings and thus the strongest, most accessible reflections.
Try adjusting the crystal orientation in the Bragg’s Law visualization to see which plane families light up at different angles.
From Salt to DNA: What Bragg’s Law Made Possible
The impact of this equation is hard to overstate. Bragg’s original 1913 paper used it to determine the crystal structure of sodium chloride (NaCl) — the first time anyone had directly confirmed the periodic arrangement of atoms in a solid. By 1914, Bragg had extended the method to more complex structures and was awarded the Nobel Prize, shared with his father William Henry Bragg. They remain, to date, the only father-son pair to share a Nobel Prize in the same field.
In the decades that followed, Bragg’s Law became the foundation of X-ray crystallography. Every molecular structure solved by diffraction — hemoglobin, penicillin, vitamin B12, DNA — rests on this equation. The pharmaceutical industry uses it to confirm that a drug molecule has the correct crystal form. Materials scientists use it to measure residual stress in turbine blades. Geoscientists use it to identify minerals in rock samples without destroying them.
The Elysia Tools visualization captures the essential physics: wavelength, angle, crystal spacing, and interference intensity, all in one interactive diagram. It is the same relationship Bragg wrote down over a century ago, now explorable in a browser.
What the Equation Cannot Tell You
Bragg’s Law tells you when constructive interference occurs — but not how intense the resulting reflection will be, or how the intensity varies across different crystal structures. That additional information comes from the structure factor, which accounts for the actual arrangement of atoms within each unit cell. A (100) reflection might be strong in one crystal structure and forbidden (zero intensity) in another, even when Bragg’s condition is satisfied. This is why crystallographers need both Bragg’s Law and a detailed analysis of reflection intensities to fully solve a structure.
For a first encounter with X-ray diffraction, though, Bragg’s Law is the perfect starting point — one constraint, one geometric picture, and it explains why crystals and X-rays together produce a map of atomic positions.
The next time you see an X-ray crystallography diagram in a textbook, remember: you are looking at Bragg’s Law in action — one equation that unlocked the atomic structure of every crystal ever studied. The visualization at Elysia Tools lets you adjust the wavelength, crystal spacing, and incidence angle and watch the interference pattern respond in real time. There is something quietly profound about a law that reduction — a single constraint on path difference — that governs everything from why diamond sparkles to how penicillin was first mapped to its molecular structure.