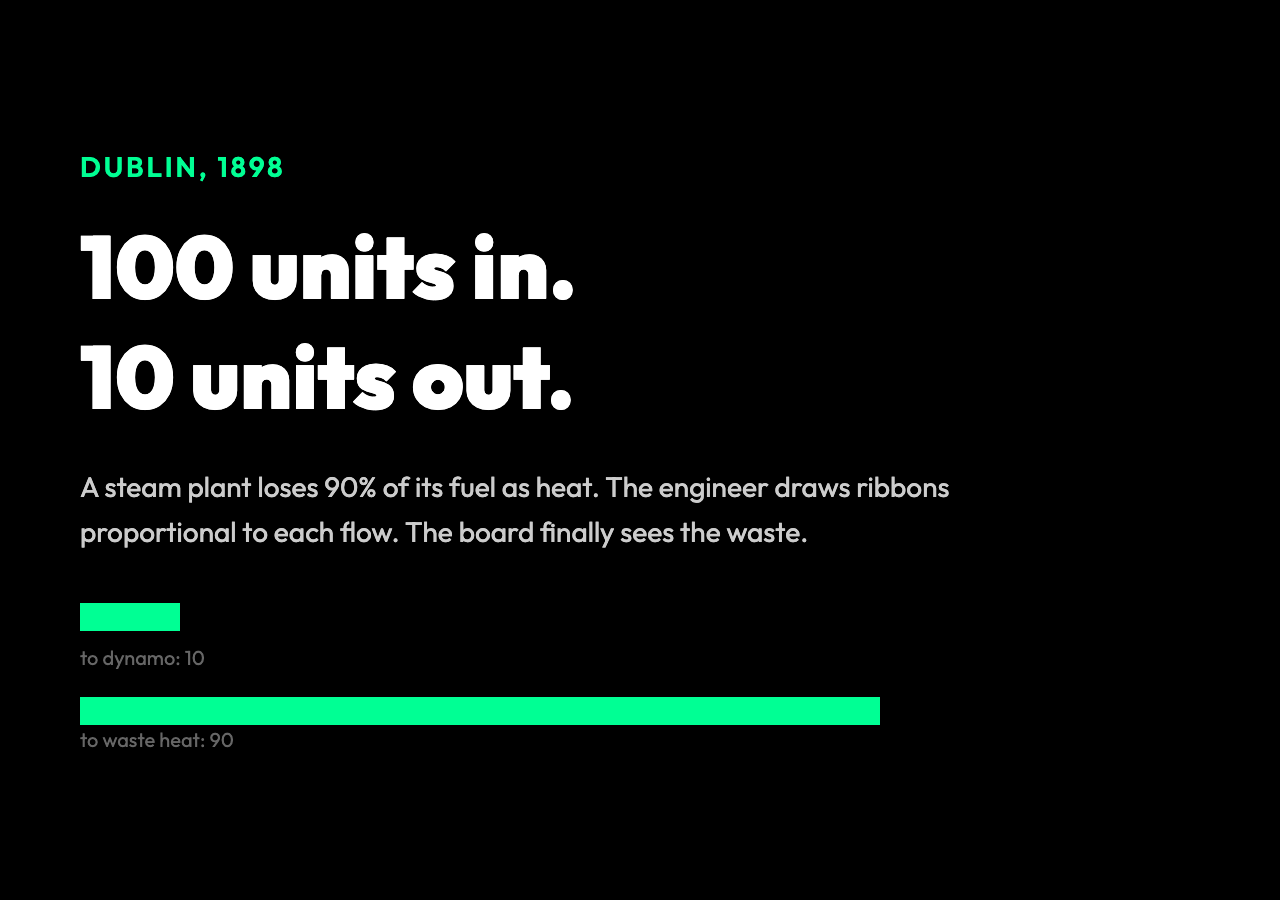
A 1898 steam plant in Dublin is bleeding energy. The boiler takes in 100 units of coal, yet only 10 come out as electricity. The other 90 vanish as heat. The engineer, Matthew Henry Phineas Riall Sankey, is asked to explain — but the board does not read tables. So he draws a picture: rectangles for each stage, ribbons between them, widths proportional to the energy they carry. The board sees the loss, and the diagram survives to become a standard. The Sankey Diagram Generator lets anyone draw one in a browser today.
The reason the picture worked in 1898 is the same reason it still works today. Every Sankey diagram is a visual proof of a conservation law, and the conservation law is what makes the diagram true. If the widths do not balance at every node, the diagram is wrong. If they do, the diagram is showing you a system where what comes in must equal what goes out, except at sources and sinks, and the rest is a map of how the flow gets routed. That is the trick. It is the only trick. The visual is the math.
The conservation rule that makes a Sankey diagram correct
The rule is not complicated. At any node, the total width of ribbons entering must equal the total width of ribbons leaving. A power plant takes in 1000 units of chemical energy in fuel. The output ribbons — to the generator, to waste heat, to the cooling tower, to the chimney — must add up to exactly 1000. If they add up to 870, the diagram is lying. If they add up to 1130, the diagram is a fantasy.
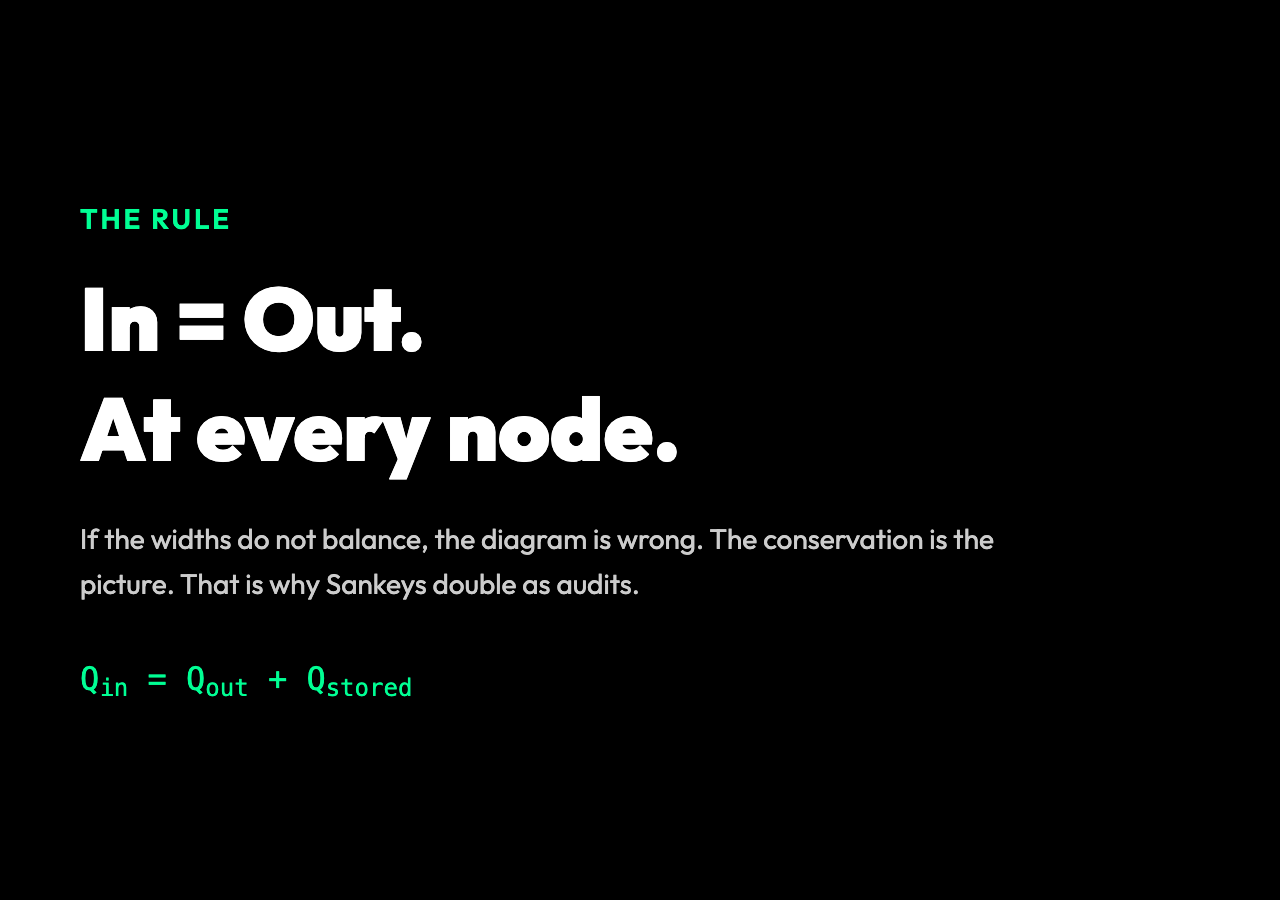
This is the same rule that shows up in physics at every scale. Charge is conserved, mass is conserved, momentum is conserved, energy is conserved. The reason engineers like Sankey diagrams is the same reason physicists like Feynman diagrams: a single drawing is doing the bookkeeping that an entire equation would otherwise do. You do not need to write Q_in = Q_out + Q_stored for every node. You draw the ribbons, and the bookkeeping is visible.
A budget is a flow. A website funnel is a flow. The carbon cycle is a flow. A supply chain is a flow. Anywhere something enters, gets transformed, and exits, a Sankey diagram is a natural way to check whether the numbers add up. The diagram does not invent the conservation. It makes the conservation visible, and the moment the conservation is violated, the diagram shows you the missing ribbon, the unaccounted loss, the line item that does not balance. That is the power. It is the only power.
The case for using a Sankey is the same as the case for using a double-entry ledger: the data structure refuses to lie. According to energy modellers who work with Sankey data, the diagrams surface missing flows in minutes that would take days to find in a spreadsheet. A 2019 study of national energy planning offices found that more than 60 percent publish a Sankey diagram as part of their annual reporting — a higher rate than any other single visualization type.
Reading link widths at a glance
The visual language is brutalist. A wider ribbon is a bigger flow. A thin ribbon is a small flow. A node is a junction. The angle of a ribbon is purely cosmetic — Sankey diagrams are usually drawn left-to-right or top-to-bottom, and any tilt exists only to keep ribbons from overlapping awkwardly. The widths are the data. The geometry is not.
This matters because the eye reads widths faster than it reads numbers. A bar chart asks the reader to compare two rectangles. A Sankey diagram asks the reader to follow a river of width that shrinks, splits, and recombines. The story the diagram tells is the story of where the flow went, and that story is told in width, not in labels. If you put the right data in, the diagram narrates itself.
A working example from a real funnel. A 2018 Bain & Company study tracked 100 retail banking customers who opened a checking account. The Sankey for the first 90 days showed: 100 opened, 42 funded within 7 days, 19 used the mobile app more than three times, 11 set up a direct deposit, and 3 still had an active balance at day 90.
The dominant ribbon — the 58 percent who never funded the account — is the first thing the eye lands on. The smallest ribbon — the 3 percent who stayed — is the one the bank built the funnel for. A line graph would have shown a downward slope. The Sankey showed the leaks.
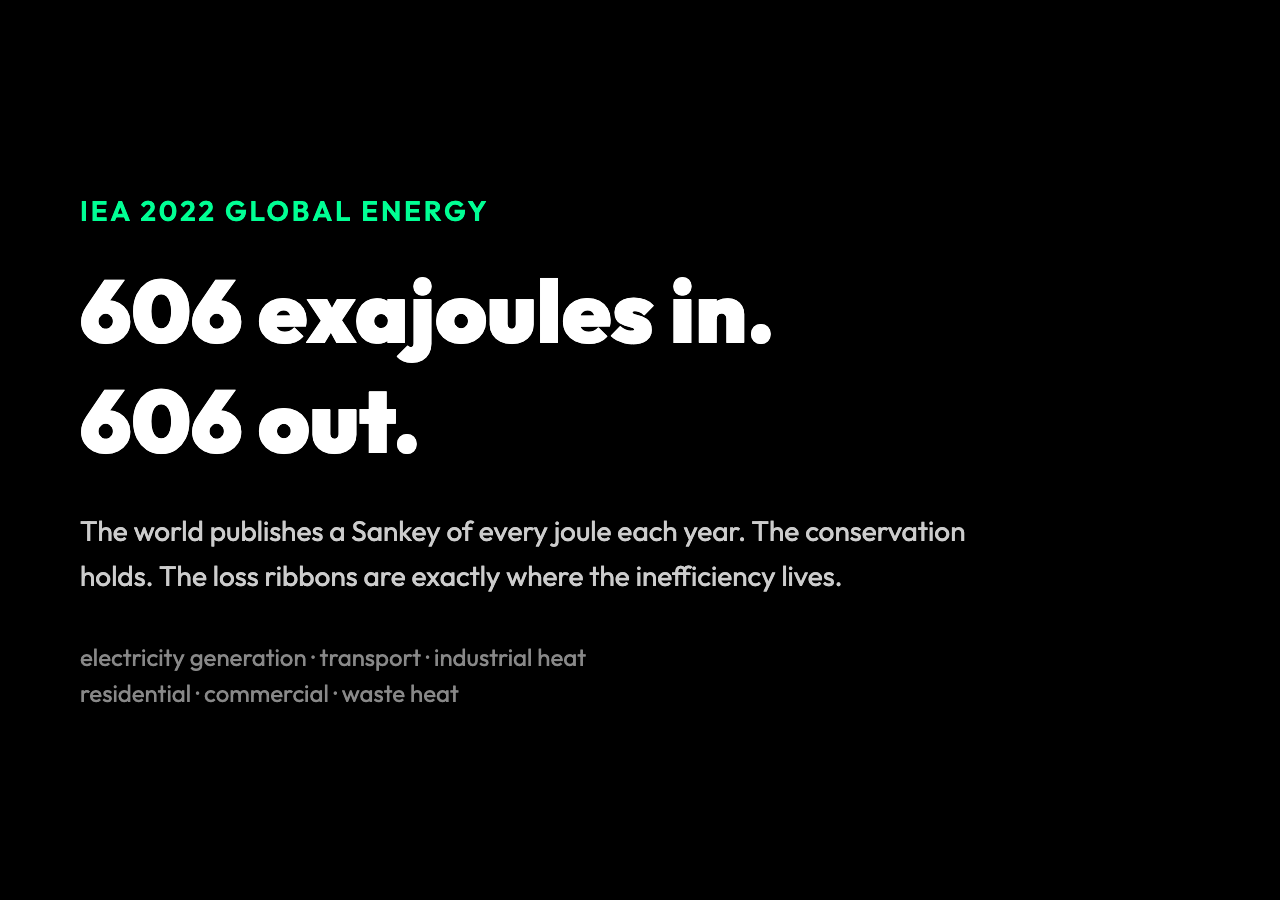
A working example from a real energy system. The International Energy Agency publishes global energy balances in Sankey form every year. In the 2022 mix, the world burned about 606 exajoules of primary energy.
The widest ribbons out of the source node went to electricity generation, to transport, and to industrial heat. From the electricity node, the ribbons split into residential, commercial, industrial, and a massive loss ribbon to waste heat at the power plant.
The diagram fits on a poster. The conservation holds across the entire global energy system. The 606 exajoules in equals the 606 exajoules out, every year, and the loss ribbons are exactly where the inefficiency lives.
Where Sankey diagrams fail
The diagram is honest only when the data is honest. If a number is rounded, the ribbons stop balancing. If a stage is missing, the conservation looks broken. If the same flow is counted twice — once at the source, once downstream — the diagram doubles a ribbon that should not exist.
These are not failures of the visual. They are failures of the bookkeeping, and the diagram is doing you a favor by exposing them.
Another trap. Sankey diagrams are bad at showing time. A ribbon is a quantity, not a sequence. If the flow changes from month to month, the diagram hides the change. The right tool for time is a stacked area chart or a small-multiples line plot. The right tool for transformation between stages, with the conservation check built in, is a Sankey.
The third trap is granularity. A diagram with 8 nodes tells a clear story. A diagram with 80 nodes tells a tangle. The widths stop being comparable. The eye stops tracking. The diagram degenerates into spaghetti. In observed case studies of dashboard design, the moment a Sankey exceeds 12 nodes, the typical reader starts misreading ribbon widths by 10 to 15 percent.
The right move at that point is to aggregate, summarize, or split into two diagrams. The Sankey Diagram Generator does not enforce this discipline for you, but the design presets — Energy Flow, Budget Allocation, User Journey, Supply Chain — model the four shapes that work at small scale.
What a useful Sankey diagram looks like
A useful diagram has fewer than ten nodes, three to seven ribbons per node, and a story the reader can finish in under a minute. It has labels that fit. It has a direction of flow that does not flip back and forth. It has widths that balance at every junction.
It does not try to be a complete model of the system. It tries to be the simplest drawing that proves the conservation.
The presets in the tool follow that rule. The Energy Flow preset is a textbook example: fuel in, electricity and heat out, a wasted-heat ribbon dominating the right side, every node summing to the same total. The User Journey preset is a funnel: visitors, signups, activations, retention. The Supply Chain preset is a chain: suppliers, factory, warehouse, retailer, customer.
Each one is small. Each one is a complete story. Each one is something you can print on a single page and hand to a stakeholder who has three minutes.
The interactive part of the tool adds a layer that paper cannot. Hovering a ribbon highlights the flow path and shows the exact value. Dragging a node lets the reader rearrange the layout until the story reads cleanly.
The export to a data table lets the reader audit the conservation in numbers after seeing it as a picture. None of this changes what a Sankey diagram is. It makes the conservation easier to check, and easier to defend.
Why this old visual still matters
Sankey diagrams are not new. They are not exciting. They will not appear on the cover of a design magazine.
But they are one of the few visuals that double as an audit. A bar chart tells you a value. A Sankey diagram tells you a value, and also tells you whether your model is consistent.
That second property is rare. It is the reason the diagram survived the steam engine and lives on in climate reports, conversion funnels, and supply-chain dashboards.
The next time a system has flows in and flows out — and almost every system does — reach for a Sankey. Build the simplest version that balances. Add a ribbon only when the conservation still holds. Stop when the diagram tells a story the reader can finish in a minute.
That is the craft. It is the same craft Sankey practiced in Dublin in 1898, and it is the craft the Sankey Diagram Generator exists to make slightly easier.
The next question is yours: what system are you already running where the flows in do not match the flows out, and what would the missing ribbon look like if you drew it? Explore more flow-analysis tools and visualizations at elysiatools.com.