The next time you read a poll saying 52% of voters support Candidate A, ask yourself one question: with what confidence? If the answer is “we didn’t compute one,” the headline is half a sentence wearing a costume. A point estimate without a confidence interval is a single dot on a number line — useful only if you can see the bracket around it. The bracket is where the truth lives.
The confidence interval calculator is one of those quiet tools that, once you understand it, makes every piece of statistical reporting you read feel slightly different. It does two things and does them well: it takes either a raw dataset or summary statistics (mean, standard deviation, sample size) and returns the bracket — the range within which the true population parameter almost certainly falls. That’s the entire job, and the entire reason it matters.
The story the headline doesn’t tell
Imagine a startup testing two checkout button colors. Five thousand visitors see green, five thousand see blue. Green wins with a 4.8% conversion rate; blue wins with 4.3%. The team-lead posts in Slack: “Green is winning.” Engineering rolls out green to everyone.
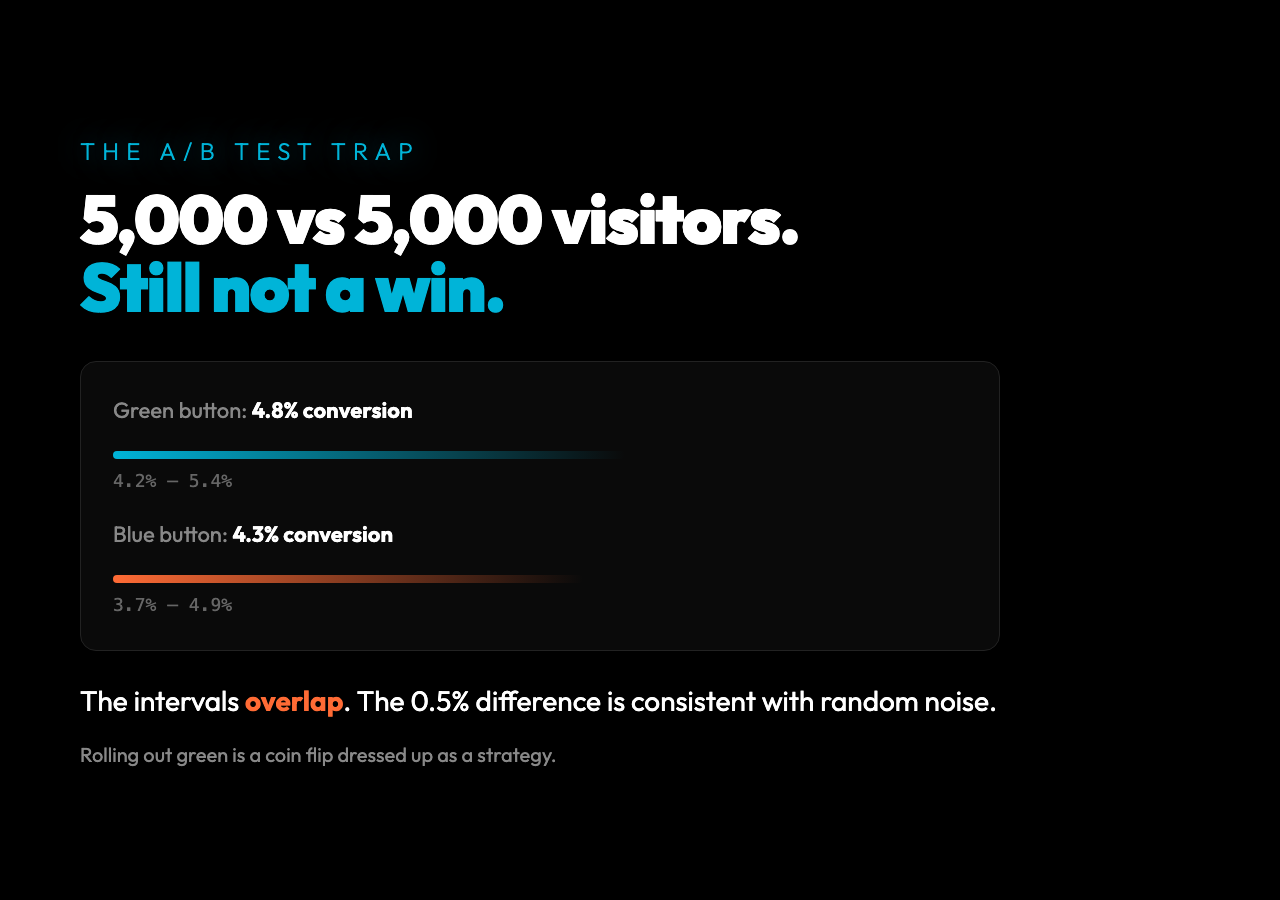
But here is what the team-lead didn’t compute. With two samples of 5,000, the 95% confidence interval for each conversion rate is roughly plus or minus 0.6 percentage points. Green: 4.2% to 5.4%. Blue: 3.7% to 4.9%. The intervals overlap. The difference is consistent with random noise. Rolling out green is a coin flip dressed up as a strategy.
This is the trap the confidence interval calculator is built to defuse. A confidence interval is not a guess about the future. It is a quantified statement about your uncertainty given the data you have. The 95% in “95% confidence” doesn’t mean “there’s a 95% chance the truth is in this range” — that’s the most common misunderstanding. It means: if you repeated this measurement many times under the same conditions, 95% of the computed intervals would contain the true value. The interval you get is one of those. You don’t know if it’s one of the 95% or one of the 5%. But the math is honest about that.
What the tool actually does
Drop in a column of numbers, pick a confidence level, and the calculator returns the lower bound, upper bound, margin of error, and standard error for the mean. Feed it a count of successes and a total trial count, and it switches to a proportion interval. The back end is two formulas that have not changed since Student published them in 1908.
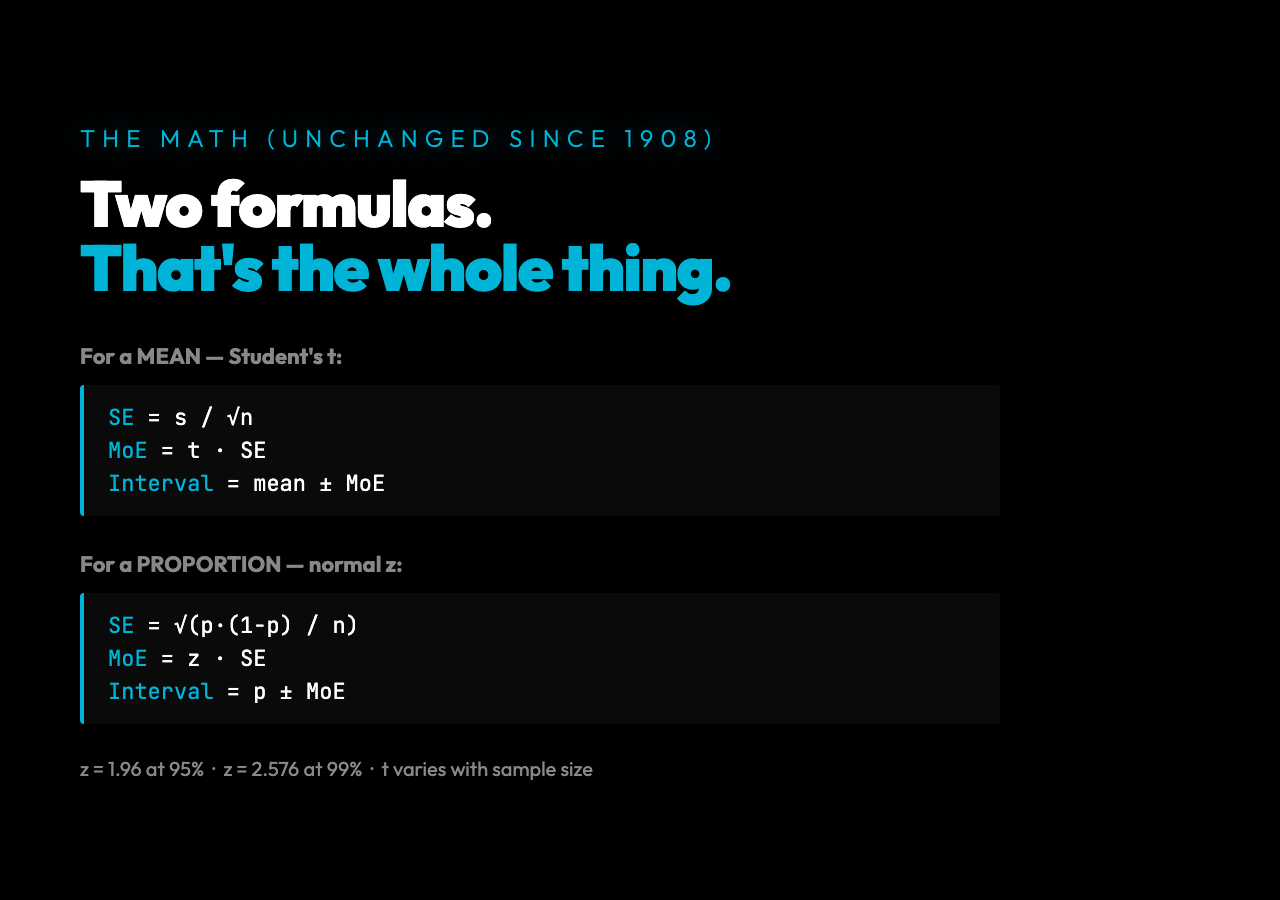
For a mean with raw data, the math is:
- – Standard error of the mean:
SE = s / sqrt(n), where
sis the sample standard deviation and
nis the sample size
- – Margin of error:
MoE = t * SE, where
tis the critical value from Student’s t-distribution for your chosen confidence level and degrees of freedom (
n - 1)
- – Interval:
mean ± MoE
For a proportion (the polling case, the conversion-rate case, the A/B test case), the math simplifies:
- – Standard error:
SE = sqrt(p * (1 - p) / n), where
pis the observed proportion
- – Margin of error:
MoE = z * SE, where
zis the z critical value (1.96 for 95%, 2.576 for 99%)
- – Interval:
p ± MoE, clamped to
[0, 1]
The tool uses the t-distribution for means (because you rarely know the true population standard deviation, and the t-distribution has fatter tails that account for that ignorance). It uses the normal-approximation z for proportions (which is fine for
n p > 5and
n (1 - p) > 5; the calculator’s underlying source also handles small-sample edge cases gracefully). Six confidence levels from 80% to 99% are available — which matters more than most users realize.
Why your confidence level is a tradeoff, not a guarantee
Higher confidence sounds like it should always be better. It isn’t. The relationship between confidence and width is brutal: a 99% confidence interval is roughly 1.4 times wider than a 95% one. A 99.9% interval is roughly 1.8 times wider. The wider you go, the more useless the bracket becomes for decision-making.
This is the most-misunderstood knob on the confidence interval calculator. When a pharmaceutical company reports a drug is effective with “99% confidence,” they are making a statement that is much weaker in practical terms than it sounds. They are saying: if we ran this trial many times, 99% of the time the interval would contain the true effect size. But that interval is so wide that the lower bound may be clinically meaningless. The “confidence” is in the method, not in the drug.
The right confidence level is the one that makes the width of the interval useful for the decision you are about to make. For an A/B test where you only need to detect a 5% lift, 95% is usually plenty. For a medical diagnosis threshold, 99% may be required. For a casual survey you ran in a college class, 90% is fine. The calculator defaults to 95% because that is the convention — not because 95% is universally correct.
The hidden assumption: random sampling
The entire framework rests on one assumption that almost nobody outside a statistics class thinks about: your data is a random sample from the population you are trying to describe. If you poll 1,000 Twitter users to estimate national voter intent, you do not have a 95% confidence interval of “plus or minus 3.1%.” You have a 95% confidence interval of Twitter users, which is a different population. The interval is mathematically correct; the interpretation is wrong.
This is why political polls report both a margin of error and a design effect. The margin of error is the statistical part. The design effect covers the gap between “what the math says” and “what the world is.” Most calculators — including the confidence interval calculator — give you the statistical part. The interpretation is on you. Any tool that promises to tell you what percentage of voters support a candidate is selling you a number, not a measurement.
What the interval actually means when you change the inputs
Try this. Run the same dataset through the tool at 80%, 95%, and 99%. The width changes. The center doesn’t. Now shrink the sample size from 1,000 to 100, holding the mean and standard deviation fixed. The interval roughly triples in width. Now reduce the standard deviation by half (a more homogeneous sample). The interval shrinks by half. The relationship between sample size, spread, and interval width is the only equation in this article worth memorizing by heart:
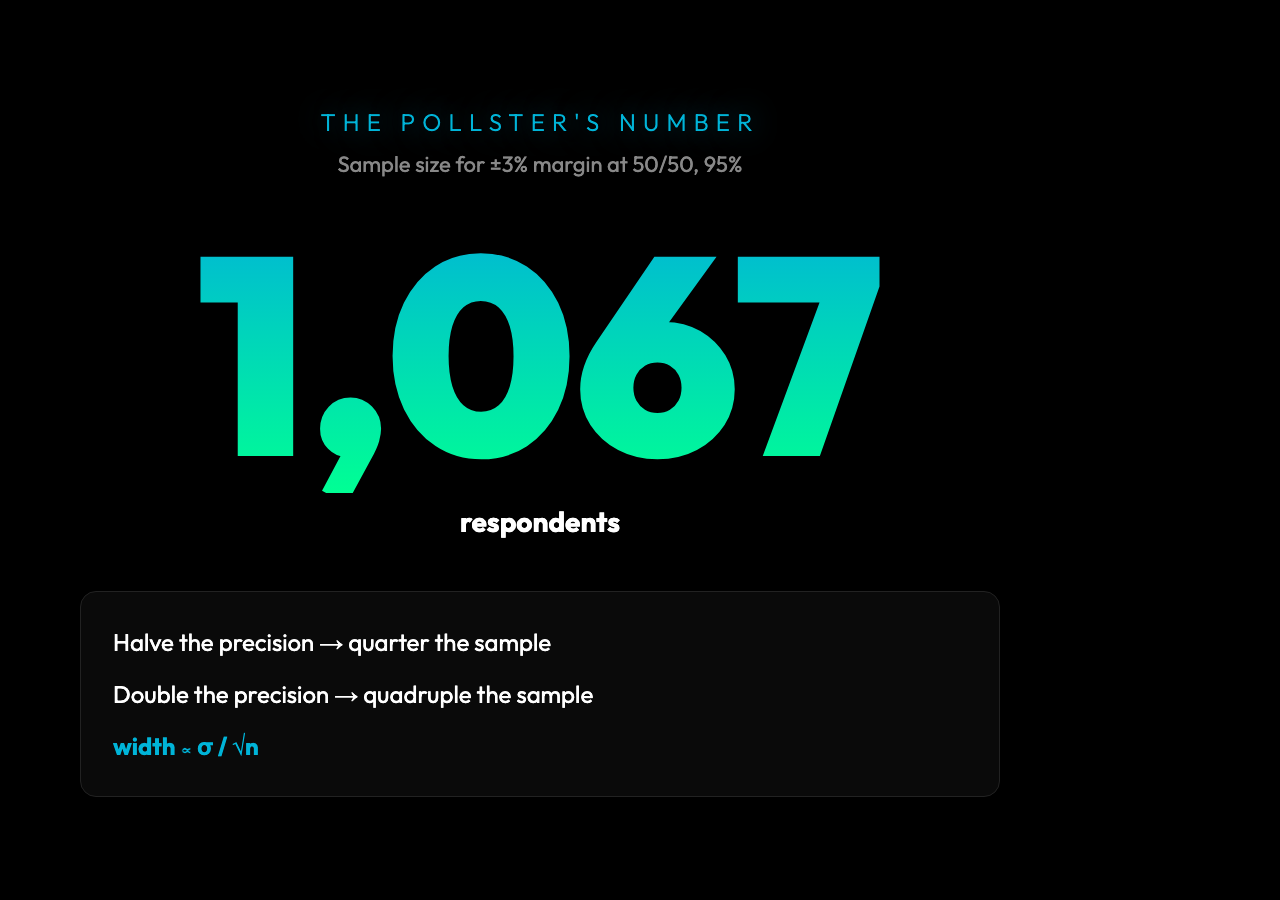
width ~ standard_deviation / sqrt(sample_size)This is why polls need roughly 1,067 respondents to get a 3% margin of error on a 50/50 question. Halve the precision you want, and you quarter the sample size you need. Double the precision, and you quadruple it. Sample-size calculations are not arbitrary — they are this formula, inverted.
Where this leaves you
The next time someone says “the data shows X,” ask them one more question: and the interval? The interval is the difference between a measurement and a claim. It is the difference between an honest reporter and a confident one. So what do you do when the interval is wider than the decision you are trying to make?
The answer is not a bigger survey. The answer is a better question. Confidence intervals are not a hedge. They are the most precise statement about uncertainty that the math allows, and computing them takes about ten seconds when the data is already in front of you.
The confidence interval calculator is a free tool that handles both cases — drop in raw data for a mean, or successes and trial counts for a proportion. It runs the t and z formulas that have not changed since 1908, sweeps six confidence levels, and returns a bracket that is small enough to be useful or large enough to be honest, whichever the data actually warrants. Explore more statistical and analysis tools at elysiatools.com.
The next time you ship an A/B test, publish a survey, or read a poll, run the numbers yourself. The interval will tell you whether the headline survived contact with the data.