Every founder knows the moment: a number on a spreadsheet promises to tell you whether the next quarter survives. Fixed costs roll in like tide. Variable costs trickle against each unit sold. Price is whatever the market will bear. Somewhere in the middle sits the break-even point — the moment revenue stops paying off debt and starts paying you. The math is simple. The mistake is using the wrong variable, the wrong time horizon, or the wrong sense of profit.
This is what a break-even calculator is for. Not to make the decision, but to make the assumption set visible. Every line is a guess. The calculator’s job is to hold those guesses still while you poke at them.
This guide walks through what the formula actually means, why most break-even analyses quietly lie about reality, and how to use the calculator at Elysia Tools to stress-test a pricing decision before it becomes a binding contract.

The Break-Even Formula, Stripped to Its Skeleton
The standard formulation is:
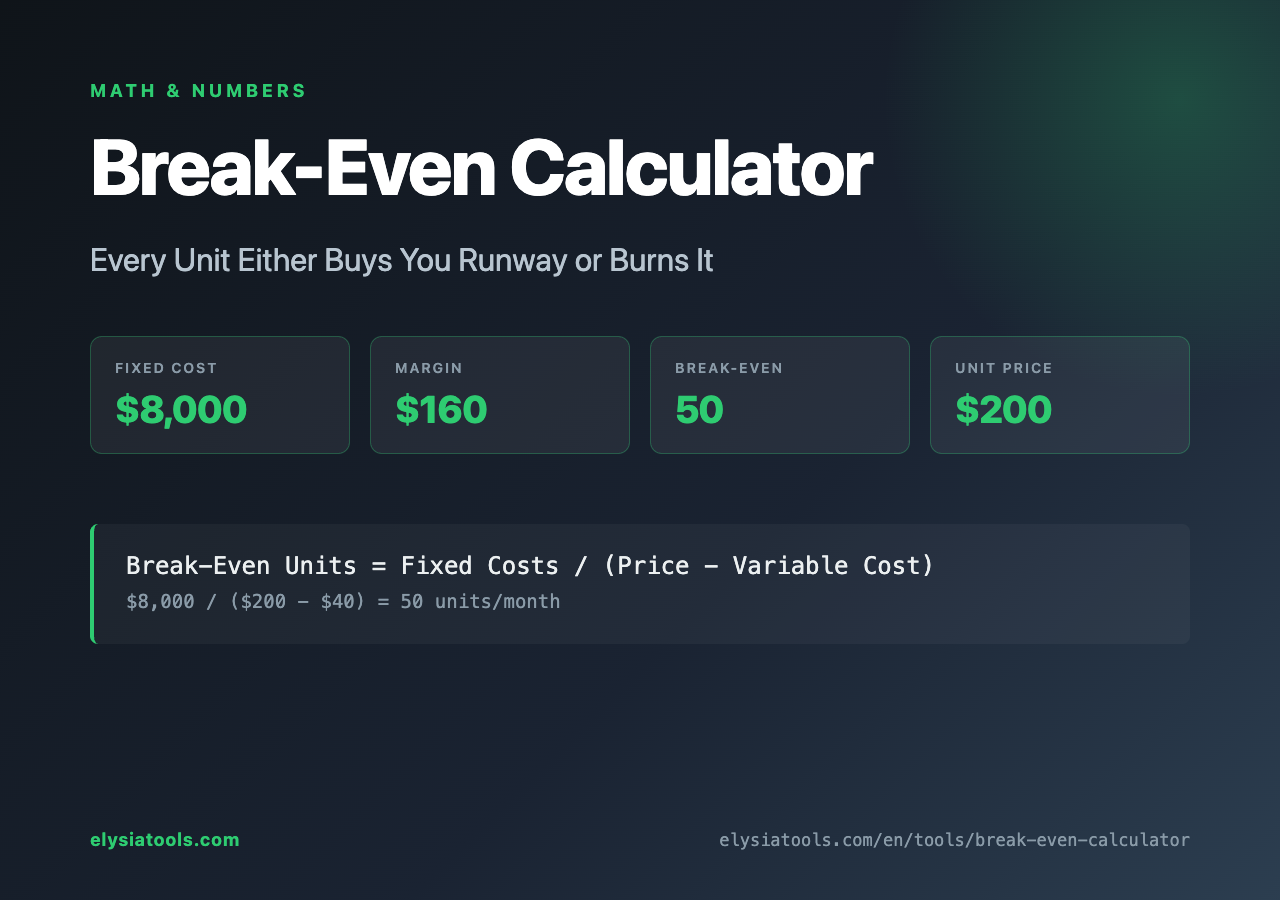
Break-even units = Fixed Costs / (Price per unit − Variable cost per unit)
The denominator — price minus variable cost — is what accountants call the contribution margin. It is, in plain terms, the dollars each unit puts toward paying for the rent after it has paid for itself. Once you have that margin, dividing the fixed costs by it tells you how many units of contribution you need to cover the fixed pile.
Take a concrete case. Suppose you sell a digital course for $200. The platform fee, payment processing, and any royalties add up to $40 per sale. That leaves $160 of contribution. If your monthly fixed costs (instructor, software, hosting, the assistant who answers support tickets) total $8,000, then:
$8,000 / $160 = 50 units per month
Sell fewer than 50, the month is in the red. Sell 50, you are flat. Sell 60, you have earned $1,600 of operating profit — the kind of number that buys coffee but does not buy runway.
That is the entire formula. The hard part is not the arithmetic. The hard part is being honest about which numbers belong in fixed and which belong in variable.
What Is Actually Fixed and What Is Actually Variable
The textbook classification says: fixed costs do not change with volume, variable costs do. Rent is fixed. Raw materials are variable. But real businesses are not textbooks, and the categories blur faster than most founders admit.
An engineer hired for support is a fixed cost — until the customer base doubles and you hire a second one. A SaaS subscription for email automation looks fixed at $300/month, but if it is billed per contact and your list grows, it has quietly become variable. A contractor paid per project is variable in dollar terms but feels fixed in headcount.
The pragmatic rule: over your planning horizon, can you predict the cost from volume alone? If yes, it is variable. If you need a separate forecast for it (a hiring plan, a tooling upgrade, a new office), it is fixed. The calculator at Elysia Tools lets you enter both, but the value comes from the discipline of putting each cost in the right bucket before you submit numbers to the formula.
It is also worth asking which costs are sunk — already spent and unrecoverable — versus truly at-risk in the period you are analyzing. A founder who paid $40,000 to develop a product last year and is now deciding whether to launch should not include that $40,000 in this month’s break-even calculation. The decision is already made. The relevant number is the cost of continuing, not the cost of having begun.
The Contribution Margin Trap
Contribution margin looks like a clean number. It is not.
Variable costs in real pricing have a habit of being non-linear. The first 1,000 units of a physical product ship with one freight rate. The next 5,000 trigger a volume discount. Beyond 10,000 you renegotiate the supplier. If you compute break-even using the average variable cost across all units, you are implicitly assuming the cost function is flat. It almost never is.
The way around it is to compute break-even at the margin that applies to the units near the decision point. If you are deciding whether to launch today and the realistic first-month volume is 200 units, use the variable cost at 200 units. If you are scaling to 5,000, recompute. The break-even point is not a single number. It is a curve, and the calculator will show you a single point on that curve. Choose the point that matches your horizon.
There is a related trap with discount-driven pricing. A flash sale that drops the price by 30% looks like a great way to clear inventory, but the contribution margin on those units is now your standard margin minus the discount. If the discounted margin goes negative — meaning you lose money on each discounted sale before even counting fixed costs — you are not building runway, you are burning it. The break-even point under the discounted price may exceed your entire realistic sales capacity, which means the promotion is, in accounting terms, a donation to your customers.
Beyond Units: Break-Even in Revenue and Time
Unit break-even is the headline number, but two companion metrics matter just as much.
Revenue break-even is the dollar amount of sales required to cover fixed costs, calculated as break-even units multiplied by price. It is the same information in different units, but revenue is what the bank account speaks in. A business that breaks even at 50 units but only sells 30 is more legible as “$10,000 short this month” than as “20 units short.”
Time break-even is the number of months (or weeks) at your projected sales rate to reach the cumulative fixed-cost threshold. This is the most honest of the three for early-stage businesses, because the realistic question is rarely “can we ever hit 50 units” — it is “can we hit 50 units per month consistently enough that the cash does not run out first.” A 50-unit break-even with a 12-month runway and 30 units of organic demand per month is a survivable problem. The same break-even with a 3-month runway is an emergency.
The break-even calculator at Elysia Tools handles the first two directly. The third — time break-even — requires you to set the volume assumption explicitly, because the calculator does not know how fast you intend to grow. That is a feature, not a bug. Forecasting growth belongs to you, not the tool.
Stress-Testing With Scenarios
A single break-even number is a single point in a sea of uncertainty. The value of a calculator is not in producing that number. It is in producing different numbers as the inputs change.
Three scenarios worth running:
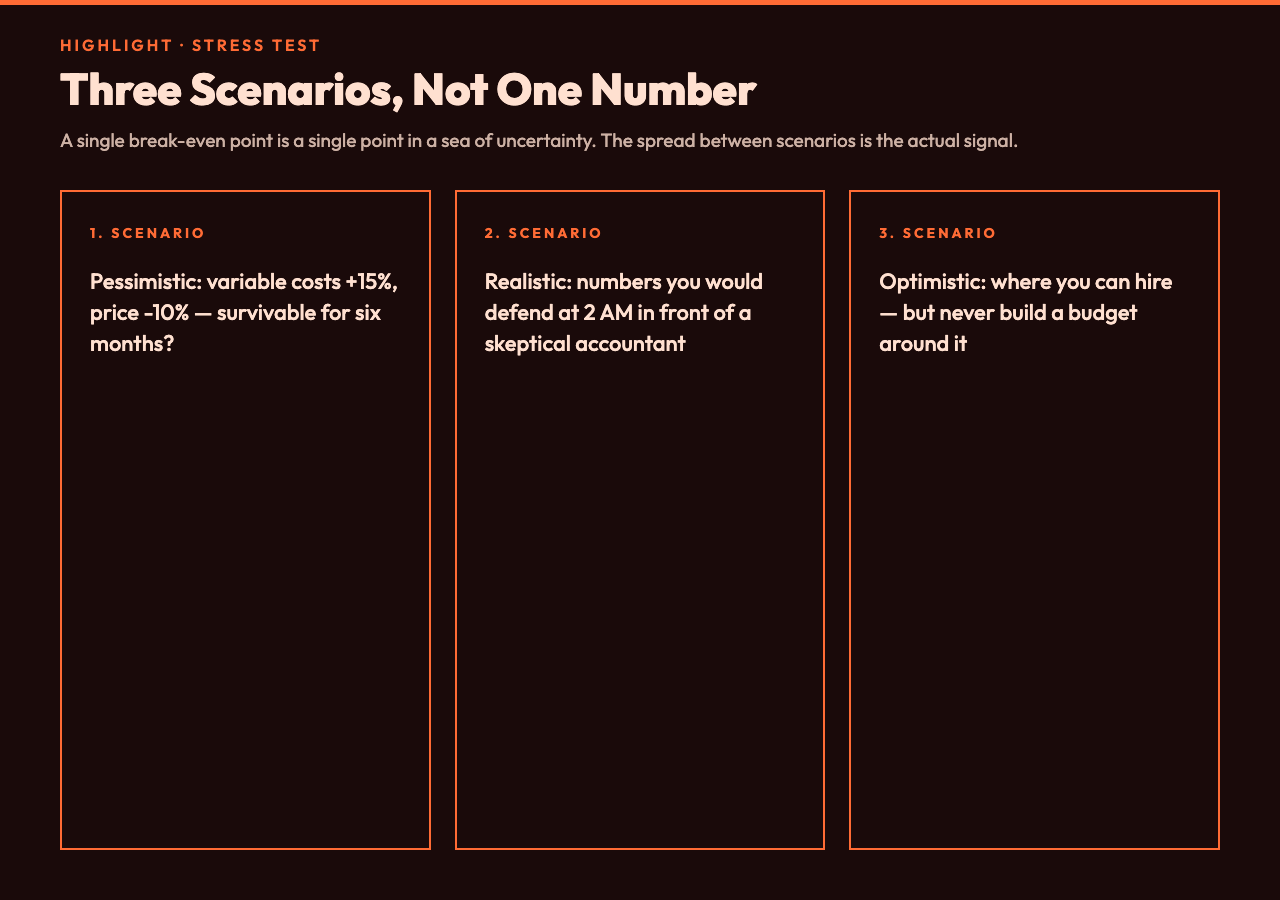
Pessimistic. Raise variable costs by 15% (the realistic case for any business whose suppliers or payment processors raise rates). Lower the price by 10% (the realistic case for any business that faces a competitor undercutting them). Keep fixed costs where they are. The new break-even point is your downside number. If the business cannot survive the pessimistic scenario for at least six months without outside funding, the plan is fragile.
Realistic. The numbers you actually believe in. Not the numbers you hope for. Not the numbers a VC pitch deck assumes. The numbers you would defend in front of a skeptical accountant at 2 AM.
Optimistic. Volume up 25%, price held flat. This is the scenario where you can start hiring the next person or signing the next lease. It is also the scenario you should not build a budget around — optimistic scenarios are how businesses run out of cash in month nine of an eighteen-month plan.
The calculator will produce three numbers, and the spread between them tells you more than any of them individually. If pessimistic and optimistic are within 20% of each other, you have a robust business. If pessimistic is more than double optimistic, you have a forecast built on hope, not data.
The Boundary Cases
Two edge cases deserve their own section because they break the standard formula.
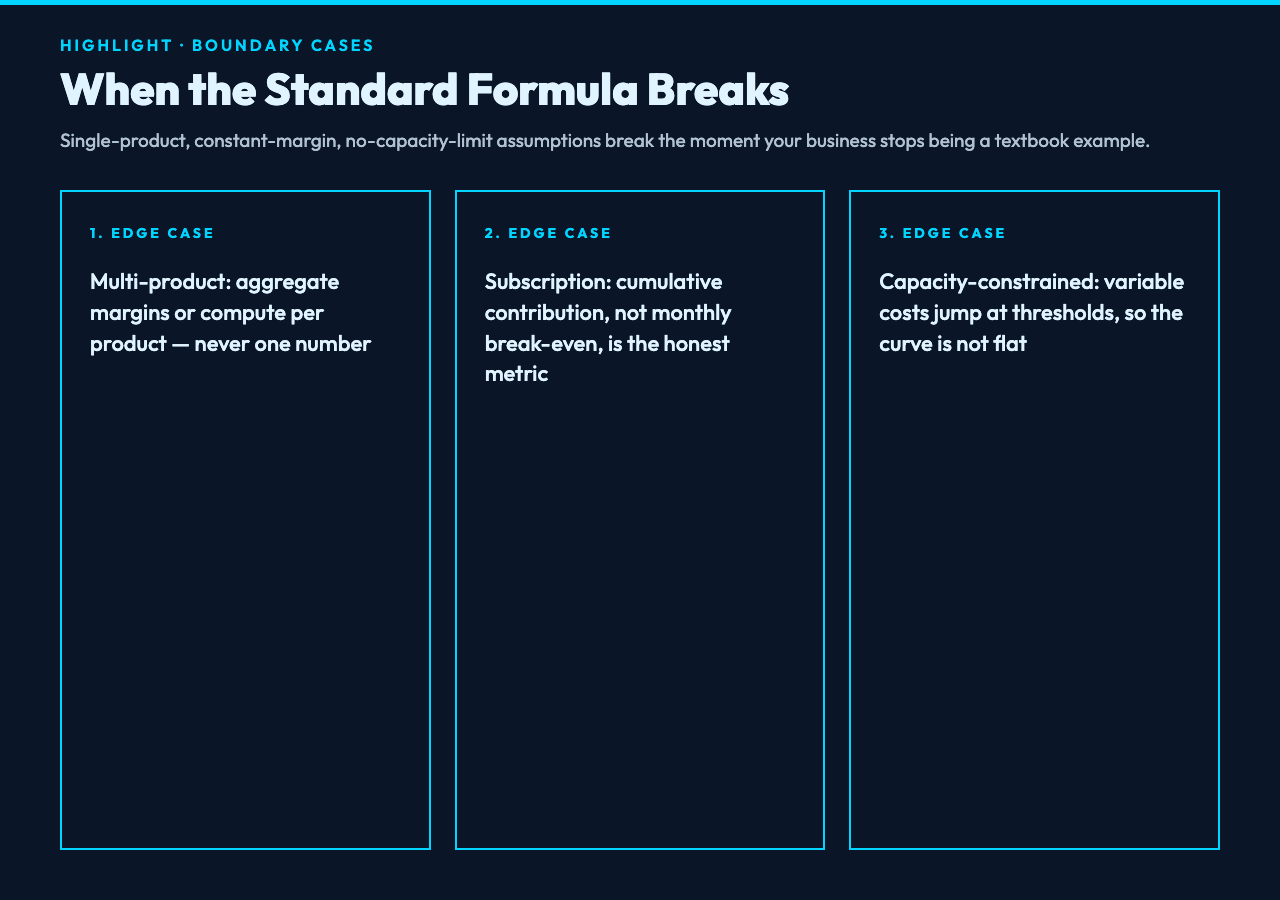
Multi-product businesses. If you sell three products with different margins, a single break-even number is misleading. The right question is: given the existing mix, what is the contribution-weighted average margin, and how many total units do you need? Or, better: hold one product constant and ask what the break-even of the new product is. The calculator is built around a single product, so multi-product analyses require either pre-aggregation or running the calculation per product.
Subscription businesses with retention. A SaaS company with 90% monthly retention does not have a static break-even point. The fixed costs are covered by an accumulating contribution margin from a customer base that decays slowly. The right metric is not break-even per month but break-even on cumulative contribution, including the churn drag. This is why SaaS founders track payback period and LTV/CAC instead of textbook break-even. The calculator is still useful for sanity-checking the unit economics of a single customer, but it does not replace a retention-aware model.
Why the Mental Model Matters More Than the Number
The break-even formula is taught in every introductory finance class. It is also widely used to make decisions it was never designed for. The formula assumes a single product, constant margins, no capacity limits, and a planning horizon that fits comfortably inside the numbers. Real businesses violate one or more of these assumptions constantly.
The mental model behind the formula is more durable than the formula itself: every unit sold contributes some amount toward fixed costs; until the cumulative contribution exceeds fixed costs, the business is not yet profitable, regardless of how much revenue the books show. This is true whether you are selling software, sandwiches, or consulting hours.
The calculator at Elysia Tools gives you a clean way to run the calculation with whatever numbers you believe. The discipline is in deciding which numbers to believe — and updating them as the business moves. A break-even number from six months ago is not the break-even number today, even if the formula has not changed.
If you are early in planning a business, run the calculator three times: once with the numbers a friend would believe, once with the numbers a banker would believe, and once with the numbers your most skeptical advisor would believe. If all three break-even points leave you with a survivable runway, you have a plan. If only the optimistic one works, you have a wish.
A Small Toolkit for the Skeptical Founder
Break-even is one number in a larger financial picture. A few sibling tools at Elysia Tools cover the questions that sit next to it:
For understanding the shape of a distribution before committing to a forecast, the normal distribution calculator is a quick sanity check — particularly useful when you are tempted to assume a smooth growth curve.
For decisions where the question is whether two groups differ by more than chance, the t-test calculator applies the right test without forcing you to remember which version of the formula matches your sample sizes.
For pricing decisions where volume is not linear — bulk discounts, tiered plans, volume rebates — the percentage calculator handles the quick back-of-envelope math without dragging you into a spreadsheet.
For a longer view of how cost structures evolve as a business scales, the amortization schedule calculator is built for fixed-payment loans but applies just as well to fixed-cost runway planning — the same discipline of mapping a fixed obligation against a stream of contributions.
For testing whether a single decision pays off across multiple scenarios, the expected value calculator is a fast way to weight outcomes by probability — useful when the break-even point is realistic but the variance around hitting it is wide.
The Last Calculation
Before you commit to a price, a lease, or a hiring plan, run the numbers through a calculator that will not flatter you. The break-even point you arrive at should be the one that survives your most skeptical self, not the one that makes the pitch deck look good.
The math is simple. The honesty required to feed it good numbers is not. That is the whole job — and the break-even calculator at Elysia Tools is built to make the simple math faster, leaving you more time for the hard honesty. Use it, update it as reality changes, and remember that the formula is a flashlight, not a map.
Explore more tools at elysiatools.com.