
Therapeutic drug monitoring answers one question: did the next dose arrive while the last one was still therapeutic, or did it arrive after the level had already crashed? The trough level estimator (Cmin = Cmax · e^(-kτ)) is the single formula that decides which of those two camps your patient is in — given a measured peak, an elimination half-life, and the dosing interval τ. Every other piece of the TDM workflow (the lab draw time, the timing of the next dose, the target therapeutic window) is a setup decision that this formula resolves. When the math says Cmin falls inside the therapeutic window, you keep the interval. When it falls outside, you shorten τ, switch agents, or escalate to a measured redraw. The tool exists because peak-to-trough math is one of the rare pharmacology calculations where a single exponent is the entire answer and the input errors propagate in the same direction. A 30 percent error in the half-life estimate shows up as a 30 percent error in k, which feeds into the exponent, which is what determines whether the trough drops below the MIC or stays above it. Most TDM decisions start and end with that one computation, and the tool exists so you don’t have to rebuild the exponent each time the lab page loads.
What a trough level is, and why the peak-to-trough drop decides your dosing interval
A trough is the lowest drug concentration in the body between two doses — the floor of the sawtooth curve that one-compartment first-order elimination produces when doses are administered at a fixed interval τ. The peak is the highest concentration, reached shortly after the dose is absorbed and distributed. The peak-to-trough drop is the percentage of the peak that survives until the next dose: (Cmin / Cmax) × 100. For most drugs the therapeutic window is expressed as a peak and a trough band (vancomycin 20–40 mg/L peak, 10–20 mg/L trough; gentamicin 5–10 mg/L peak depending on q8h vs q24h, 1–2 mg/L trough; tobramycin similar). When the predicted trough falls below the trough target, the next dose arrives too late and the patient has spent a measurable window under-dosed — for aminoglycosides that window is the difference between bacterial killing and resistance selection. When the predicted trough climbs above the trough target, the patient is over-dosed and toxicity risk rises (vancomycin nephrotoxicity at sustained troughs > 20 mg/L; aminoglycoside oto- and nephrotoxicity at sustained peaks > 12 mg/L).
The dosing interval τ is the lever you pull to move the trough. Shortening τ raises the trough without changing the peak (much) and lengthening τ drops the trough. The trough-level estimator gives you the predicted Cmin for a given τ without having to wait for the lab — which means you can preview the trough that will occur at the next dose, before the next dose is even given. That preview is the operational value of the tool: it converts the question “is the patient therapeutic?” from “wait for the lab, draw at the right time, hope the result arrives before the next dose” to “run the math on the peak we already have and decide whether to schedule the next dose now, hold it, or change τ.” This is the kind of calculation that fits comfortably on a ward round whiteboard but is hard to do in your head when τ is in hours, k is in per-hour, and the exponent is non-trivial.
Why one-compartment first-order elimination is the canonical model (and when it breaks)
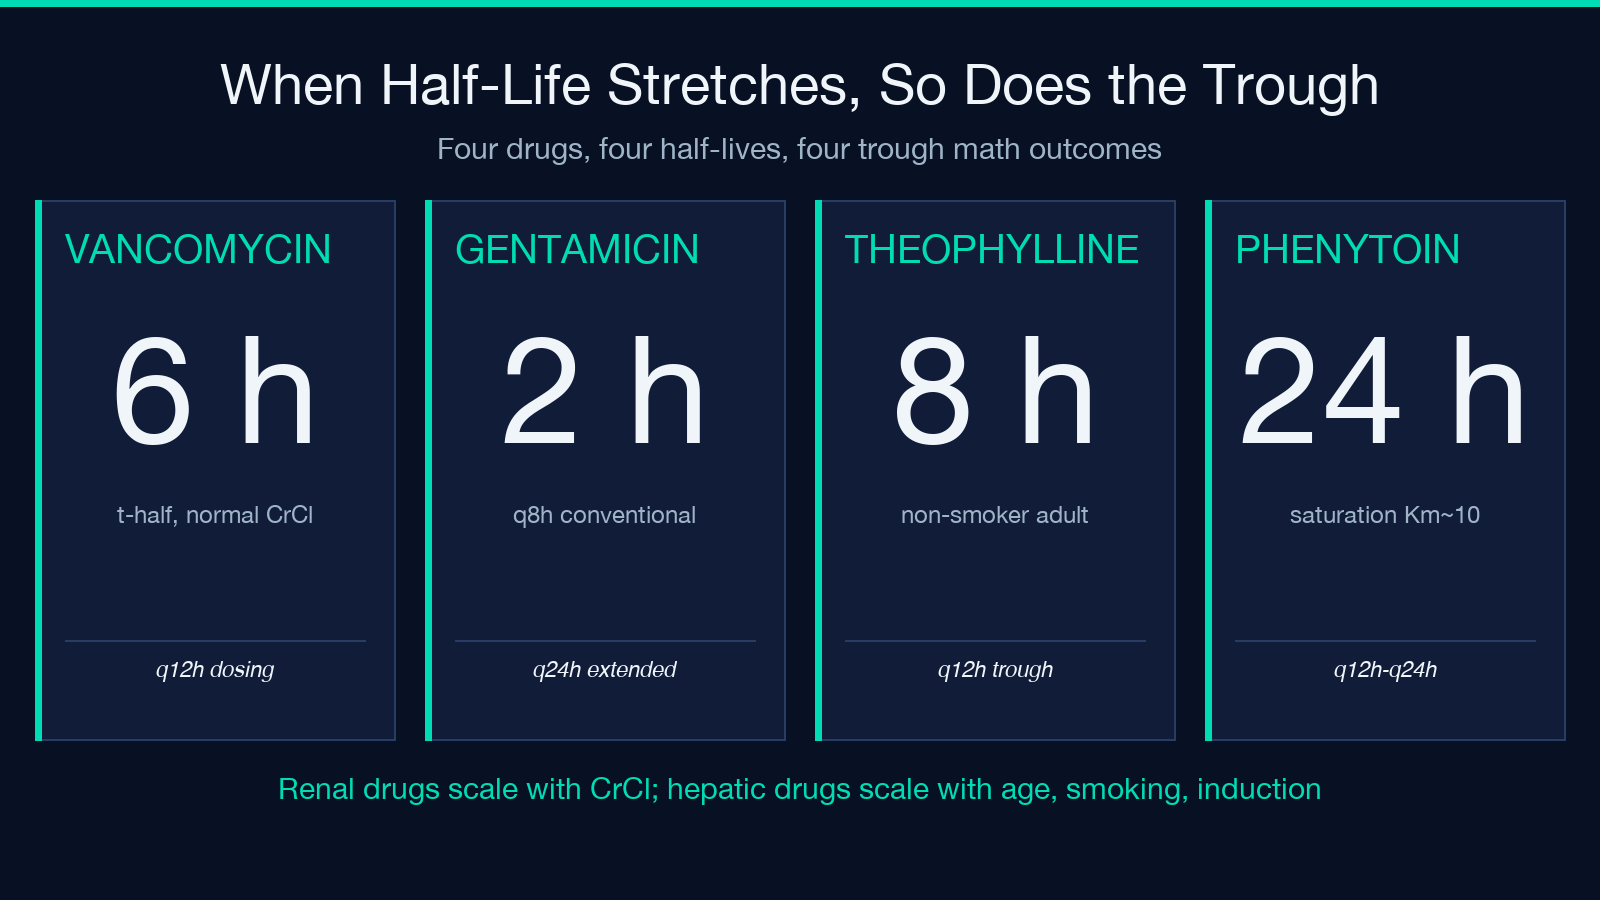
The trough-level estimator assumes one-compartment first-order elimination: the drug distributes instantaneously into a single volume Vd, and the elimination rate is proportional to the concentration at every moment. That gives the exponential decay C(t) = Cmax · e^(-kt), and the trough at time τ is Cmin = Cmax · e^(-kτ). One-compartment is a reasonable model for drugs that distribute quickly (aminoglycosides distribute in 30–60 min; vancomycin in 30–60 min for most adults) and are eliminated by a single first-order pathway (renal for aminoglycosides and vancomycin; hepatic for theophylline in non-smokers). It is a poor model for drugs with multi-compartment distribution (theophylline is actually two-compartment in some patients, and digoxin has a long distribution phase) or with saturable elimination (phenytoin switches from first-order to zero-order above its Km, which is roughly 10 mg/L in most patients — exactly the trough target). When the drug fits the one-compartment assumption, the tool’s prediction is reliable to within 5–10% of the measured trough. When it doesn’t fit (saturable elimination, distribution phase, active metabolite), the predicted trough can be 30–50% off — and the estimator will still return a number, which is the dangerous case. Use the result as a starting hypothesis, not as a final answer, when the pharmacokinetics are known to deviate from the canonical model.
The estimator also assumes the peak was measured after distribution was complete. If the lab draw happened during the distribution phase (vancomycin drawn at 30 min instead of 60 min after the end of the infusion), the measured “peak” is actually the sum of the distribution peak and the post-distribution plateau, and the estimated k will be artificially low. The trough will then be predicted higher than it actually is. This is the most common cause of “the estimator said therapeutic but the measured trough came back sub-therapeutic”: the peak was drawn too early. Most TDM protocols specify a peak draw at 60 min after a 60-min vancomycin infusion (or 30 min after a 30-min infusion); the calculator trusts that protocol and does not validate it.
The half-life-to-k conversion: k = ln2 / t½ (and why ln2 matters, not 0.693)
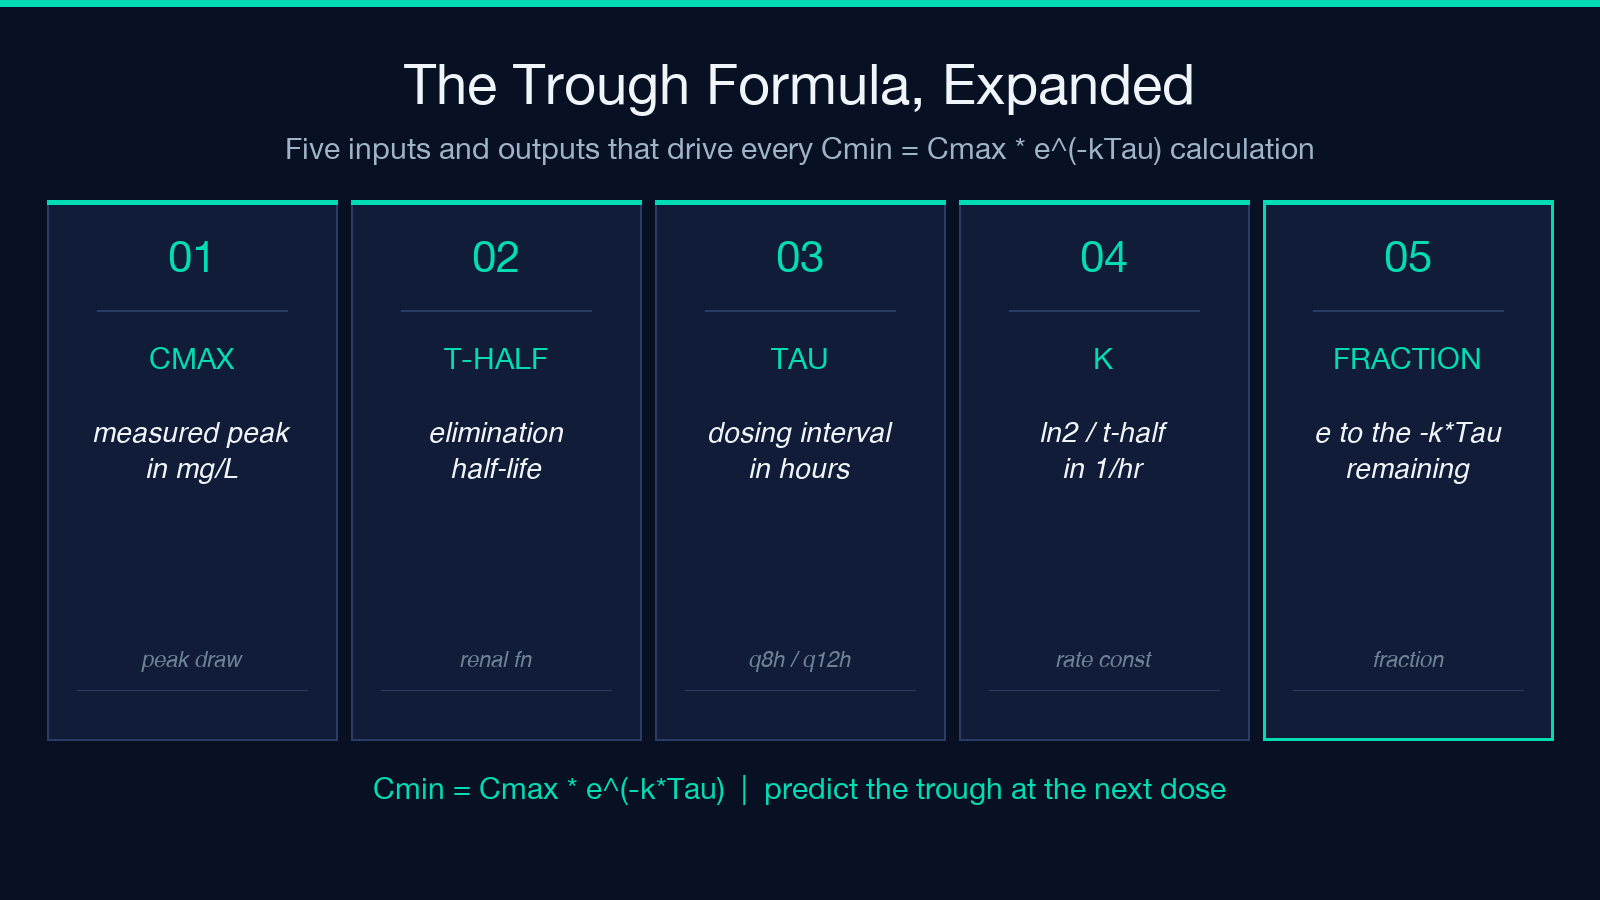
The elimination rate constant k is the per-hour fraction of the drug removed. It is connected to the half-life t½ by k = ln2 / t½. ln2 ≈ 0.693, but the conversion uses ln2, not 0.693, because the half-life is the time at which the concentration has dropped to 50% — not the time at which 50% of the drug has been removed. The two are related by an exponential, and the exponential function e^x uses the natural log base. A common calculator mistake is to use 0.693 directly as k (treating it as a percentage rather than a rate). For vancomycin with t½ = 6 h, k = 0.693 / 6 = 0.1155 per hour. If you instead used 0.693 as k directly (a ten-fold error), the trough at τ = 12 h would be predicted at Cmax · e^(-0.693 × 12) = Cmax · e^(-8.32), which is roughly 0.024% of the peak — off by a factor of ~100 from the correct answer (which is Cmax · e^(-1.386) = Cmax · 0.250, or 25% of the peak). The estimator does the conversion correctly, but it relies on the half-life you enter. The half-life is itself a function of the patient’s renal function (aminoglycosides, vancomycin), hepatic function (theophylline, phenytoin), age (theophylline t½ doubles in elderly smokers), and body composition (aminoglycoside Vd is larger in obese patients, and t½ is shorter when Vd is large for the same clearance). A measured trough is the cleanest input, but a measured half-life requires two peak/trough pairs and is rarely available — so the input is usually a population estimate (e.g. “vancomycin t½ = 6 h in a patient with CrCl 80 mL/min”) that the clinician adjusts based on the patient’s renal function and history.
For drugs with renal elimination, the half-life scales with creatinine clearance: t½ ≈ 0.693 · Vd / CL, and CL scales roughly linearly with CrCl (for drugs that are eliminated unchanged by the kidney, like aminoglycosides and vancomycin). For a patient in AKI with CrCl < 20 mL/min, the vancomycin half-life can stretch to 40–70 h — which means a once-weekly dose would still leave substantial drug in the body a week later. The estimator handles this correctly as long as the half-life input is correct; the trap is using a “normal” t½ for a patient whose renal function is not normal.
The peak-to-trough math: Cmin = Cmax · e^(-kτ)
The trough concentration is the peak concentration multiplied by the exponential decay e^(-kτ). For a drug with k = 0.1155 /h (t½ = 6 h) and a dosing interval τ = 12 h, the decay factor is e^(-0.1155 × 12) = e^(-1.386) = 0.250. The trough is therefore 25% of the peak. For vancomycin peak 28 mg/L, the predicted trough is 28 · 0.250 = 7.0 mg/L. If the trough target is 10–20 mg/L, this prediction is below the trough target — the interval is too long, or the dose is too low. The estimator reports both the absolute trough (7.0 mg/L) and the fraction of the peak remaining (25%), and the peak-to-trough drop (75%). The fraction is useful because it tells you the shape of the decay independent of the absolute concentration: a drug at 75% drop has a much narrower therapeutic window than one at 25% drop, even if both have similar trough-to-peak ratios.
The exponential is also what makes the dosing interval non-linear. Halving τ from 12 h to 6 h does not double the trough; it raises the trough by a factor of e^(kτ) (since the new trough is Cmax · e^(-kτ/2) and the old trough is Cmax · e^(-kτ); the ratio is e^(kτ/2)). For k = 0.1155 /h, going from τ = 12 to τ = 6 h raises the trough by e^(0.693) = 2.0 — exactly doubling it (because τ/2 = t½ means the trough is at exactly half-life, which is by definition 50% of the peak). For τ = 8 h to τ = 4 h, the ratio is e^(0.462) = 1.59 — a 59% increase, not a 100% increase. The non-linearity matters when you are tuning an interval: the closer τ is to the half-life, the more sensitive the trough is to interval changes.
Worked example: vancomycin peak 28 mg/L, t½ 6 h, dosing interval q12h
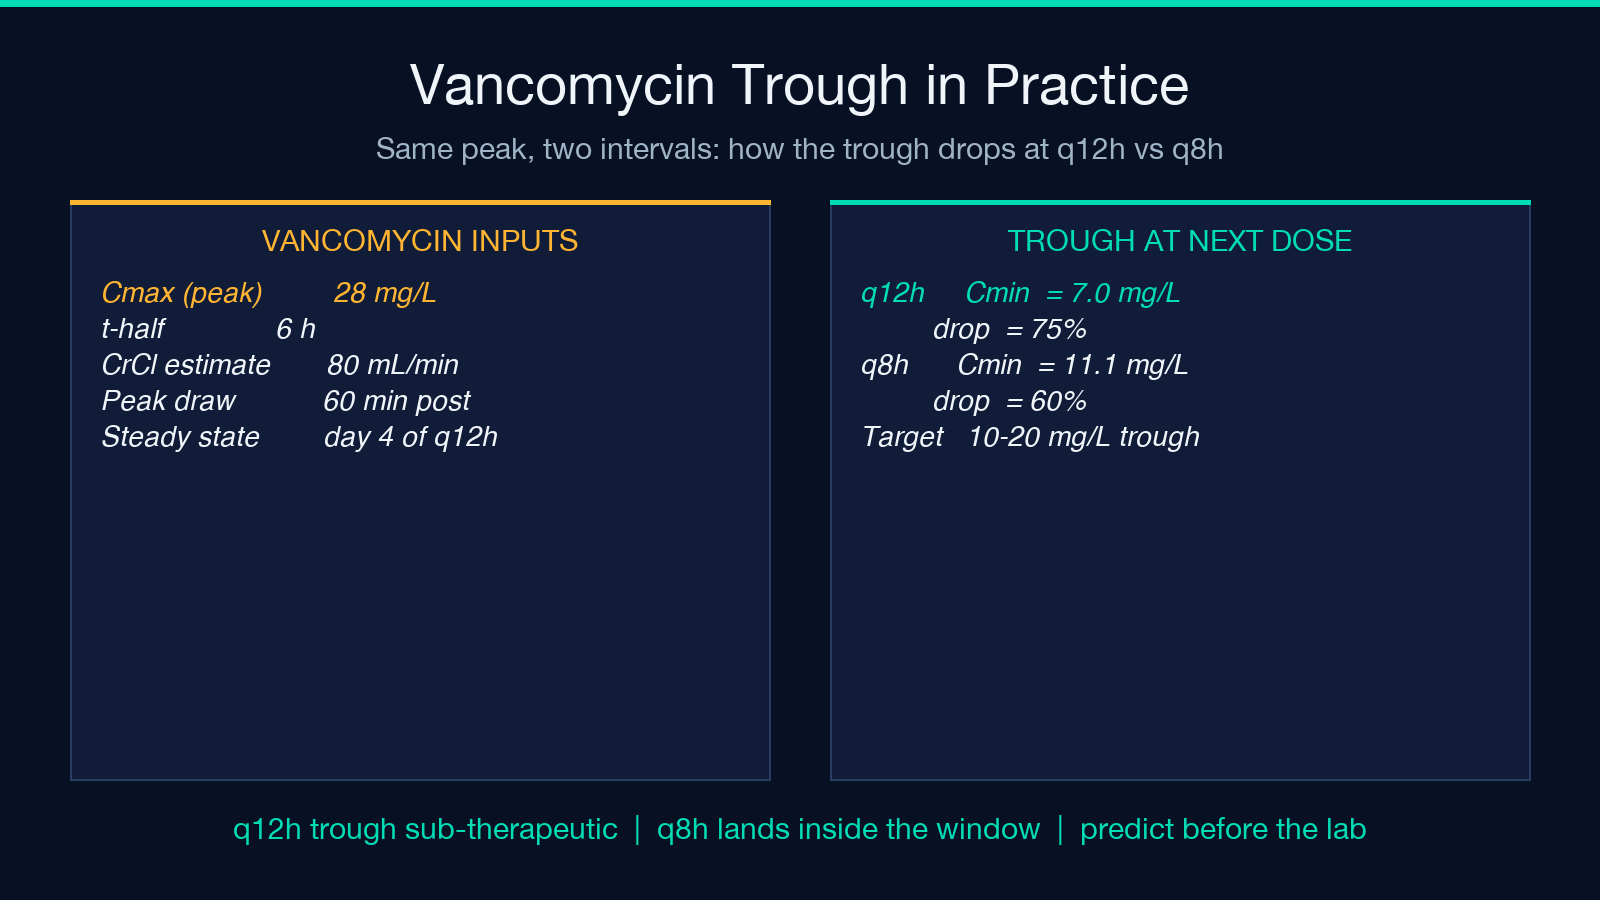
Vancomycin is the canonical TDM drug: narrow therapeutic window, renal elimination, one-compartment distribution, and a well-characterized peak and trough target. Suppose the patient has been on vancomycin 1 g q12h for four days (steady state reached), the peak was measured at 28 mg/L (drawn 60 min after the end of a 60-min infusion), and the patient’s renal function suggests t½ = 6 h. The calculator input is Cmax = 28 mg/L, t½ = 6 h, τ = 12 h. The rate constant k = 0.693 / 6 = 0.1155 /h. The decay factor e^(-kτ) = e^(-0.1155 × 12) = e^(-1.386) = 0.2500. The predicted trough Cmin = 28 · 0.250 = 7.0 mg/L. The fraction of the peak remaining is 25.0%; the peak-to-trough drop is 75.0%.
The trough target for vancomycin is 10–20 mg/L (for complicated infections like endocarditis, osteomyelitis, or MRSA bacteremia; 15–20 mg/L for severe infections; 10–15 mg/L for uncomplicated infections). 7.0 mg/L is below the trough target — the patient is sub-therapeutic at the next dose. Options: shorten τ (q8h would raise the trough to 28 · e^(-0.1155 × 8) = 28 · 0.398 = 11.1 mg/L, inside the target band), raise the dose (1.5 g q12h would raise both peak and trough proportionally), or confirm with a measured trough before changing the regimen. The estimator surfaces all three numbers — predicted trough, fraction remaining, peak-to-trough drop — so the clinician can compare against the therapeutic window without redoing the exponent.
The same calculation for gentamicin: peak 8 mg/L, t½ 2 h (typical for normal renal function), τ = 8 h (extended-interval dosing). k = 0.693 / 2 = 0.347 /h. Decay e^(-0.347 × 8) = e^(-2.77) = 0.0625. Predicted trough = 8 · 0.0625 = 0.50 mg/L. The trough target for extended-interval gentamicin is < 1 mg/L (sometimes < 0.5 mg/L), so 0.50 mg/L is at the boundary — borderline acceptable, but a redraw at 8 h post-dose would confirm. The estimator lets you preview the trough before waiting for the lab result, which is the operational advantage when the dose is being given on a q24h schedule.
When the estimator agrees with measured Cmin, and when it diverges
The estimator agrees with measured Cmin (within 10–15%) when: the half-life estimate is accurate for the patient, the peak was drawn post-distribution, the patient is at steady-state (typically after 3–5 half-lives), and renal/hepatic function has not changed since the peak was measured. It diverges from measured Cmin when: the half-life was mis-estimated (AKI developing during the course, hepatic function changing, drug interaction altering clearance), the peak was drawn too early (distribution phase), the patient is not at steady-state (just-started regimen), or the drug’s pharmacokinetics do not fit one-compartment first-order elimination (saturable elimination, multi-compartment distribution).
A divergence between predicted and measured trough is itself a signal: it tells you something about the patient’s pharmacokinetics that the population estimate did not capture. If the predicted trough is 7 mg/L and the measured trough comes back at 4 mg/L, the patient’s actual half-life is longer than the input value (they’re clearing the drug faster than expected — possibly because the Vd is smaller than the population average, or the clearance is higher than the CrCl estimate suggested). The next step is to re-estimate t½ from the measured trough and the timing, and feed the new value back into the estimator. The tool does not do this loop automatically; the clinician is the one who decides when to update the half-life and re-run the calculation.
For drugs with active metabolites that contribute to the effect (morphine-6-glucuronide, normeperidine, N-acetylprocainamide), the estimator’s prediction can be clinically misleading because the “trough” of the parent drug does not equal the trough of the active moiety. The estimator is designed for the parent drug, and the metabolite contribution has to be assessed separately.
What the fraction-of-peak and peak-to-trough drop tell you about your dosing window
The fraction of the peak remaining at the trough is the shape of the decay, normalized to the peak. A fraction of 0.25 (75% drop) means the patient loses three-quarters of their peak concentration between doses — a wide therapeutic band, but a narrow safety margin on the low end. A fraction of 0.50 (50% drop) means the patient loses half — a moderate band, common for drugs with intermediate half-lives. A fraction of 0.75 (25% drop) means the patient loses only a quarter, common for drugs dosed at or below their half-life.
For aminoglycosides, the fraction is the primary indicator of whether the trough is in the right place. Extended-interval gentamicin (q24h, sometimes q48h for normal renal function) is designed around a fraction of 0.05–0.10 — the trough should be at most 10% of the peak. Conventional dosing (q8h) is designed around a fraction of 0.25–0.50 — the trough should be at most half the peak. The estimator’s fraction output lets you see at a glance which dosing strategy you’re running without having to compare against a memorized table.
For vancomycin, the fraction tells you whether your τ is appropriate relative to the half-life. If the fraction is 0.50, you’re dosing at exactly the half-life — typical for vancomycin q12h in patients with normal renal function. If the fraction is 0.10, you’re dosing at ~3.3 half-lives — typical for q24h dosing in patients with impaired renal function. The estimator doesn’t recommend a target fraction; it just reports it, and the clinician interprets it in light of the drug and the patient. The peak-to-trough drop (the complement, 1 – fraction) is the same number expressed as a percentage loss, which is sometimes easier to communicate in writing: “75% drop” sounds more dramatic than “25% remaining,” even though they describe the same decay.
How the tool fits between drug-half-life-dose and dosing-interval-designer
The trough-level estimator is one of three TDM tools on Elysia Tools, and its position in the workflow is specific: it takes a measured peak (not a dose and volume) and predicts the trough that will occur at the next dose. This is different from drug-half-life-dose, which derives the initial concentration C0 from Dose and Vd (the loading-dose workflow), and from dosing-interval-designer, which outputs a dimensionless peak/trough ratio without anchoring to an absolute concentration. The trough-level estimator is the only one of the three that answers “given the peak we measured this morning, what will the trough be at the next dose?” — the operational question that decides whether to keep the interval, shorten it, or redraw.
For a fuller walkthrough of the formula and its edge cases, the Trough Level Estimator on Elysia Tools accepts the three inputs (Cmax, t½, τ) and returns Cmin, the fraction of peak remaining, and the peak-to-trough drop. Run it on the next peak before scheduling the next dose, and you’ll know whether the trough will land in the therapeutic window or whether the interval needs to be tuned. For the broader steady-state math (Css,max and Css,min from Dose / CL × τ), Steady State Concentration handles the population-average prediction, and Drug Half-Life Dose covers the loading-dose workflow when no measured peak is available yet.
This tool is not medical advice. Predicted troughs are starting hypotheses; for dosing changes with a narrow therapeutic window or a critically ill patient, confirm with a measured trough before changing the regimen.
Explore more tools at elysiatools.com.
