
A TSH of 5.8 on its own looks like hypothyroidism. Read alongside a normal FT4, and the picture flips to subclinical disease — or to nothing at all.
Endocrinology labs are full of patients whose “thyroid problem” is a single number drifting outside a range that has been wrong about 5% of the population for decades. A TSH of 5.4 mIU/L with FT4 sitting at 1.1 ng/dL is not the same disorder as the same TSH with FT4 at 0.6 — but most lab-result emails cannot tell them apart, and most result-reading dashboards show one number at a time as if it lived alone. The Thyroid Index tool on Elysia Tools pattern-matches the three hormones against the standard reference grid and labels the case the way an endocrinologist would on rounds.
What the thyroid axis actually is
TSH is not a thyroid hormone. It is a pituitary signal that tells the thyroid how hard to work, and the feedback loop between TSH, free T4, and free T3 is what makes the system a system rather than a three-number display. Free T4 is the bulk output — about 80% of what the thyroid makes — and free T3 is the active fraction that drives metabolism in tissue. Most “thyroid tests” only order TSH, and that single number is interpreted against a population reference range that was calibrated on a relatively iodine-replete cohort.
This matters because TSH is a noisier signal than people think. It has a 30–50% diurnal swing, peaks between midnight and 4 AM, and is suppressed by dopamine, glucocorticoids, severe illness, and pregnancy. A “mildly elevated” TSH drawn at 9 AM after a stressful week of poor sleep is not the same clinical signal as the same number drawn under controlled conditions. Reference ranges that present a single cut-off hide this entirely.
Why the pattern matters more than the number
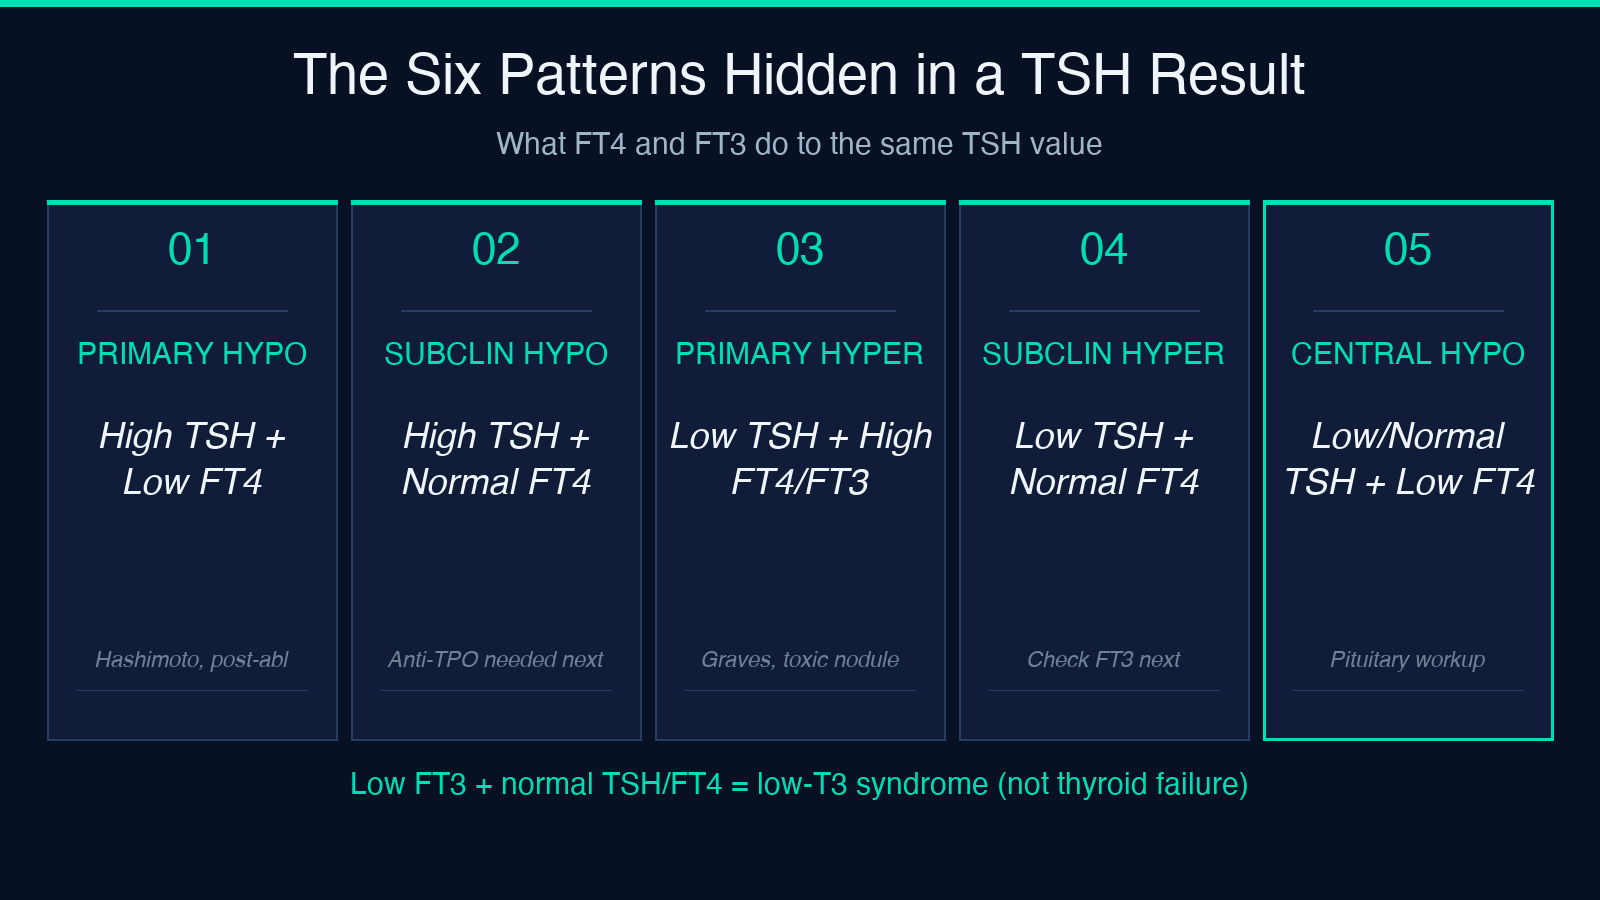
The five canonical patterns are how a thyroid workup is actually read. Each pattern has a different cause list and a different next step:
- High TSH + low FT4 → overt primary hypothyroidism (Hashimoto, post-ablative, severe iodine deficiency, drug-induced from amiodarone or lithium).
- High TSH + normal FT4 → subclinical hypothyroidism; the question becomes antibody status and trend, not treatment urgency.
- Low TSH + high FT4 or FT3 → overt primary hyperthyroidism (Graves, toxic adenoma, early thyroiditis, iodine-induced).
- Low TSH + normal FT4 → subclinical hyperthyroidism, exogenous hormone, or resolving thyroiditis — the FT3 is what discriminates.
- Low or normal TSH + low FT4 → central (secondary or tertiary) hypothyroidism, which is pituitary- or hypothalamic-axis failure, not thyroid failure.
A sixth pattern — low FT3 with normal TSH and normal FT4 — is the low-T3 syndrome seen in critical illness, fasting, and severe systemic stress. It is not a thyroid disorder; it is the body’s downregulation of peripheral T4-to-T3 conversion under load.
The unit traps that make results look ten times off
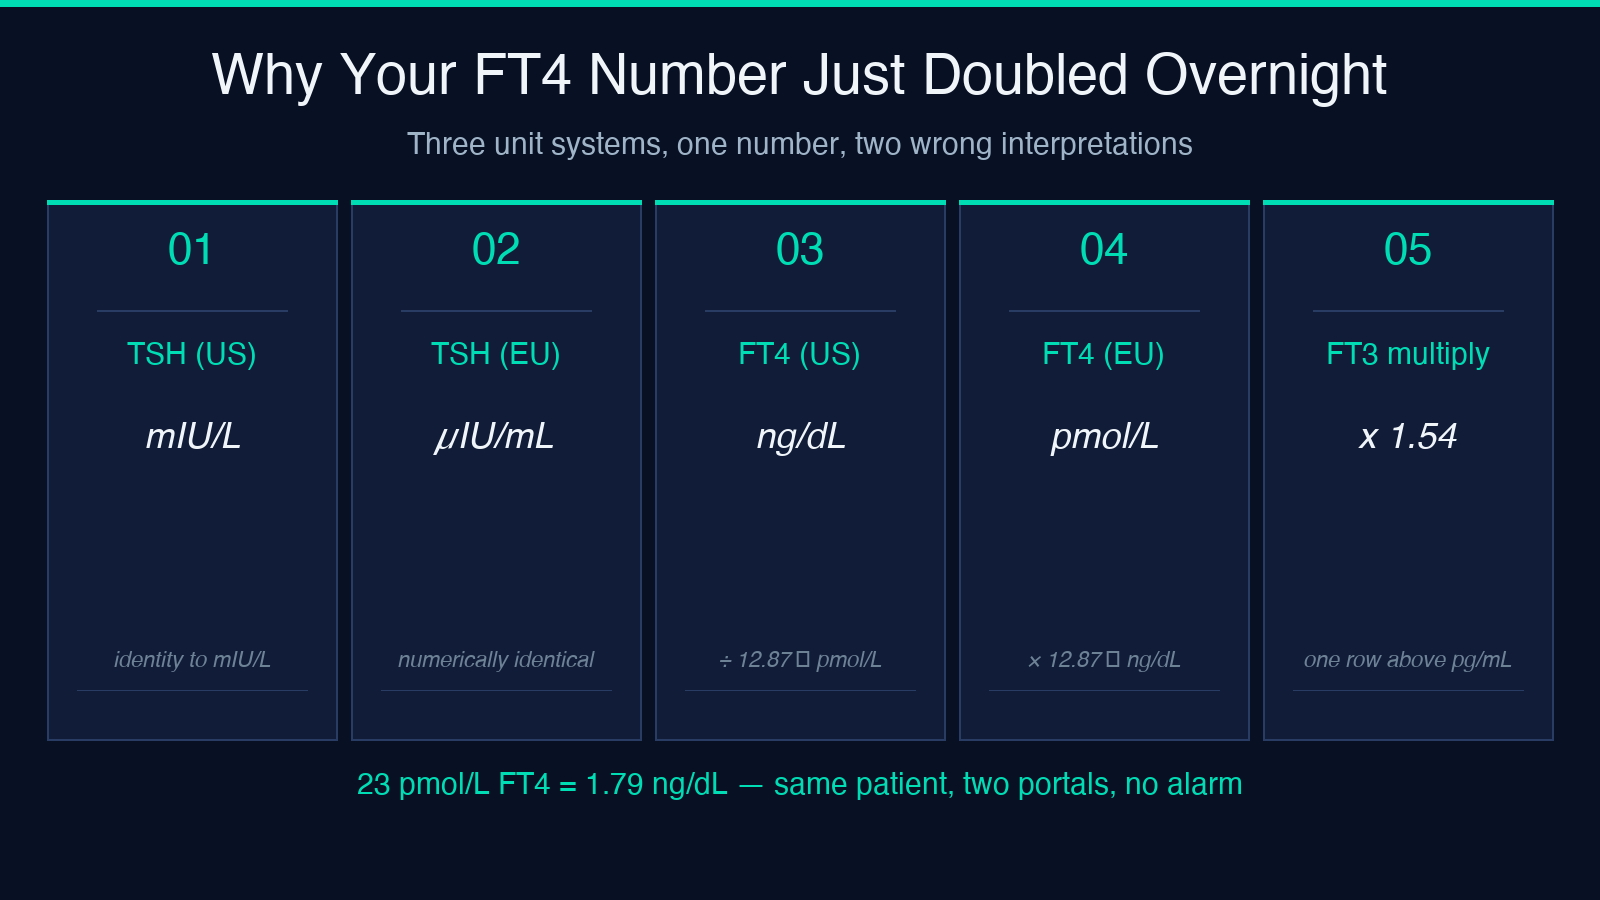
The same lab can report TSH in mIU/L or µIU/mL (numerically identical, just spelled differently across countries), FT4 in ng/dL or pmol/L (factor of ≈12.87 apart), and FT3 in pg/mL or pmol/L (factor of ≈1.54 apart). A patient whose portal shows FT4 of 23 and the same patient’s chart shows FT4 of 1.8 are the same number — the second is just in pmol/L.
This is not a stylistic difference. It is the single most common reason patients email their endocrinologist convinced their numbers are “ten times worse than last time.” The Thyroid Index tool lets you pick the unit on each input so the comparison happens in the same frame. When the source is a printout, the layout is usually a giveaway: ng/dL and pg/mL are typical for US labs; pmol/L is typical for UK, EU, and most Asian labs.
Subclinical disease is a judgment, not a cut-off
“Subclinical hypothyroidism” is defined as elevated TSH with normal FT4 in an asymptomatic patient. That sounds mechanical — a cut-off, a label. In practice, the cut-off itself moves. ATA guidance lowered the upper limit of normal TSH from 4.5 to 4.0 mIU/L (and the lower limit of subclinical hypothyroidism to 2.5 for some populations) because the older cut-off produced too many false-positive levothyroxine starts in older adults.
The clinical move is not to chase the cut-off. It is to ask three things: are thyroid peroxidase antibodies positive (which predicts progression to overt disease in subclinical hypothyroidism), is the trend rising across serial draws, and what is the patient’s symptomatic baseline? Two of those three need historical data the pattern alone cannot see — but the index can tell you which pattern you are looking at, so the next test is the right test.
Why a single morning TSH is not enough
The 30–50% diurnal TSH swing means a single draw understates how high TSH can go overnight and overstates it after a suppressed day. Most reference ranges were drawn from morning fasting samples, so an afternoon TSH of 3.8 is “in range” while the same patient’s overnight peak could be 5.5 — crossing the line that the lab considers worth investigating.
The pattern-based reading partly absorbs this, because FT4 has a much smaller diurnal swing than TSH and is the anchor for “is this real thyroid failure or a noisy signal.” When TSH and FT4 disagree, the index labels the case as the more conservative one and the next move is a paired draw on a controlled morning plus antibody testing, not an immediate treatment decision.
The clinical moves that change management
Two patterns flip management entirely when recognized:
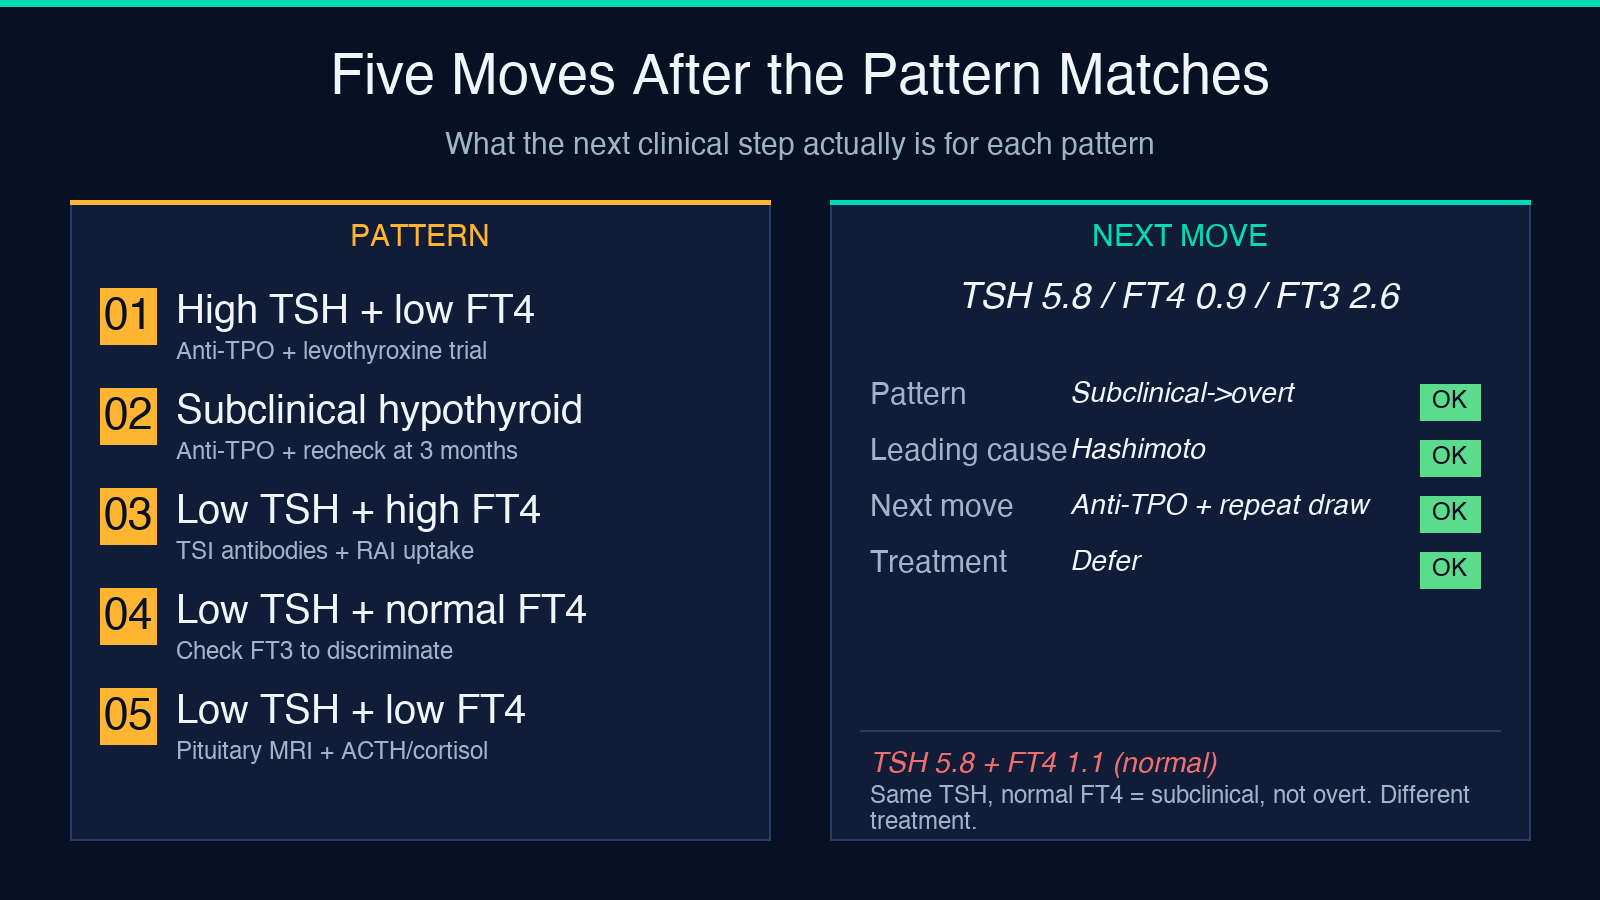
- Low or normal TSH + low FT4 is central hypothyroidism, not primary. Treating with levothyroxine replacement is fine, but the workup now has to look at the pituitary (MRI, ACTH, cortisol, gonadal axis). Missing this pattern is the most common cause of “thyroid medication that isn’t working.”
- High TSH + high FT4 is rare and suggests a TSH-secreting pituitary adenoma or thyroid hormone resistance — both of which need endocrinology referral rather than the primary-care reflex of “increase the levothyroxine dose.”
Most calculators that show only TSH return “low / normal / high” tags. The index returns the named pattern, the most likely cause family, and the next-workup direction, which is what changes whether the patient gets started on medication, referred for antibody testing, or sent for pituitary imaging.
The broader lesson: pattern over single number
The trap here is not thyroid-specific. Most lab values that get reported to a patient one at a time behave this way: corrected calcium needs albumin, LDL-C needs triglycerides and HDL, anion gap needs electrolytes in the same panel, eGFR needs creatinine plus age and sex. Single-number readouts are a UX failure that survives because they were simpler to print before result portals were interactive. Pattern-reading calculators exist across every clinical domain for exactly this reason.
When you have three numbers that interact, the “low / normal / high” tag for each one is a less informative answer than the named pattern across the three of them. That is what makes a tool that maps TSH × FT4 × FT3 onto clinical patterns genuinely different from the lab portal’s three-color-coded rows.
Try it against a real case
Take a 42-year-old on no medication with TSH 5.8 mIU/L, FT4 0.9 ng/dL, FT3 2.6 pg/mL, plus vague fatigue. The index labels this subclinical-to-overt borderline with Hashimoto as the leading cause — meaning the next move is anti-TPO antibody testing plus a second draw, not levothyroxine. The same TSH with FT4 0.6 ng/dL returns overt primary hypothyroidism, and the next move is treatment consideration.
The calculator is free at the Thyroid Index tool page and accepts all three unit conventions. For other calculators that share this pattern-reading approach across the lab-medicine spectrum — from corrected calcium to LDL-C to QTc — see the full tool index at elysiatools.com.
The single number is rarely the answer. The pattern almost always is.
