# 7 Free Interactive Physics Visualizations That Make Abstract Concepts Actually Click
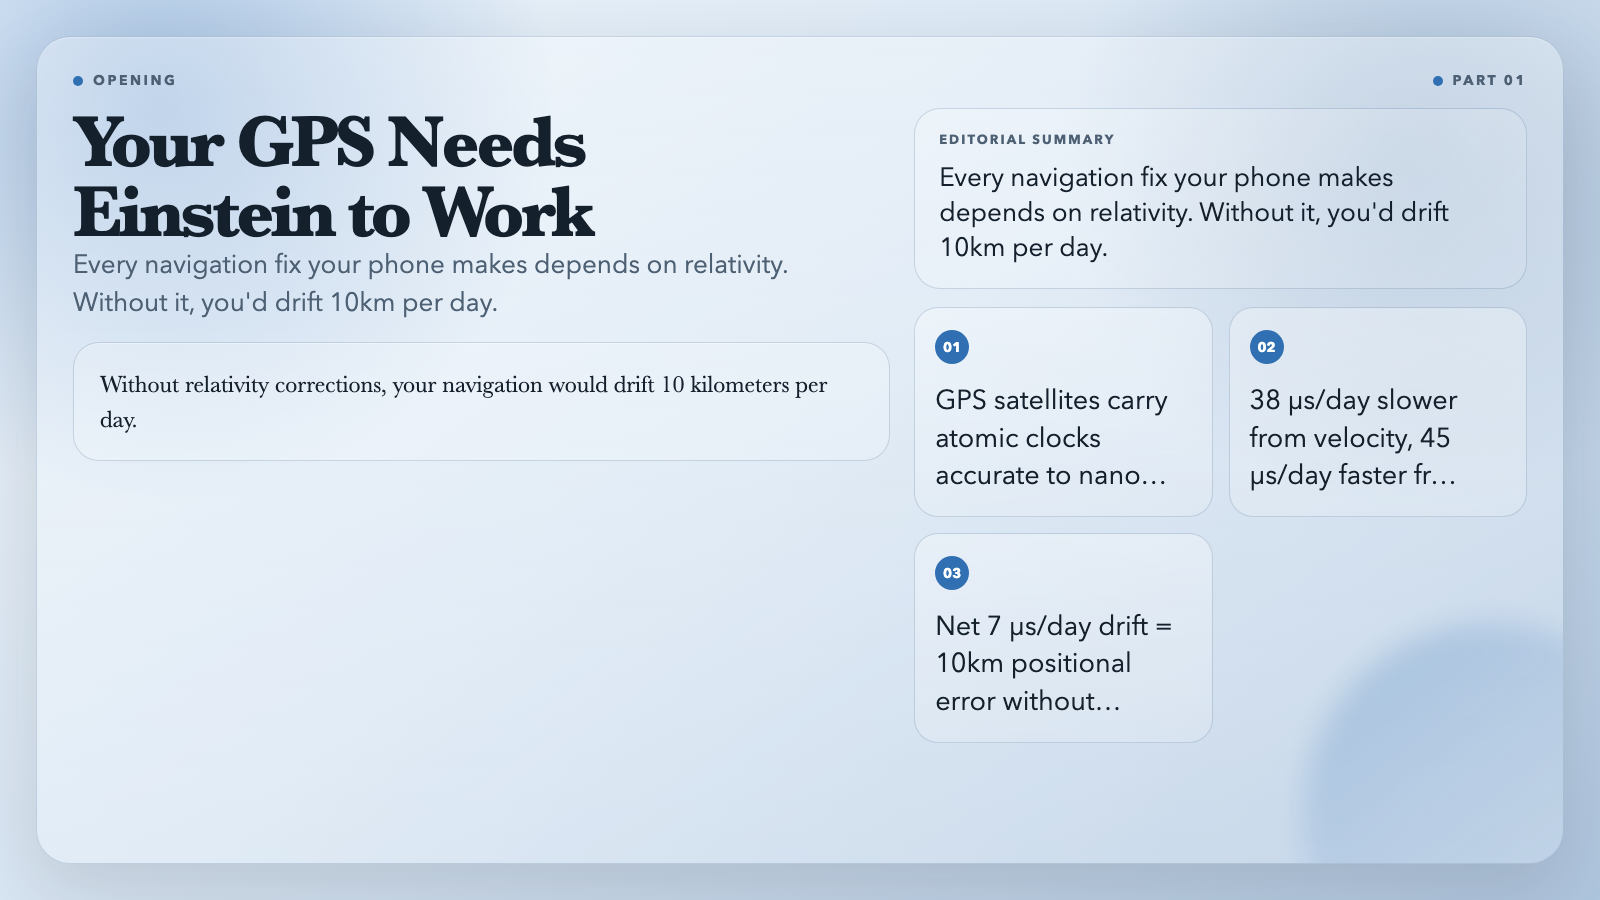
Your phone’s GPS system depends on Einstein’s theory of relativity to pinpoint your location. The satellites run atomic clocks accurate to nanoseconds. Without relativity corrections, your navigation would drift 10 kilometers per day.
Most people can’t explain why. The math is in every textbook. The intuition isn’t—until now.
1. The Photoelectric Effect — Where Light Became a Particle
In 1905, Einstein published four papers. The one on the photoelectric effect won the Nobel Prize.
Here’s the experiment: shine light on a metal plate and electrons fly off—but only if the frequency crosses a threshold. Turn up the brightness with red light as much as you want, and nothing happens. A faint flash of violet light and electrons eject immediately. Wave theory predicts energy should increase with intensity. Reality disagrees.
Einstein’s explanation: light comes in discrete packets called photons, each with energy E = hf. The Photoelectric Effect visualization lets you dial wavelength and intensity and watch the I-V curve respond. You see the cutoff voltage hold steady as you increase brightness, then shift the moment you switch from green to violet. The experiment that birthed quantum mechanics becomes viscerally clear.
This is also how solar cells work. Every rooftop panel applies Einstein’s 1905 paper to generate electricity.
2. Time Dilation — Why Your GPS Needs Relativity
GPS satellites orbit at 20,200 km altitude, moving at 3.9 km/s. Two relativistic effects act simultaneously: velocity slows their clocks by 38 microseconds per day, while weaker gravity speeds them up by 45 microseconds per day. The net drift is 7 microseconds daily. Without correction, your navigation accumulates 10 kilometers of error within 24 hours.
This is engineering, not speculation.
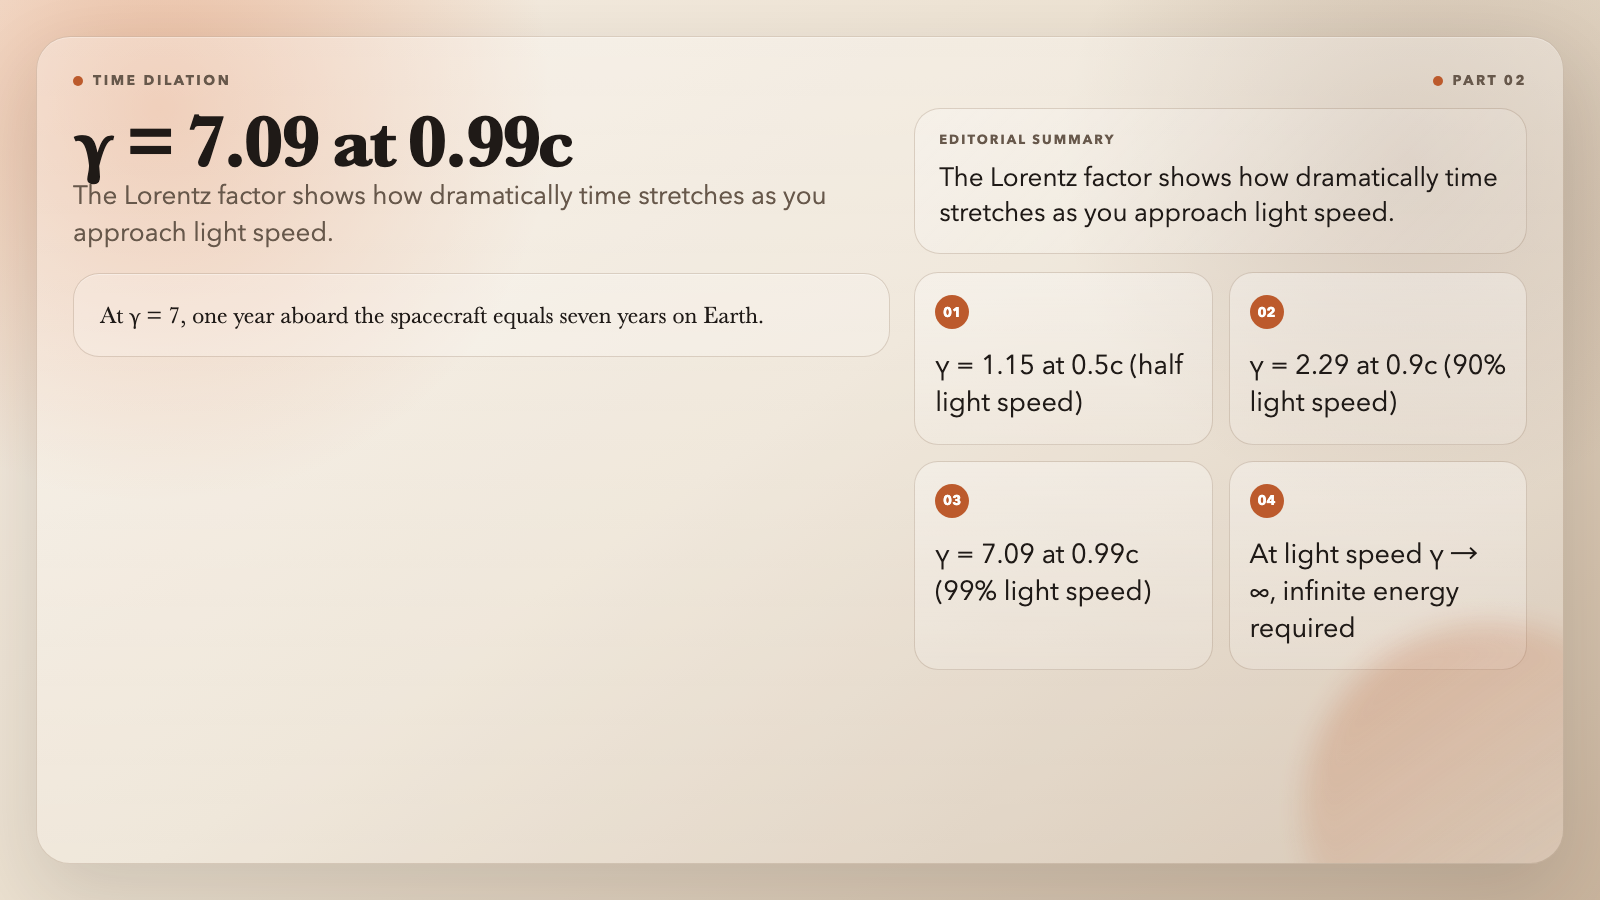
The Time Dilation visualization demonstrates this through Einstein’s light clock thought experiment. A photon bounces between two mirrors. From a stationary observer’s view, the moving clock’s photon travels diagonally—longer path, same speed—so each tick takes longer. Drag the velocity slider and watch the Lorentz factor γ climb: 1.15 at half light speed, 2.29 at 0.9c, 7.09 at 0.99c.
At γ = 7, one year aboard the spacecraft equals seven years on Earth. Relativistic time travel is arithmetic.
3. The Double Slit Experiment — When Observation Changes Reality
Fire electrons one by one through two narrow slits. Each electron arrives at the screen as a single dot—a particle. But after hundreds of electrons accumulate, those dots form bands: an interference pattern, as if each electron passed through both slits simultaneously and interfered with itself.
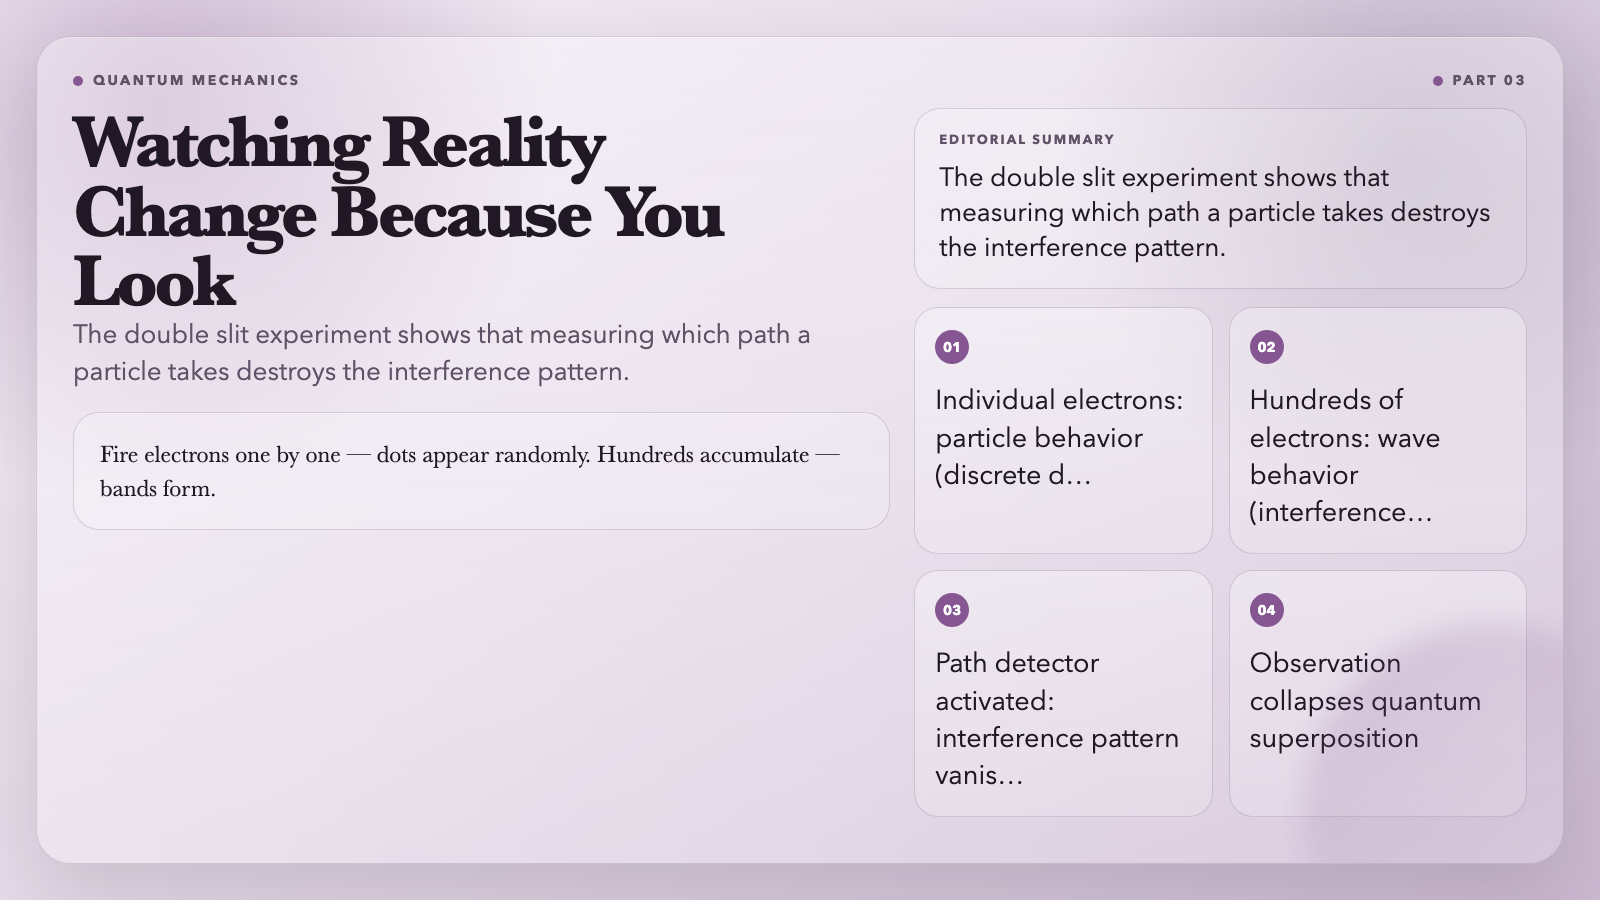
The Double Slit Quantum Trajectory visualization lets you watch this happen. You fire particles individually. Individual dots appear randomly—then bands emerge. Then you activate the path detector. Which slit did the electron pass through?
The interference pattern vanishes instantly. The bands collapse into two simple glows, one per slit.
This is not a measurement artifact. Measuring which path an electron takes collapses its quantum superposition. The equations predict what you’ll observe; they don’t describe what’s “really” happening. That’s the foundation of quantum computing, where engineers fight to maintain superposition long enough to compute.
4. Orbital Simulation — Kepler’s Laws in Your Hands
Kepler spent 16 years reducing Tycho Brahe’s planetary data to conclude: orbits are ellipses, not circles. The Sun occupies one focus of each ellipse.
The Orbital Simulation puts Kepler’s three laws in your hands. Drop bodies into a gravity well and watch them interact. You see equal areas swept in equal times—Kepler’s second law, animated. You can crash two stars together, fling a planet out of a system, or place three bodies and watch chaos unfold.
The three-body problem has no general closed-form solution. This simulation runs the physics numerically in your browser. You can break it. You can watch it break.
5. Quantum Tunneling — Particles Walking Through Walls
A particle with 5 eV of energy faces a 10 eV barrier. Classically, it cannot cross. Quantum mechanically, it tunnels through anyway.
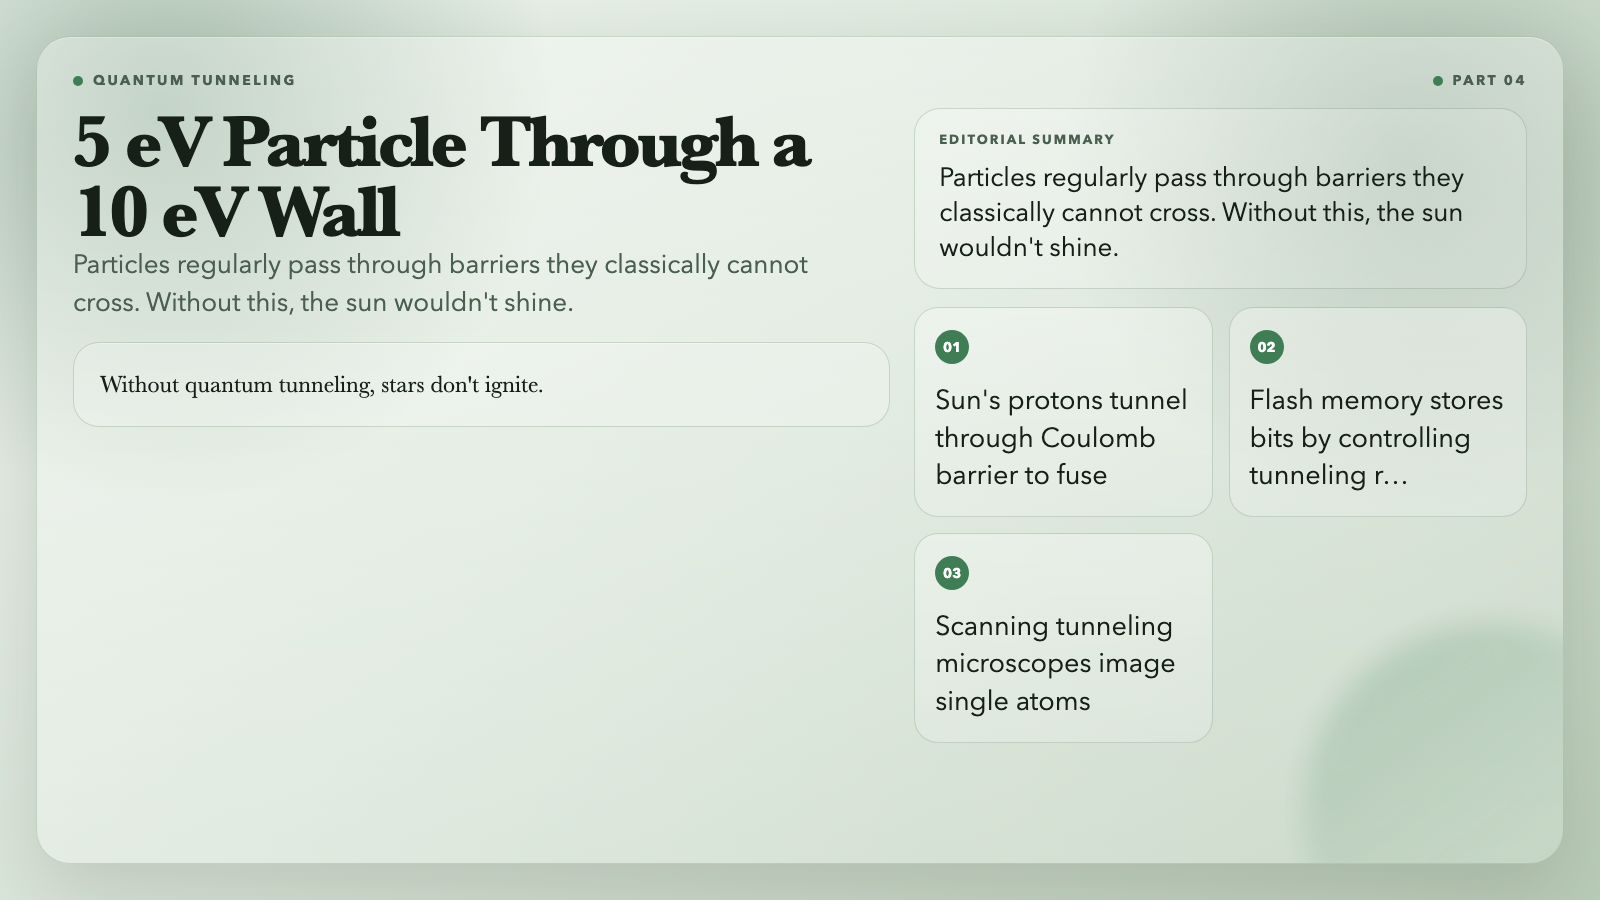
This is how the Sun burns. Protons don’t quite have enough energy to fuse—except they tunnel through the Coulomb barrier. Without quantum tunneling, stars don’t ignite.
The Quantum Tunneling visualization shows a wave function hitting a barrier and partially transmitting. Adjust barrier width and height. Watch transmission probability plummet as the barrier thickens. The math describes something physically measurable: flash memory stores bits by controlling electron tunneling rates. Scanning tunneling microscopes image individual atoms by measuring tunneling current across a vacuum gap.
For something so counterintuitive, quantum tunneling is remarkably well-engineered.
6. Hydrogen Wave Function — The Actual Architecture of Chemistry
The Bohr model—a nucleus with electrons orbiting like planets—is wrong. Electrons inhabit orbitals: three-dimensional probability clouds shaped by the Schrödinger equation.
The Hydrogen Atom Wave Function visualization shows what these orbitals actually look like. The 1s orbital is a sphere. The 2p orbitals are dumbbells pointing along x, y, and z axes. The 3d orbitals resemble four-leaf clovers. Every chemical bond, every molecular shape, every material property stems from these geometries.
Rotate through quantum numbers (n, l, m) and watch the geometry transform. You’re looking at the actual architecture of chemistry. No textbook diagram captures this.
7. Wave Superposition — The Principle Behind LIGO’s Discovery
When two waves overlap, they add amplitudes. Crest meets crest: double amplitude. Crest meets trough: complete cancellation. This is superposition—and it’s how LIGO detected gravitational waves for the first time in September 2015.
The Wave Superposition visualization lets you fire two wave trains and watch interference emerge. Control amplitude, frequency, and phase. Watch standing waves form when boundary conditions lock in resonant wavelengths. Observe two sources create a 2D interference pattern—bright fringes where waves add, dark zones where they cancel.
This is the principle behind every antenna ever built and the mathematical heart of quantum field theory: fields add, interfere, and produce the particles we detect.
The Question That Stays Open
These seven visualizations answer a lot. But they surface something harder: why does mathematics describe reality so precisely, even when it predicts things that defy intuition?
Quantum mechanics tells particles where to go. General relativity tells spacetime how to curve. But what is an electron, fundamentally? What is spacetime made of? The equations predict. They don’t explain.
Richard Feynman said it plainly: “I think I can safely say that nobody understands quantum mechanics.” Fifty years later, that hasn’t changed. These visualizations show you the pattern. What the pattern means remains the deepest open question in physics—and that’s exactly why it matters.