
The $310,000 Mistake Smart People Make With Their Money
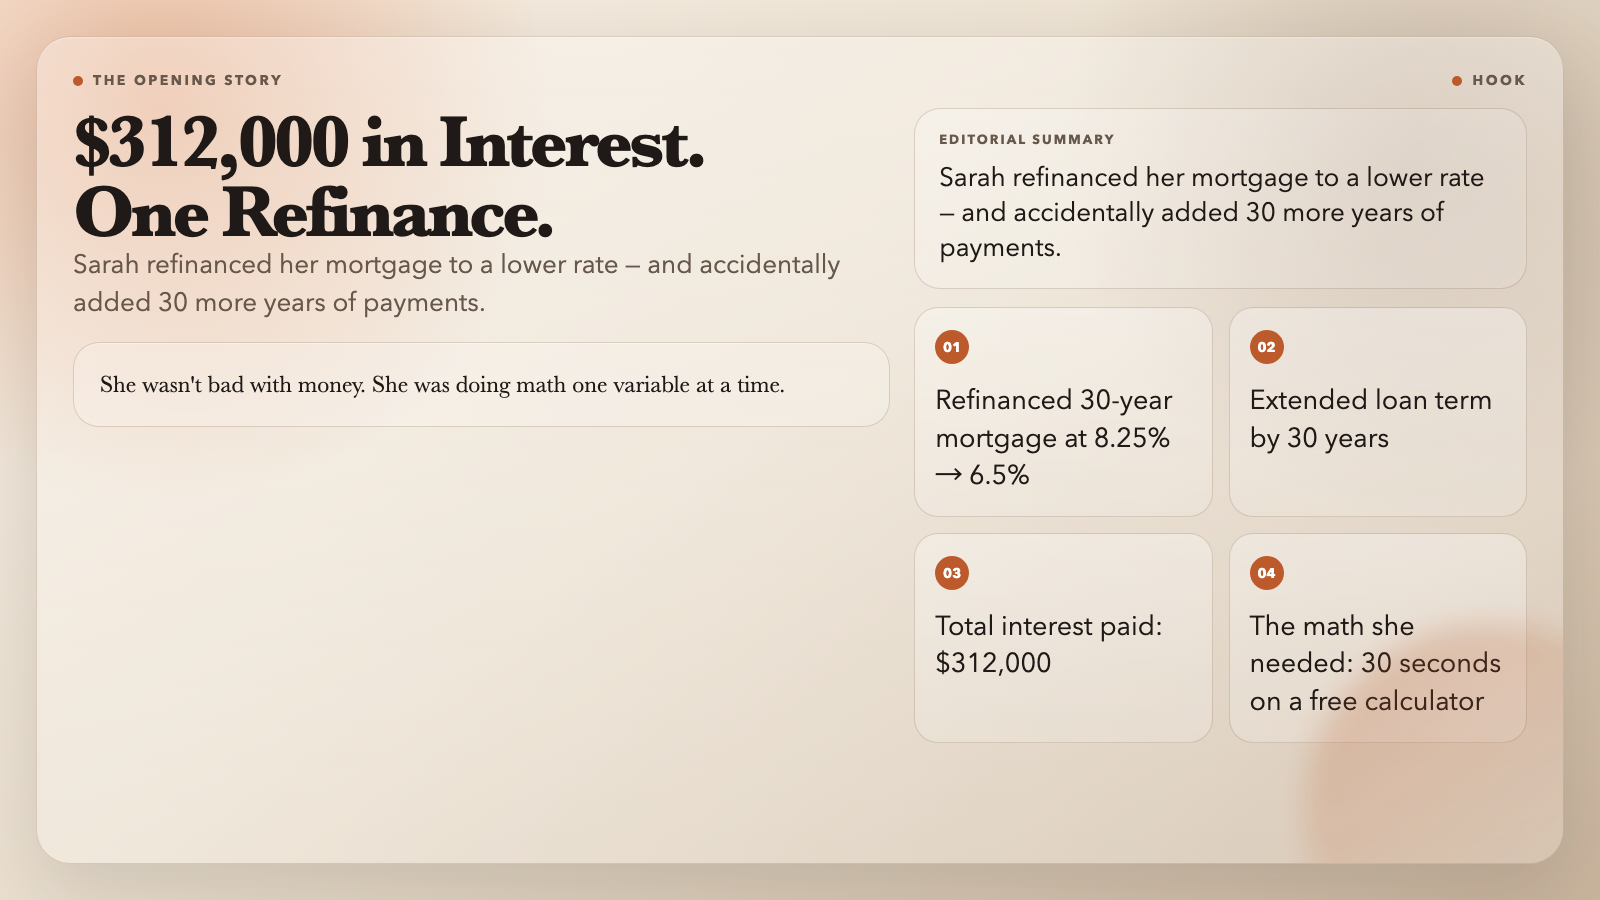
In 2008, a woman named Sarah walked into a bank to refinance her mortgage. She had excellent credit, a stable job, and $50,000 in savings. She also had a 30-year mortgage at 8.25% that she refinanced into another 30-year mortgage at 6.5%.
On paper, this looked like a win. In reality, she had just signed up for another 30 years of payments and extended the life of a loan that would cost her $312,000 in interest over the new term.
She wasn’t bad with money. She was doing math the way most people do math: one variable at a time, without seeing the whole picture.
The tools that would have shown her the full picture? They’re free. And they take 30 seconds.
Here are 8 financial calculators that replace the manual spreadsheet work you’re probably still doing by hand.
#
Rule of 72 Calculator
The one mental math trick finance pros actually use
Here’s a number that will stick with you: 72. Divide it by your annual interest rate, and you get roughly how many years it takes your money to double.
At 6% return: 72 ÷ 6 = 12 years.
At 8% return: 72 ÷ 8 = 9 years.
At 12% return: 72 ÷ 12 = 6 years.
This is the Rule of 72 — a shortcut so elegant that it has survived centuries of financial innovation.
But here’s what most people don’t know: the Rule of 72 is just the start. The Rule of 72 Calculator goes further. It compares all three rules (72, 69, and 70), shows you the exact error margins, and tells you which rule is most accurate for your specific rate.
At 4% interest, the Rule of 69 outperforms Rule of 72. At 8%, Rule of 72 is your best bet. The calculator doesn’t just give you a number — it shows you the comparison table so you understand *why*.
Why it matters: The Rule of 72 is the foundation of financial intuition. Once you can double your money mentally, you start asking better questions: Is my 4% savings account actually working? What’s a realistic doubling timeline for my retirement fund?
Try the Rule of 72 Calculator →
#
Amortization Schedule Generator
The loan truth that’s buried in your mortgage paperwork
Every mortgage, car loan, and student loan comes with an amortization schedule. It shows how each payment splits between principal and interest over time. The problem? Banks give you a 40-page PDF, and the critical insight — how much equity you actually own at year 5 vs year 15 — is hidden in the tables.
The Amortization Schedule tool generates a complete payment breakdown in seconds. Enter your loan amount, interest rate, and term, and you get:
– Monthly payment amount
– Total interest paid over the life of the loan
– Payoff date
– Year-by-year breakdown of principal vs interest
Here’s a number that surprises people: On a $300,000, 30-year mortgage at 6.5%, you pay more in interest than principal. Your $1,896 monthly payment feels manageable until you realize you’re handing the bank $383,000 in interest over three decades.
Why it matters: Amortization is how banks make money. Understanding it is how you decide whether to refinance, make extra payments, or pay off a loan early. The calculator shows you exactly when the tipping point happens — when your payments start going more to principal than interest (hint: it’s not halfway through your loan).
Try the Amortization Schedule Calculator →
#
Rent vs Buy Calculator
The housing decision that costs most people the most money
Buy or rent? It’s the financial question with the longest tail of consequences. Get it wrong and you’re either trapped in a bad investment or watching your neighbors build equity while you pay someone else’s mortgage.
The Rent vs Buy Calculator models the full decision across 14 variables:
– Home price, down payment, mortgage rate, and loan term
– Property tax, insurance, maintenance costs
– Monthly rent and expected annual rent increases
– Home appreciation rate vs investment return rate
– Comparison period (1-30 years)
Most people stop at “what’s the monthly payment?” This calculator asks the right question: what’s your *net worth* difference after 10 years under each scenario?
It outputs a year-by-year comparison showing when buying crosses above renting — the “break-even year” that’s the real answer to the buy-vs-rent question.
Why it matters: The rent-vs-buy decision is never just about monthly cash flow. It’s about opportunity cost — what else could your down payment and equity be doing? This calculator forces you to compare the full picture.
Try the Rent vs Buy Calculator →
#
Debt Snowball Calculator
The psychological advantage that makes debt payoff 3x faster
The debt snowball method is simple: pay off your smallest balance first, then roll that payment into the next smallest. It sounds counterintuitive — shouldn’t you tackle high-interest debt first? Here’s the psychology: quick wins build momentum. Paying off a $500 credit card in 3 months feels like a victory. That victory keeps you motivated to attack the next one.
The Debt Snowball Calculator handles up to 5 debts and shows you:
– Payoff order (smallest balance first)
– Total interest paid
– Payoff date for each debt
– Total months to debt freedom
It also shows the psychological milestone: when each debt gets paid off. That visibility matters more than you’d think. Most people quit debt payoff plans because they can’t see progress. The snowball makes progress visible.
Why it matters: Debt payoff is 80% psychology, 20% math. The snowball method works because it engineers early victories that sustain motivation. This calculator gives you both the math and the momentum.
Try the Debt Snowball Calculator →
#
Daily Compound Interest Calculator
Where the math gets satisfying
Compound interest is called the eighth wonder of the world for a reason. Einstein allegedly called it the most powerful force in the universe. What’s less known: compounding frequency matters more than most people realize.
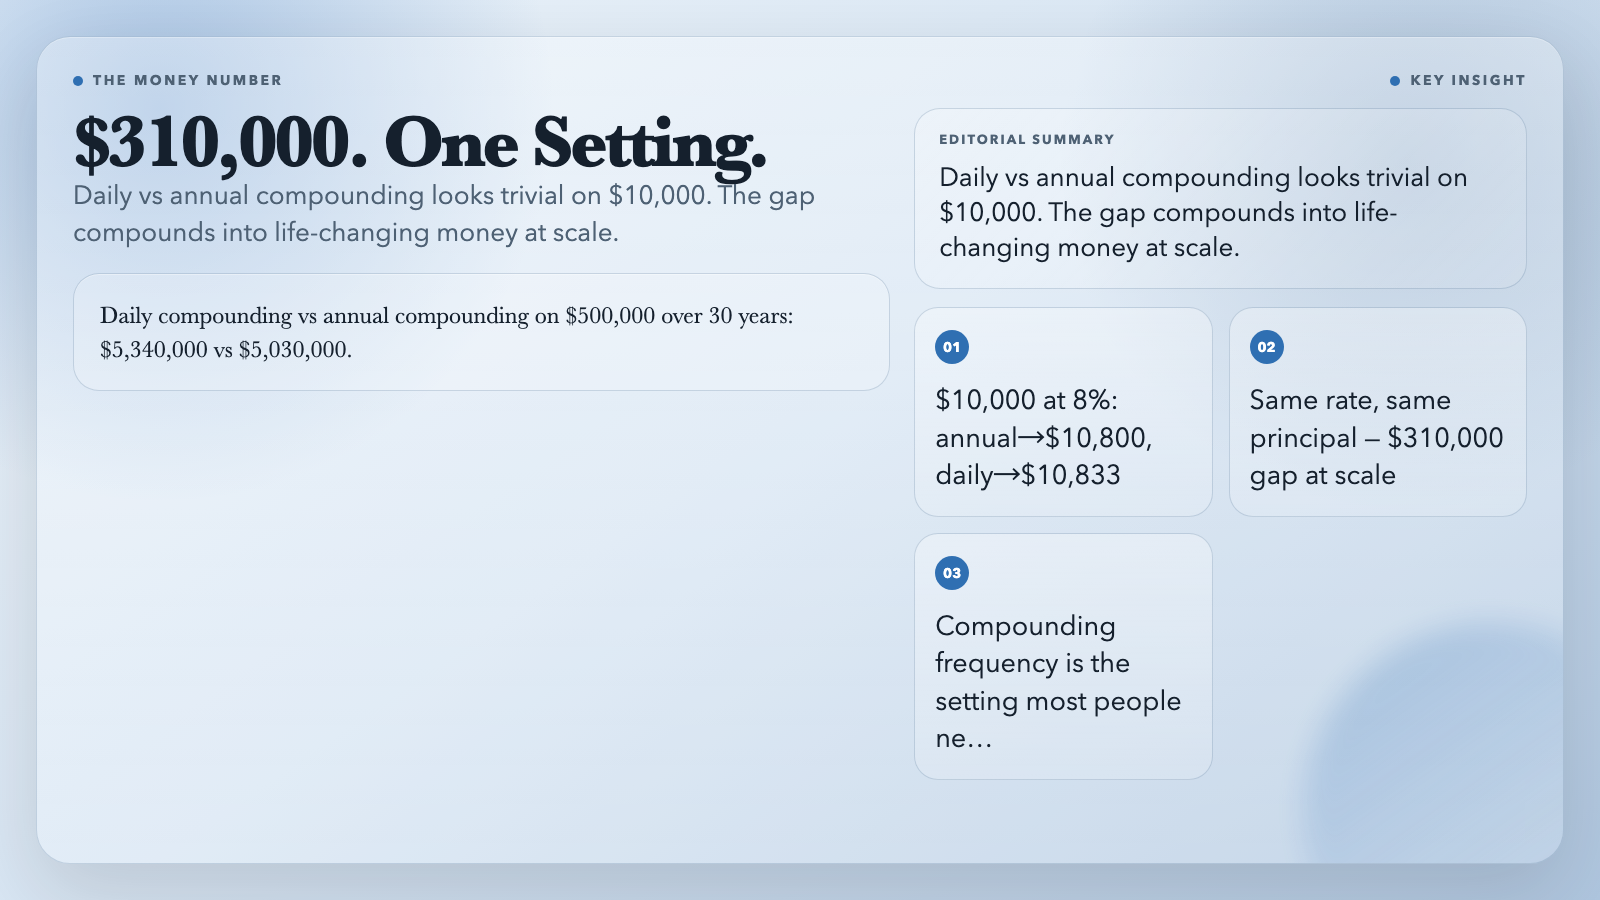
$10,000 at 8% annual interest:
– Compounded annually: $10,800 after 1 year
– Compounded monthly: $10,830 after 1 year
– Compounded daily: $10,833 after 1 year
The difference seems small on $10,000. Scale it to $500,000 over 30 years, and daily compounding vs annual compounding is the difference between $5,340,000 and $5,030,000. That’s a $310,000 gap from one setting.
The Daily Compound Interest Calculator shows you exactly how compounding frequency affects your returns — and lets you model scenarios that would take a spreadsheet engineer hours to build.
Why it matters: Compound interest is how wealth builds. Understanding the difference between daily and annual compounding doesn’t just improve your math literacy — it changes how you think about every financial decision, from savings accounts to investment returns.
Try the Daily Compound Interest Calculator →
#
Capital Gains Tax Calculator
The tax question that trips up every investor
You sold a stock for a profit. How much do you actually owe? The answer depends on holding period (short-term vs long-term), your income bracket, and whether you’re in a state that taxes capital gains. The Capital Gains Tax Calculator handles all three.
It calculates:
– Short-term capital gains (held less than 1 year, taxed as ordinary income)
– Long-term capital gains (held over 1 year, lower tax rates)
– Net investment income tax (3.8% for high earners)
– After-tax proceeds
The hidden insight: short-term vs long-term classification changes everything. A $50,000 gain in the 24% bracket costs you $12,000 in taxes short-term, but only $10,000 long-term. That’s $2,000 saved by waiting 365 days. Before you sell, you need to know which rate applies.
Why it matters: Capital gains taxes are the most commonly miscalculated tax in personal finance. Most people know “long-term is better” but don’t realize how much the difference is — or that state taxes can add 5-13% on top of federal rates. This calculator shows you the full picture.
Try the Capital Gains Tax Calculator →
#
Future Value Calculator
How much will your money actually be worth?
Inflation erodes purchasing power. A dollar today is worth less than a dollar in 20 years. But investments grow. The question isn’t just “how much will I have?” — it’s “how much will my money be worth in real terms?”
The Future Value Calculator models growth with optional inflation adjustment:
– Future value with compound growth
– Real value adjusted for inflation
– Year-by-year breakdown
– Support for recurring contributions (monthly deposits)
This is the tool that answers the question: should I pay off my mortgage early or invest the extra payment? The answer depends on comparing your mortgage rate (guaranteed return) against your investment expected return (uncertain). Future value calculations make that comparison concrete.
Why it matters: Future value thinking is the bridge between “I saved $500 this month” and “I can actually afford to retire at 62.” Without it, you’re making financial decisions based on nominal dollars instead of real purchasing power.
Try the Future Value Calculator →
#
Loan Calculator
The starting point for any major borrowing decision
Before you sign any loan — mortgage, auto, personal, or student — you need to know exactly what you’re committing to. The Loan Calculator gives you the full picture:
– Monthly payment
– Total interest over the loan term
– Full amortization breakdown
– Early payoff scenarios
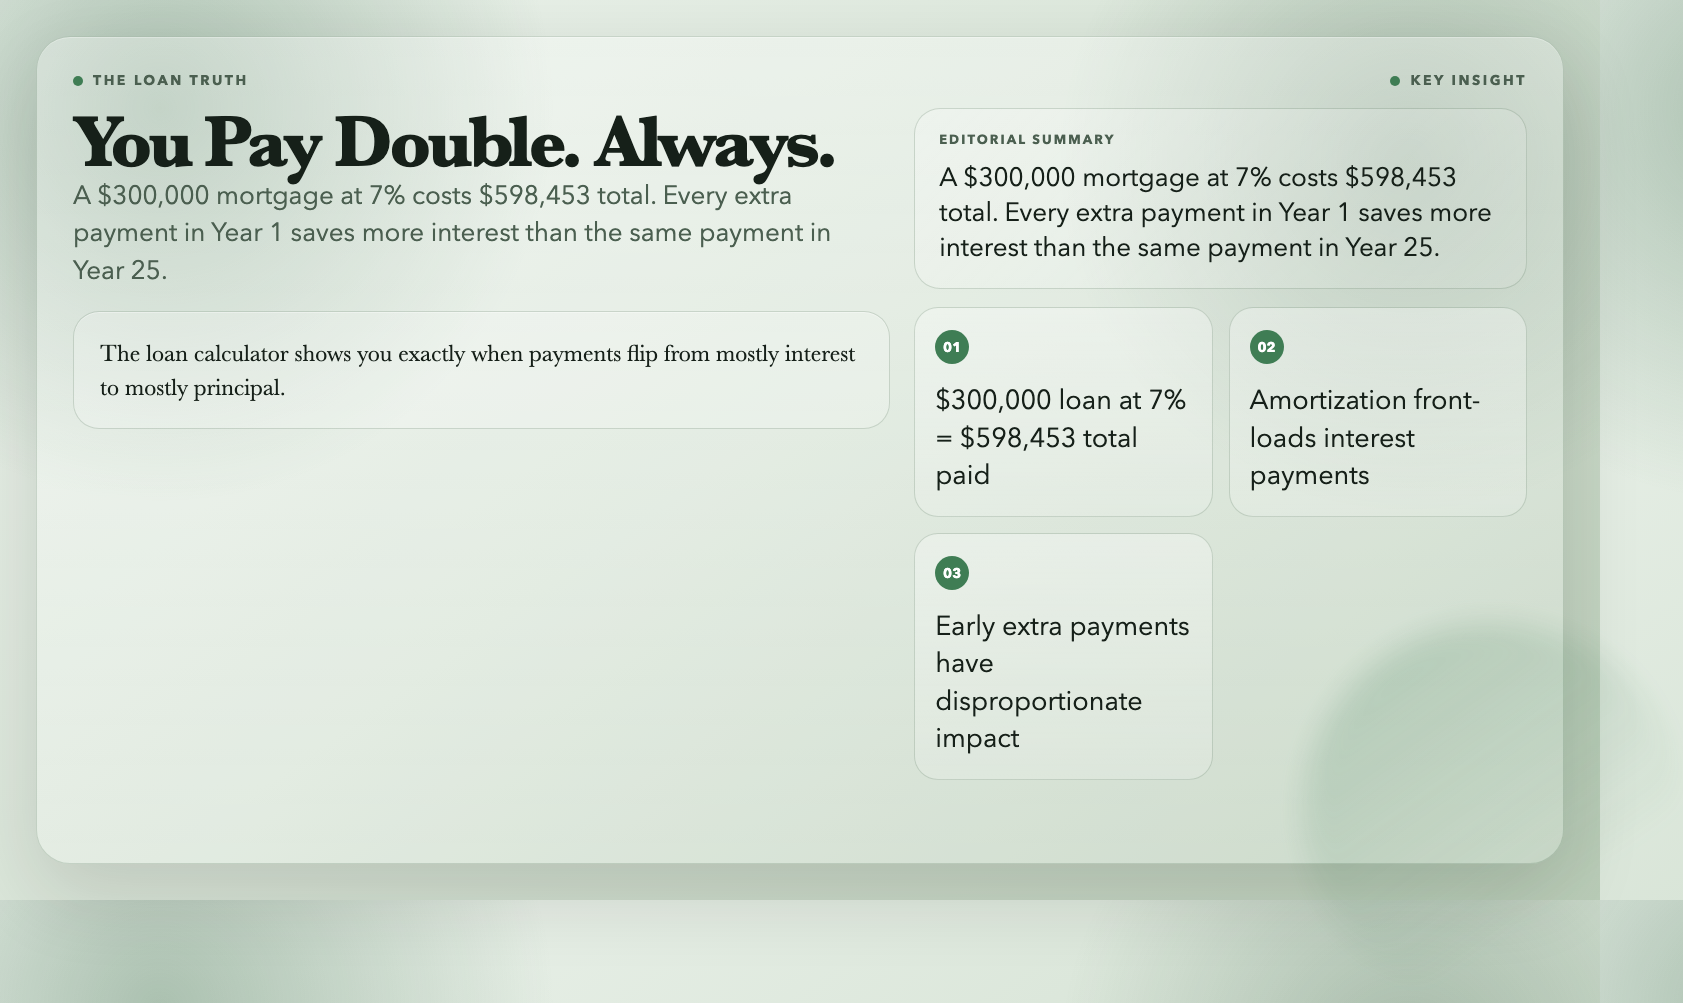
Here’s a number that changes how people think about 30-year mortgages: A $300,000 loan at 7% costs $598,453 total — you pay double the original loan amount in interest alone. Every extra principal payment you make in year 1 saves more interest than the same payment in year 25, because of how amortization works.
Why it matters: The loan calculator is the baseline tool. Before you negotiate a rate, compare lenders, or decide on loan term, you need to know what the numbers actually look like. This is where that knowledge starts.
—
#
The Pattern Behind All of These
Every one of these calculators solves the same problem: financial decisions are too important to trust to mental math or rough estimates.
The Rule of 72 is a great mental shortcut, but the calculator shows you the error margins. Amortization is conceptually simple, but the year-by-year breakdown reveals patterns you can’t see in a 30-year summary. Rent vs buy feels like a gut decision, but the break-even year is a calculable number.
The question isn’t whether to do the math — it’s whether to do it once and get it right, or do it wrong and pay for the error for 30 years.
Explore all 8 calculators: https://elysiatools.com/en/categories/finance
—
One more thing: The best time to use these calculators was five years ago. The second best time is before you sign your next loan, open your next investment account, or make your next major financial decision. Set a reminder to run your numbers. The math is always the same — it’s your future that changes.



장기적으로 지불하게 될 이자 비용을 계산해 보니 정말 아찔하네요. 대출 상환 스케줄러를 통해 원금과 이자의 비중을 직접 확인해 보는 게 재테크의 시작인 것 같습니다.
这篇文章通过案例把复利和还款陷阱说得很透,很多人确实只看每月的月供,却忽略了总利息其实已经翻倍了。
The example of Sarah is a real eye-opener because it shows how easy it is to focus on the monthly payment while ignoring the long-term cost. I just ran my own mortgage through an amortization calculator and was shocked at how much interest I am projected to pay.