The Secret Language Behind Every Smooth Curve You See Online
When a graphic designer drags a handle in Adobe Illustrator and a perfectly smooth curve appears, most people assume they are watching software magic. They are watching mathematics — a specific, elegant algorithm that has been powering computer graphics since the 1960s.
The curve is called a Bézier curve. And the algorithm that draws it is one of the most beautiful pieces of applied mathematics you have never heard of.
The Problem Curves Solved
Before Bézier curves, drawing smooth shapes on computers was a hacky affair. Designers worked with arcs and circles — mathematical primitives that were easy to describe but nearly impossible to combine into organic shapes. A logo with a sweeping curve and a sharp corner required stitching together dozens of tiny line segments, each one a separate calculation.
Pierre Bézier, working at Renault in the 1960s, wanted a better way to design car bodies. What he (and simultaneously Paul de Casteljau at Citroën) developed was a system for describing smooth curves using nothing but a handful of points. No arcs, no circles, no trig functions. Just straight lines — and the right way of averaging them.
The de Casteljau Algorithm: Play It Forward

Here is the entire secret. It fits in a single sentence: to find a point on a Bézier curve, repeatedly interpolate linearly between your control points until you reach the parameter value you want.
Interpolation means this: if you have two points A and B, and you want the point that is halfway between them, you take (A + B) / 2. At t=0.3 along the way, you take 0.3 × A + 0.7 × B.
For a cubic Bézier — the workhorse of font design and illustration — you start with four control points: P0, P1, P2, P3. You interpolate between P0 and P1 at parameter t to get Q0. You interpolate between P1 and P2 at t to get Q1. You interpolate between P2 and P3 at t to get Q2. Then you interpolate between Q0 and Q1 to get R0, and between Q1 and Q2 to get R1. Finally, you interpolate between R0 and R1 to get your point on the curve.
That is it. Four points in, one point out. No squaring, no square roots, no trigonometry. Just add and divide.
Run this at t=0, you get the start of the curve. Run it at t=1, you get the end. Run it at every value in between and you have a perfect smooth curve.
Why Three Points Are Not Enough
Linear Bézier curves — two control points — are just straight lines. Technically a Bézier curve, but useless on its own. The interesting behavior starts with three points, giving you a quadratic curve.
With three control points, you do two interpolations to get Q0 and Q1, then one final interpolation between Q0 and Q1 to get your curve point. The resulting curve passes through the first and last control points, and bends toward the middle one. You can make a parabola, an S-curve, or a simple arch. But you cannot make an S-shaped curve that has two bends in opposite directions. For that you need four points.
Cubic Bézier curves are the industry standard. PostScript, TrueType fonts, SVG, Canvas, CSS transitions, and virtually every vector graphics format uses cubic Bézier curves as their native building block. The reason is practical: cubic curves give designers two independent control points to shape the curve, which is enough flexibility to represent almost any smooth shape they need.
The Convex Hull Is the Safety Net

Here is a property that explains why Bézier curves behave so predictably, even in the hands of a beginner dragging handles around a screen.
The curve always stays inside the convex hull of its control points — the smallest convex polygon that contains all of them. This is called the convex hull property.
What this means in practice: if you pull a control point far away from the others, the curve will stretch toward it but never leave the region bounded by your points. You cannot create a curve that goes wildly outside the area you defined. The algorithm will not allow it.
This property is not just mathematically convenient — it is the reason you can hand a Bézier curve editor to someone with no mathematical training and they will immediately understand what will happen when they drag a handle. The interaction is predictable. The curve does not surprise you.
The Bernstein Polynomial Connection
The de Casteljau algorithm is intuitive and geometric — it is the right way to compute a Bézier curve. But there is an equivalent formulation that reveals something deeper about what the curve actually is.
Every Bézier curve of degree n can be written as a weighted sum of Bernstein polynomials. For a cubic curve, the four Bernstein basis polynomials are:
B0(t) = (1 – t)³ B1(t) = 3t(1 – t)² B2(t) = 3t²(1 – t) B3(t) = t³
And the curve is: B0(t)P0 + B1(t)P1 + B2(t)P2 + B3(t)P3.
Each Bernstein basis polynomial describes how one control point contributes to the curve at each value of t. At t=0, B0 = 1 and all others = 0, so the curve starts at P0. At t=1, B3 = 1 and all others = 0, so the curve ends at P3.
What is elegant about this formulation is that it tells you exactly what each control point does. P0 and P3 anchor the ends. P1 and P2 control the incoming and outgoing tangents. And the binomial coefficients (1, 3, 3, 1) fall straight out of the binomial theorem — the same coefficients that give the bell curve in statistics.
Why Fonts Work the Way They Do
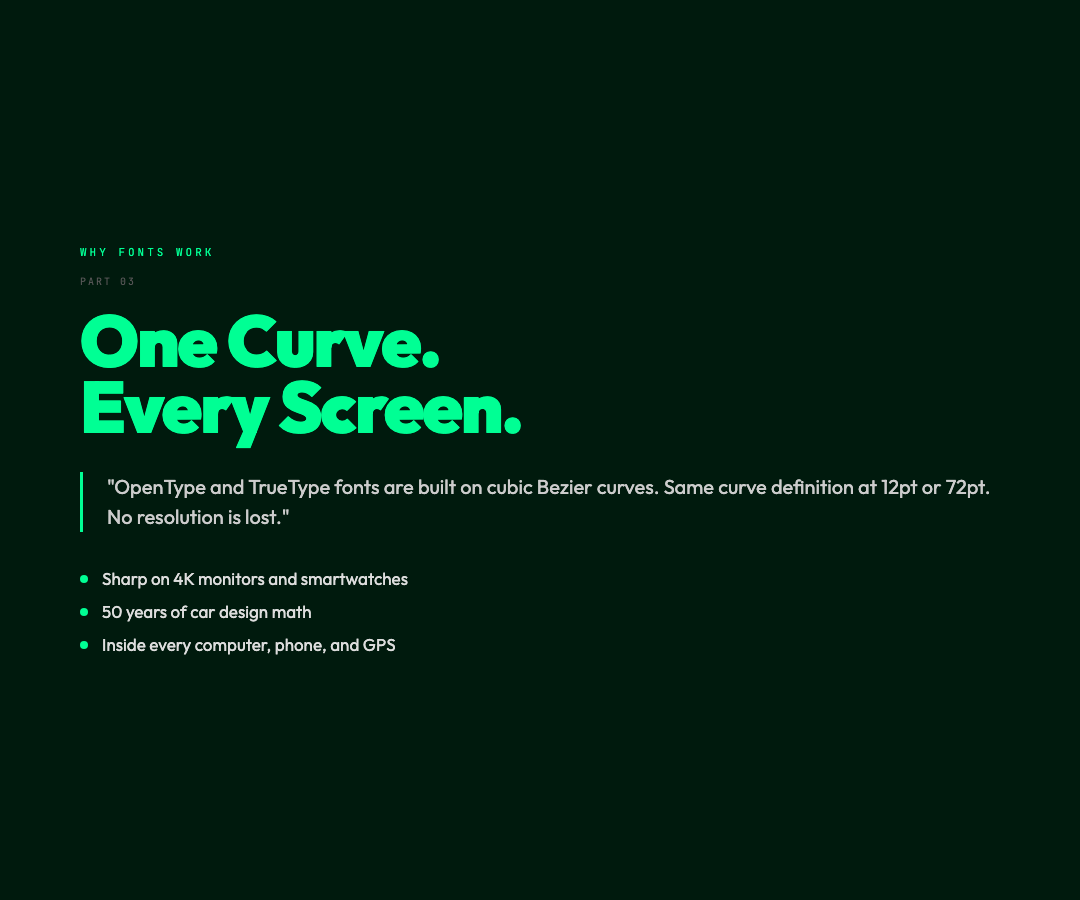
OpenType and TrueType fonts are built on cubic Bézier curves. Each letter is described as a collection of Bézier segments, with control points placed at the endpoints of curves and at the sharp corners where direction changes.
When you enlarge a font character from 12pt to 72pt, the same curve definition is used. No resolution is lost. No pixelation appears. The curve is recomputed at the exact resolution of your display, which is why vector fonts look sharp on a 4K monitor and on a smartwatch simultaneously.
This is the practical payoff of a mathematical idea that took two engineers at French car companies about ten minutes to understand in 1959. Fifty years later it was inside every computer, phone, and GPS unit on the planet.
The Iteration Principle
The de Casteljau algorithm is the Bézier curve, and the Bézier curve is repeated linear interpolation. This turns out to be one of those ideas that once you see it, you cannot unsee it.
The same pattern — start with a set of values, repeatedly average neighboring values — shows up everywhere in applied mathematics. It is the logic behind subdivision surfaces in 3D modeling, the calculation of moving averages in financial charts, the operation of certain kinds of neural network layers, and the proof that running water finds the smoothest path downhill.
The complexity is not in the rules. It is in the iteration.
Run a simple rule enough times, through enough layers, and you get something that looks and feels like the natural world. A smooth curve. A sculpted surface. A letterform that holds up at any size.
Bézier curves are the clearest illustration of this principle in everyday digital life. Every time you see a smooth curve on a screen, you are watching mathematics that was first written down for car design, refined by two competing engineers, and has been running without modification ever since.
Drop two points. Draw a line. Average. Repeat.