The Day a Botanist Accidentally Proved Atoms Exist — and the Mathematician History Forgot
In 1827, Scottish botanist Robert Brown peered through his microscope at pollen grains suspended in water. The grains jittered and danced in tiny, erratic loops — as if alive. Brown first assumed he was witnessing some primordial life force. Then he looked at inorganic particles — glass, stone, even ash — and watched them dance too. Whatever this was, it had nothing to do with being alive.
Brown had no explanation. He published his observation and moved on. It would take 78 years and Albert Einstein to explain what Brown had seen: the invisible bombardment of molecules, the first direct experimental evidence that atoms were real.
But there’s a second, stranger part to this story — one involving a French mathematician who wrote a dissertation on stock price fluctuations in 1900, five years before Einstein’s famous paper. His work was ignored for six decades. When it was finally rediscovered, it became the foundation of a trillion-dollar industry.
The Jitter That Reveals the Invisible
Brownian motion — the technical name for this ceaseless, random jiggle — is all around us. Dust particles dancing in a sunbeam. Molecules diffusing through air. The tiny movement of a suspended object that seems to never stop, no matter how precisely you measure it.
What makes Brownian motion extraordinary isn’t just its ubiquity. It’s the mathematical regularity hiding inside the chaos.
Watch a single particle undergoing Brownian motion and it goes wherever the molecular collisions push it — completely unpredictable, impossible to forecast. But watch 1,000 such particles together, and a pattern emerges. The distribution of their positions always follows a Gaussian (bell curve). More specifically, the mean squared displacement — how far, on average, they’ve wandered squared — grows linearly with time:
⟨x²⟩ = 2Dt
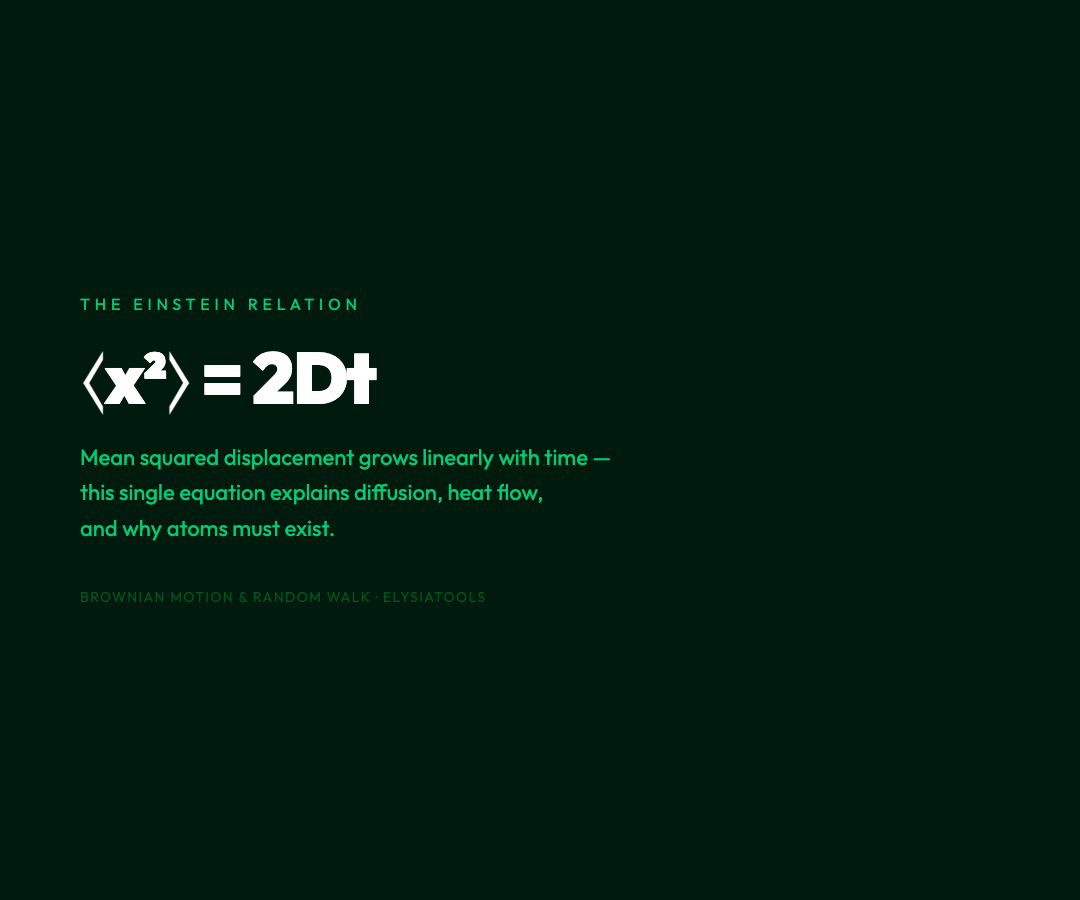
The D here is the diffusion coefficient, a number that depends on the particle’s size, the medium’s viscosity, and temperature. This is the Einstein relation, published in 1905, the same year he published special relativity.
Brown didn’t know it, but his humble pollen grain had revealed one of the most profound regularities in all of physics.
The Discovery Before Einstein: Bachelier’s Forgotten Dissertation
While Einstein was working out the kinetic theory of heat in 1905, a 29-year-old French mathematician named Louis Bachelier was defending a doctoral dissertation in Paris. The title: Théorie de la Spéculation — Theory of Speculation.
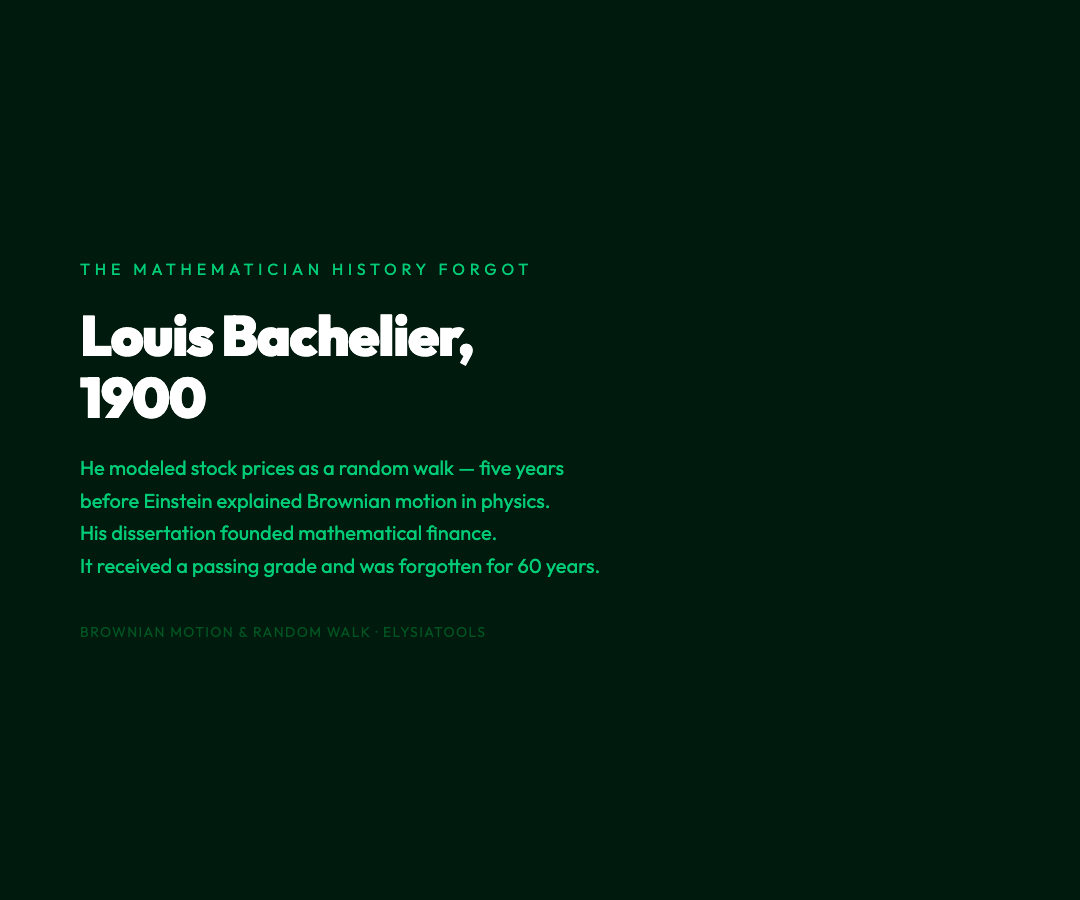
Bachelier had modeled stock prices as following a random walk. He derived prices for options and other derivatives using what would later be called Brownian motion — before physicists had even properly described it. His dissertation included a formula that is essentially the Gaussian probability distribution for random walks, six decades before it became the foundation of quantitative finance.
The academic community found the work odd but unremarkable. Finance was not a respectable subject for mathematicians in 1900. Bachelier’s thesis received a passing grade — barely — and was largely forgotten.
Sixty years later, economist Paul Samuelson encountered Bachelier’s paper in a used bookshop. He recognized its brilliance immediately. “Bachelier gets priority,” Samuelson wrote, “and almost nobody knows it.”
Today, Bachelier’s random walk model underpins the Black-Scholes formula, the backbone of the modern derivatives market — a market worth trillions of dollars daily. The formula that runs on the trading floors of every major bank traces its mathematical lineage to a forgotten French dissertation that nobody read.
Three Modes, One Equation
The ElysiaTools Brownian Motion & Random Walk visualization lets you explore this phenomenon across three completely different domains — and see how a single mathematical framework ties them all together.
Physics Mode shows particles diffusing through a medium. You can verify the Einstein relation yourself: set the diffusion coefficient, start a swarm of particles at the origin, and watch the mean squared displacement plot. The slope of that plot is 2D — exactly what Einstein’s theory predicts.
Finance Mode reveals why random walk thinking reshaped economics. A stock price that follows a geometric Brownian motion — meaning log-returns are normally distributed rather than prices themselves — can never go negative, which makes intuitive sense for assets. Adjust the drift (μ, the trend) and volatility (σ, the randomness) to see how different market conditions play out. You can even price options using the built-in Black-Scholes calculator.
Math Mode zooms into the underlying formalism. Here you can explore the Wiener process — the mathematical object at the heart of Brownian motion — and see why stochastic calculus requires its own rules. Ordinary calculus tells you that the derivative of x² is 2x. But when x is a random walk, (dW)² = dt, which means you pick up an extra term that changes everything. This insight, due to mathematician Itô Kiyoshi, is why we can do calculus with Brownian motion at all.
Why the √n Scaling Changes Everything
Here’s the intuition worth sitting with.
In a simple random walk — flip a coin, move up or down by one unit — after n steps the typical distance traveled scales as √n. Not n. Not n/2. √n.
This means: to double how far you typically wander, you need four times as many steps. To go 10× farther, you need 100× more steps. Random walks are extraordinarily slow explorers.

The same scaling appears in diffusion. A drop of dye in water doesn’t spread at a constant rate — it spreads as √t. After 4 seconds it travels half as far as it does after 16 seconds. This is why smells reach you slowly and why pollution in a lake takes decades to disperse.
This is also why investment returns over short periods are so noisy. Stock prices follow something like a random walk. The √n scaling means the signal-to-noise ratio gets better slowly — you need four times as much data to double your confidence in an estimate. This is why short-term market predictions are so unreliable and why long-term investing has a statistical edge that short-term trading doesn’t.
The Bell Curve Appears From Nowhere
Perhaps the most remarkable fact about Brownian motion: you get a Gaussian distribution regardless of what you’re modeling.
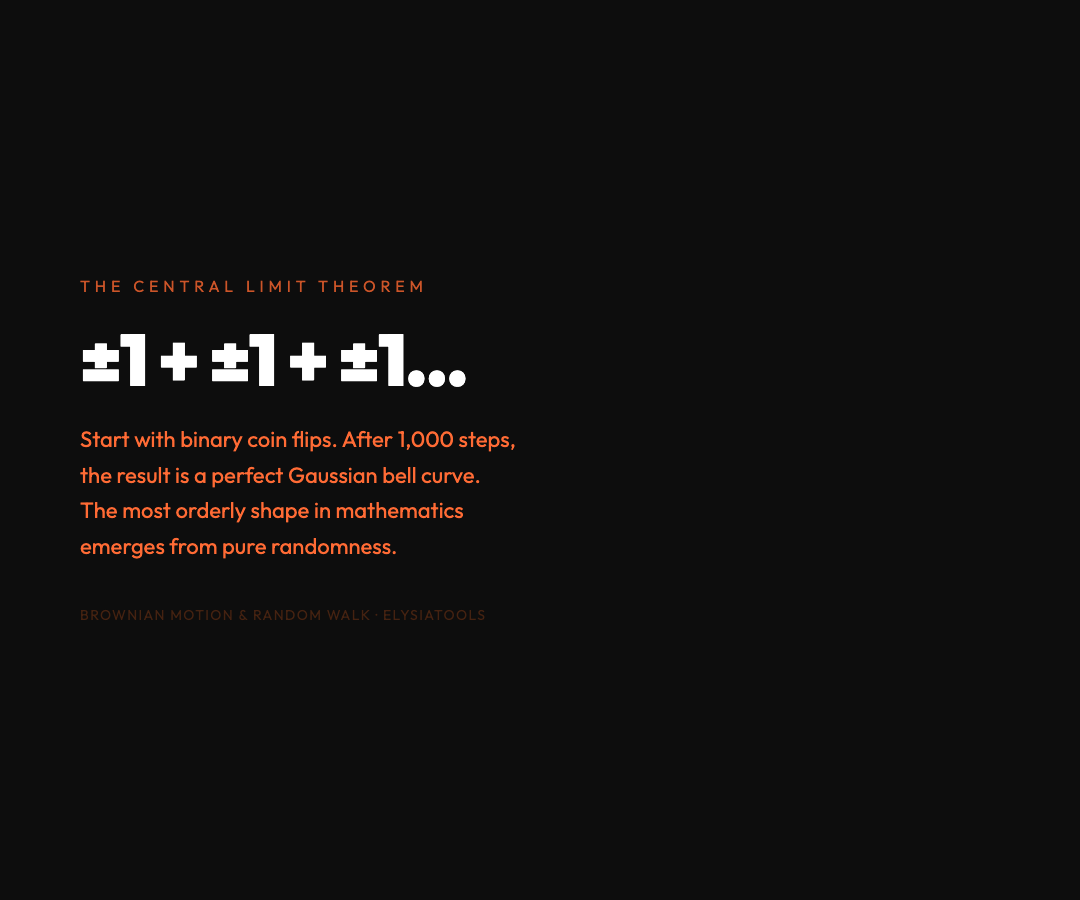
Start with a simple random walk where each step is ±1 with equal probability. This is about as far from a bell curve as you can get — each step is entirely discrete and binary. But after 100 steps, the distribution of positions looks like a perfect Gaussian. After 1,000 steps, it’s even more perfectly bell-shaped.
This is the Central Limit Theorem at work — one of the most consequential results in all of mathematics. When you add up enough independent random influences, the result always tends toward normality, regardless of the underlying process. This is why measurement errors are Gaussian, why exam scores are Gaussian, why vote swings in elections are approximately Gaussian.
And it’s why the same equation governs pollen grains, stock prices, and the spread of rumors through a population: the Gaussian emerges inevitably from the mathematics of random addition.
Try it: Brownian Motion & Random Walk on ElysiaTools — explore the Physics, Finance, and Math modes, run the virtual experiments, and watch the bell curve emerge from pure randomness.