Why Light Behaves Like a Wave: An Interactive Look at Young’s Double Slit Experiment
In 1801, Thomas Young performed an experiment that would dismantle Newton’s particle theory of light and restore the wave model to physics. He shone light through two narrow slits and onto a screen behind. The pattern that appeared — alternating bright and dark bands instead of two bright lines — was inexplicable if light was made of particles. But if light was a wave, it was exactly what you would expect.
Today, you can run a fully interactive version of Young’s experiment in your browser — adjusting slit separation, wavelength, and screen distance while watching the interference pattern update in real time. It is one of the most elegant physics simulations on ElysiaTools.
The Setup: Two Slits, One Screen
The classical arrangement is straightforward. A beam of coherent light — meaning all photons have the same frequency and a fixed phase relationship — illuminates a barrier with two parallel slits separated by a distance d. A screen sits a distance L behind the barrier.
If light were a stream of particles, you would see two bright strips on the screen, aligned with each slit. Instead, you see a sequence of bright and dark bands called fringes. This happens because light waves from the two slits interfere.
Constructive and Destructive Interference
When the peaks of one wave align with the peaks of the other, they add together — constructive interference — producing a bright fringe. When peaks align with troughs, they cancel out — destructive interference — producing a dark band.
The path difference between waves from the two slits is:
Δ = d · sin θ
where θ is the angle from the central axis. Bright fringes appear when:
Δ = mλ (m = 0, ±1, ±2, …)
Dark fringes appear when:
Δ = (m + ½)λ
The central bright fringe at m = 0 is the brightest of all, because the path difference is zero.
The Intensity Formula
The complete intensity distribution across the screen is:
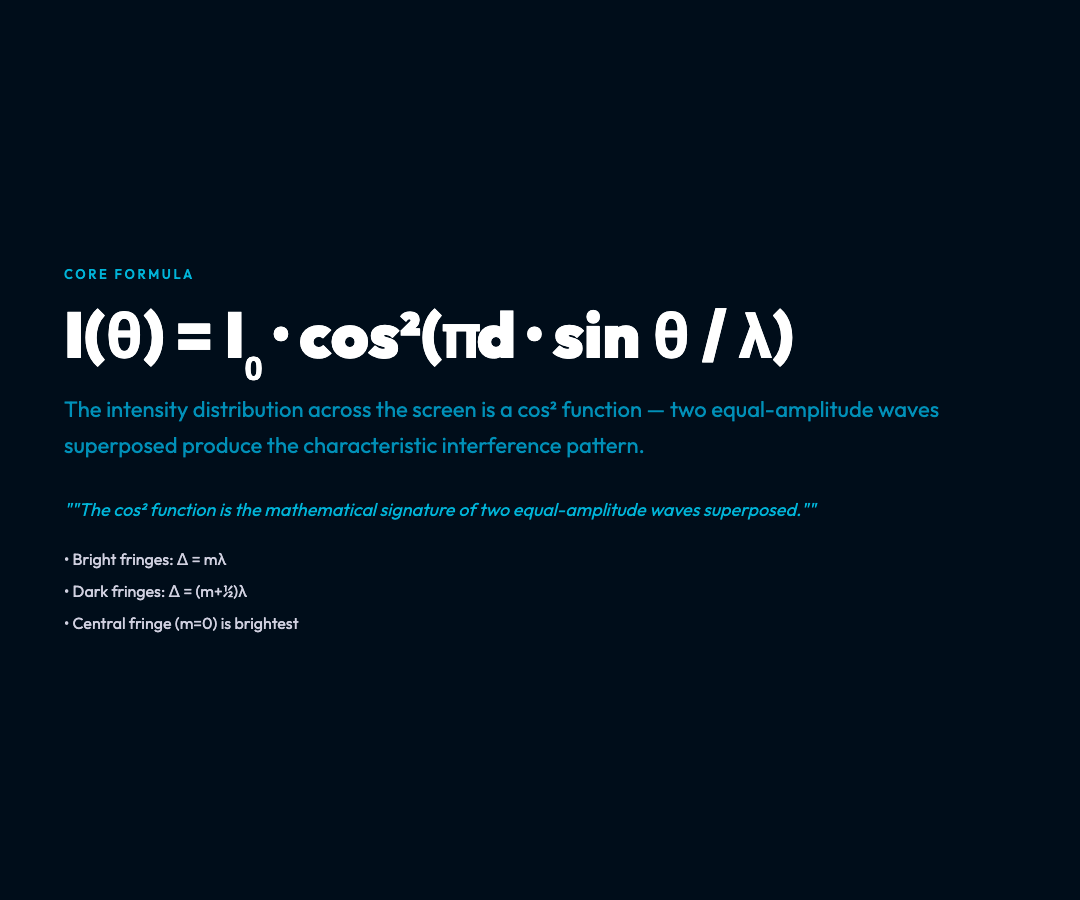
I(θ) = I₀ · cos²(πd · sin θ / λ)
This cos² function is the mathematical signature of two equal-amplitude waves superposed. At θ = 0, the path difference is zero and you get maximum intensity I₀. The fringes are equally spaced in angle, with angular separation Δθ ≈ λ/d for small angles.
On the screen itself, the linear fringe spacing is:
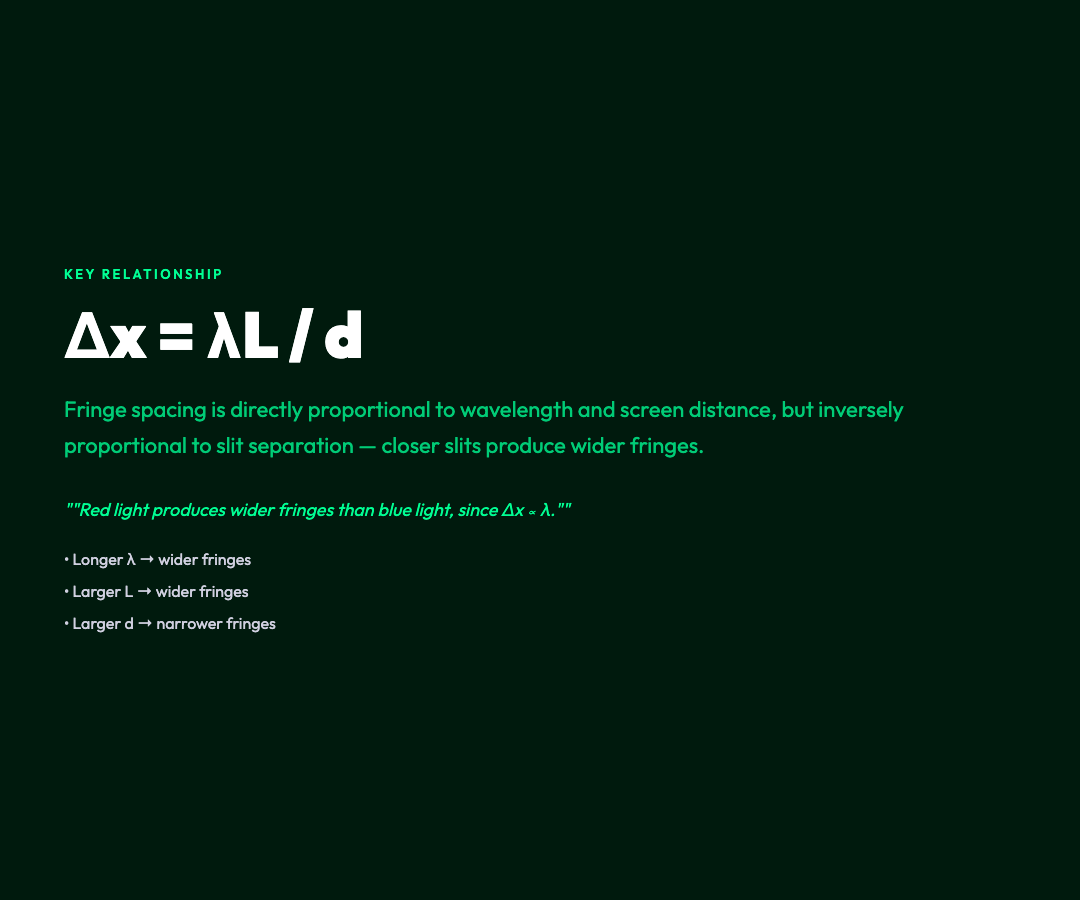
Δx = λL / d
This immediately tells you something useful: fringe spacing increases with wavelength and decreases with slit separation. Red light (longer λ) produces wider fringes than blue light. Narrowly separated slits produce wider fringes than widely separated ones.
Playing with the Interactive Simulation
The Young’s Double Slit simulation on ElysiaTools lets you manipulate these parameters directly:
– Slit separation d: Drag it from 0.05 mm to 0.5 mm. Watch the fringes squeeze together as d grows. – Screen distance L: Extend it from 0.5 m to 2.0 m. Fringe spacing increases proportionally. – Wavelength λ: Switch between red (650 nm) and blue (450 nm) presets. Red fringes are visibly wider. – Quick presets: “Close Slits” and “Far Slits” demonstrate the inverse relationship between separation and fringe width at a single click.
The simulation also shows the optical path diagram — you can see the two wavefronts emanating from each slit and observe how their superposition on the screen produces the bright and dark bands.
What Slit Separation Actually Changes
The inverse relationship between d and Δx is counterintuitive if you expect particles. When the slits are very close together, the two wave sources are nearly at the same point, and the pattern spreads wide across the screen. When the slits are far apart, the pattern compresses into closely spaced fringes.
This is why the double slit is used in precision metrology — measuring fringe spacing tells you the wavelength, or conversely, knowing the wavelength lets you measure tiny distances.
White Light and Color Separation
When you run the simulation with white light (or switch between red and blue presets), each wavelength produces its own fringe pattern. At the center, all wavelengths constructively interfere at m = 0, so the middle stripe is white. Moving outward, the fringes for different colors separate — red fringes are outermost, blue innermost.
This makes the double slit behave like a primitive spectrometer, sorting light by wavelength.
Why It Still Matters Today
Young’s experiment was the definitive evidence for the wave nature of light, but its importance extends further:
- Quantum mechanics: The double slit experiment run with individual electrons or photons still produces an interference pattern. Even though each particle passes through one slit or the other, the collective behavior is wave-like. This lies at the heart of wave-particle duality.
- Gravitational wave detection: Interferometers like LIGO use the same interference principle as Young’s double slit, but with laser light and beam splitters instead of slits and screens, to detect spacetime distortions smaller than one-thousandth the diameter of a proton.
- Optical testing: Interference patterns are used to test the surface quality of lenses and mirrors to nanometer precision.
Run the Experiment Yourself
The interactive simulation on ElysiaTools gives you a complete virtual optics lab:
- Adjust parameters and watch the interference pattern update live
- Toggle maxima and minima markers to identify fringe orders
- Compare intensity distribution graphs for different wavelengths
- Switch between a schematic optical path view and the simulated screen pattern
It is the kind of interactive understanding that a textbook diagram cannot quite deliver — you develop intuition for how the physics actually behaves by watching the pattern respond to your changes in real time.
Young’s double slit remains one of the most instructive experiments in all of physics. Over two centuries later, it still sits at the intersection of classical wave optics and quantum mechanics — a single phenomenon that connects the era of Thomas Young to the era of LIGO.