
The Math Behind Atomic Habits: Why 1% Better Every Day Compounds Into 37x Growth
James Clear’s Atomic Habits has sold millions of copies on a simple idea: tiny changes, compounded over time, produce extraordinary results. But the book leaves one question underexplored — the actual mathematics behind that claim. What does “1% better every day” look like in numbers? And why does the Plateau of Latent Potential make the early stages so demoralizing?

An interactive visualization tool lets you run the numbers yourself — and the results are quietly unsettling.
The Compound Effect Is Not Metaphor. It’s Arithmetic.
The core formula from Atomic Habits is straightforward:
f(n) = (1 + r)^n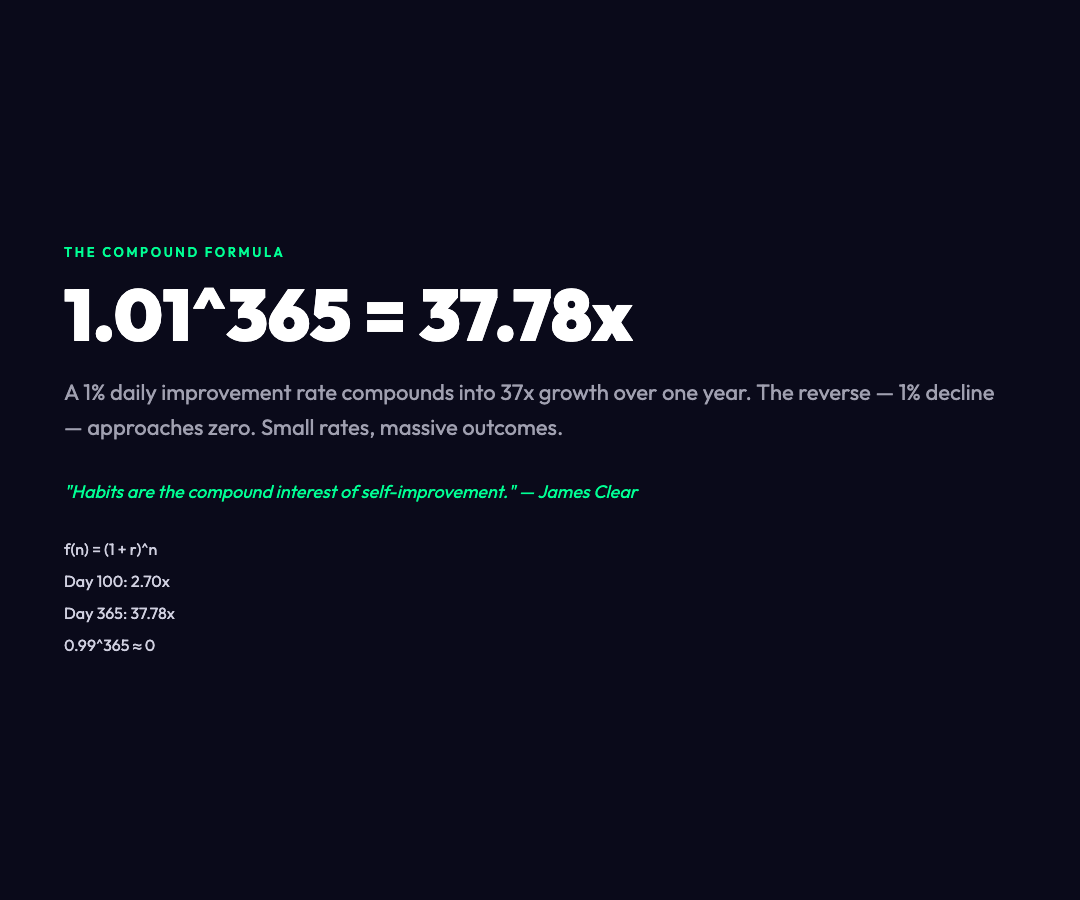
Where r is your daily improvement rate and n is the number of days.
When r = 1% (meaning you improve by just 1% each day) and n = 365, the result is 37.78x.
That’s not a motivational metaphor. It’s compound multiplication.
Day 1:    1.01^1     = 1.01
Day 30:   1.01^30    = 1.35 Day 100:  1.01^100   = 2.70 Day 365:  1.01^365   = 37.78
The visualization calculates this in real time. You adjust the daily improvement rate, set the number of days, and watch the curve bend upward. The same tool also shows the mirror image: decline by 1% each day (multiply by 0.99) and after 365 days you have roughly 0.03 — effectively zero.
The asymmetry is the insight. Gains compound slowly at first. Losses compound even more slowly — but in the wrong direction.
Why the First 100 Days Feel Like Nothing Is Happening
Here’s where the math gets psychological. The visualization includes a Plateau of Latent Potential model:
y = A(1 - e^(-kx)) + CWhere A is your maximum potential, k is your growth rate, and C is your baseline. The curve looks deceptively flat for the first several weeks, then bends sharply upward.
Plateau phase (Days 0-100):  Invisible progress. You are building "potential energy."
Breakthrough point (~Day 100):  Critical mass reached. Results begin to show. Exponential phase (Days 100+):  Compound effect fully engaged. Growth accelerates.
Most people quit around Day 40 or Day 60. They run the experiment for a few weeks, see nothing measurable, and conclude the whole system is虚无 (ineffective). What they’re actually seeing is the plateau — the point where effort is highest and visible results are lowest. The math says this is the most important phase. The visualization makes this concrete: you watch the same curve that represents your actual output, and you see exactly where the inflection point lands.
The Identity Voting Model: Your Actions Are Casting Ballots
Clear’s most underappreciated argument is that habits aren’t about outcomes — they’re about identity. Every time you act, you’re casting a vote for the type of person you want to become. The mathematical model is:
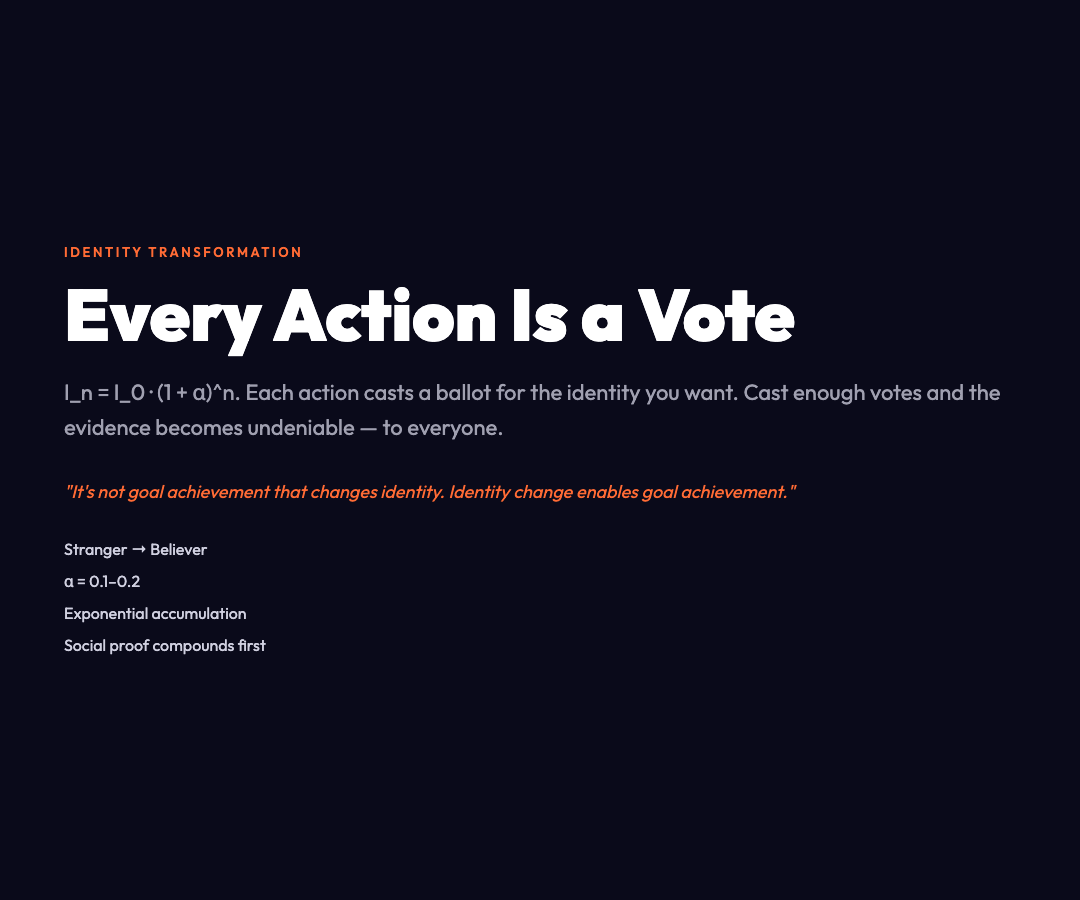
I_n = I_0 · (1 + α)^nWhere I_0 is your initial identity strength, α is how strongly each action reinforces your identity (typically 0.1 to 0.2), and n is the number of times you’ve taken the action.
The visualization includes an interactive identity voting simulator. You start as a “Stranger” and cast votes by taking actions. Each vote moves you up a ladder: Stranger → Acquaintance → Friend → Believer. The number of votes required to advance increases at each level, which models real identity transformation accurately — it’s easy to start, hard to maintain momentum.
The insight isn’t poetic. It’s exponential. Once you’ve cast enough votes, the evidence becomes undeniable — not to you, but to everyone around you. The identity shift compounds socially before it compounds personally.
The Four Laws, Quantified
Clear frames habit formation as four laws, but each has a precise mathematical interpretation the visualization explores:
Law 1 — Make it Obvious: Trigger probability scales with cue visibility. Environment design isn’t soft psychology — it’s adjusting P(trigger).
Law 2 — Make it Attractive: Motivation follows M = (E × V) / I, where expectation and value are multiplied and impedance is divided. The visualization lets you tune these parameters to model temptation bundling.
Law 3 — Make it Easy: Action probability decays exponentially with resistance: P(action) = e^(-λR). This is why the Two-Minute Rule is mathematically sound — reducing startup friction doesn’t just help you start, it exponentially increases the probability you’ll act.
Law 4 — Make it Satisfying: Present value discounting means V_present = V_future / (1 + d)^t. Immediate feedback reduces the time discount and makes long-term rewards feel closer.
The Two-Minute Rule, Modeled
The Two-Minute Rule states: if a task takes less than two minutes, do it now. The visualization models this as:
T_total = Σ(t_i · e^(-λi))Where t_i is the base time for each micro-step and λ is the difficulty decay rate achieved by decomposing the task. The insight is that decomposing a task into micro-steps doesn’t just make it psychologically easier — it mathematically reduces the effective time cost of starting, because each micro-step faces less resistance than the full task.
This is also why Standard Operating Procedures (SOPs) work: they remove the startup decision cost entirely, reducing resistance for repeated actions to near zero.
What the Numbers Actually Tell Us
The visualization tool is at Atomic Habits Compound Effect. You can adjust the daily improvement rate, watch the growth curves interact with plateau models, build identity through repeated action, and see exactly how the Four Laws translate into parameter changes.
The most useful exercise: set r = 0% (no improvement) and watch the flat line. Then set r = 1% and watch 365 days later. Then try r = 2% and see the number blow past 1,500x.
Small differences in rate produce enormous differences in outcome. That’s not inspiration. That’s arithmetic.
The compound effect doesn’t care whether you believe in it. It runs regardless.