Why the Carnot Cycle Is the Ceiling Every Heat Engine Hits
In 1824, a 28-year-old French physicist named Sadi Carnot published a pamphlet that would quietly redefine engineering. He wasn’t trying to build a better steam engine. He was trying to answer a deeper question: what is the absolute limit of what any heat engine can do?
The answer he arrived at was not a design. It was a boundary.
The Setup: Two Temperatures, One Cycle
Carnot imagined an engine working between two thermal reservoirs at fixed temperatures — a hot source at temperature T₁ and a cold sink at temperature T₂. He then asked: if this engine runs perfectly reversibly, what is its maximum possible efficiency?

The answer is:
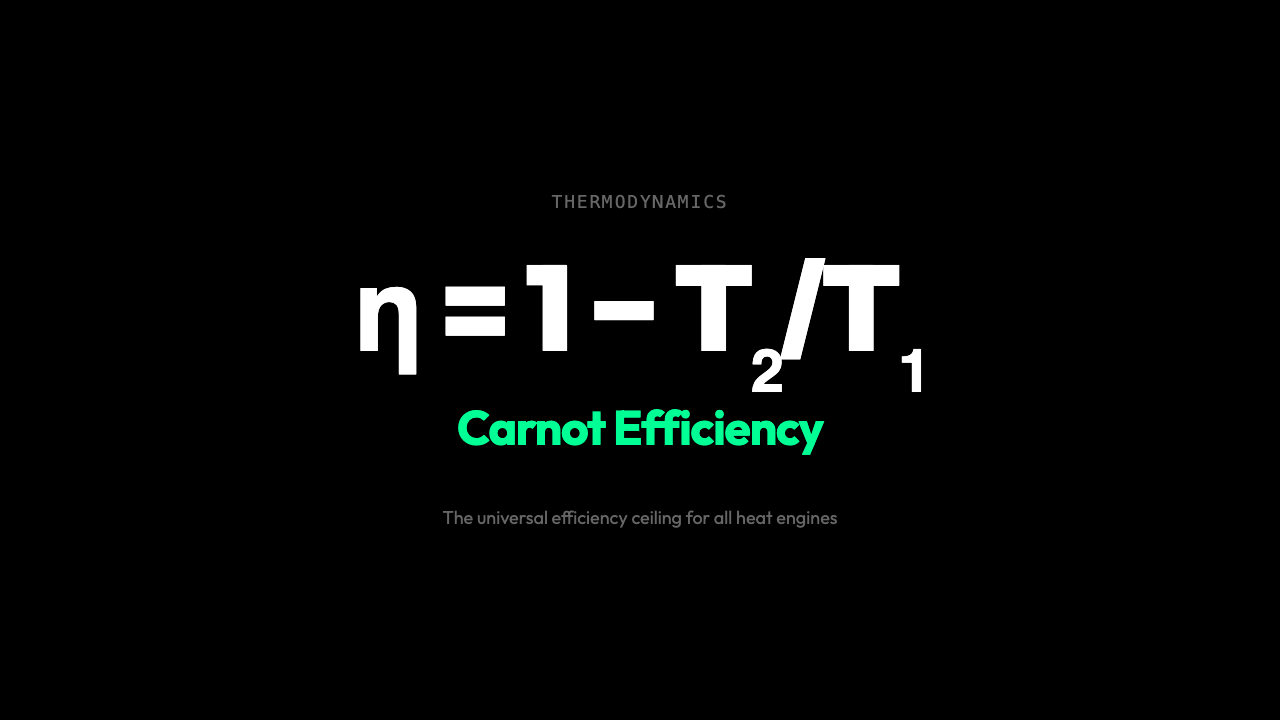
η = 1 − T₂ / T₁
where η is the fraction of absorbed heat that gets converted to work, and temperatures are in Kelvin.
This single equation is the Carnot efficiency. It tells you the theoretical ceiling — not a target you can get close to with better materials, but the absolute maximum imposed by the second law of thermodynamics.
The Four Strokes: What Actually Happens
On a pressure-volume (P-V) diagram, the Carnot cycle traces a rectangle made of four distinct processes:
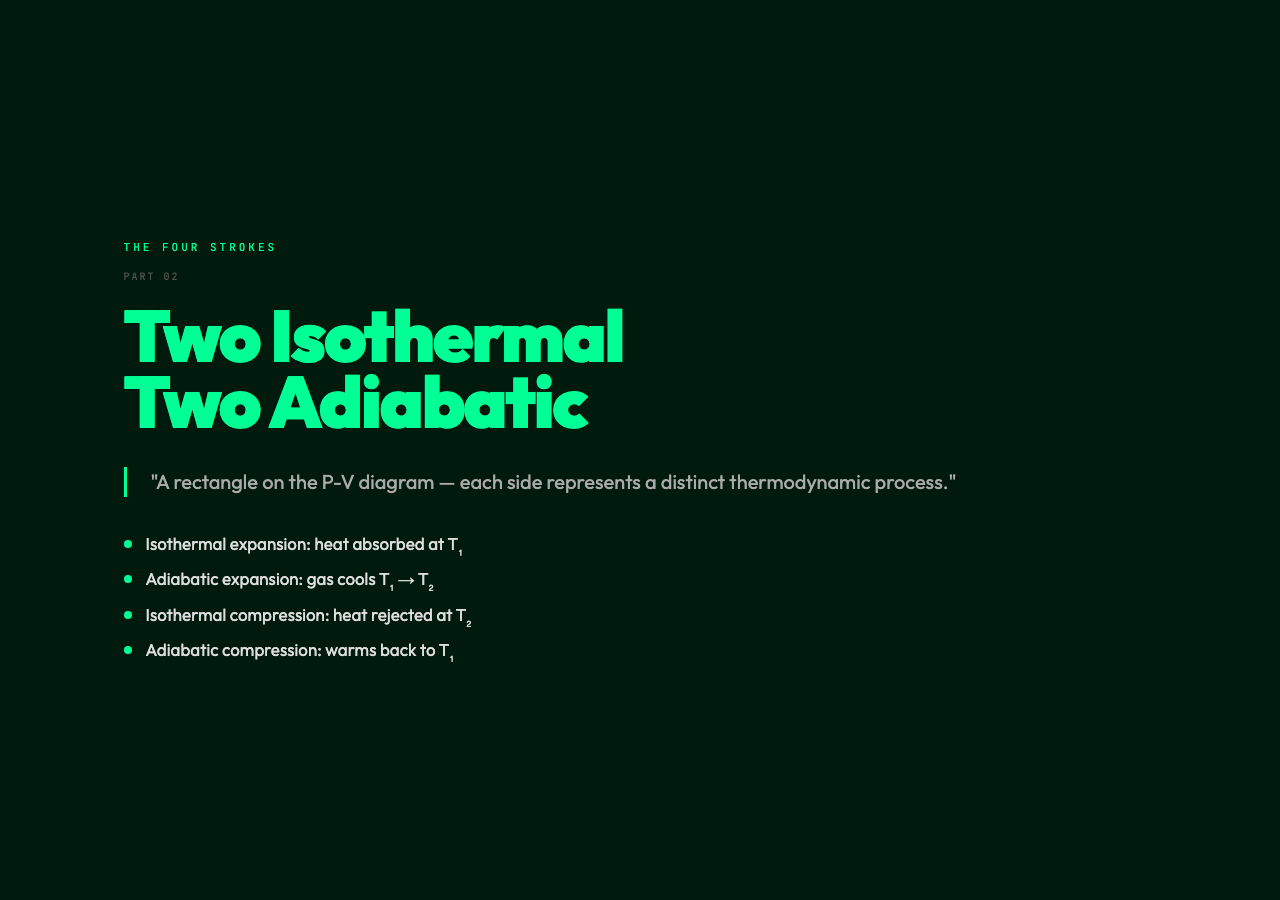
1. Isothermal Expansion (吸热, Heat In) The working substance (often an ideal gas) expands at constant high temperature T₁ while absorbing heat Q₁ from the hot reservoir. The gas does work on its surroundings.
2. Adiabatic Expansion (No Heat Exchange) The gas continues to expand, but now isolated from both reservoirs. It cools as it expands, dropping from T₁ to T₂. More work is done.
3. Isothermal Compression (放热, Heat Out) The gas is compressed at constant low temperature T₂ while rejecting heat Q₂ to the cold reservoir.
4. Adiabatic Compression The gas is compressed further while isolated, warming back from T₂ to T₁. This returns the system to its starting state.
The net work done is the area enclosed by this loop on the P-V diagram.
What the Efficiency Formula Actually Means
Look at η = 1 − T₂/T₁:
– If T₂ = T₁ (both reservoirs at the same temperature), efficiency = 0. No work can be extracted. – If T₂ = 0 K (impossible), efficiency = 1. All heat converts to work. – The greater the temperature difference, the higher the possible efficiency.
This is why real power plants try to maximize the temperature difference between the boiler and the condenser. It is also why internal combustion engines have fundamental limits no amount of engineering can overcome.
The Deeper Point: It Depends Only on Temperature
Carnot’s most surprising result is that the efficiency of a reversible engine depends only on the two reservoir temperatures — not on the working substance, not on the pressure, not on the specific gas or fluid.
Replace the ideal gas with steam, Freon, or any other working fluid. The efficiency formula stays identical. The ceiling is universal.
This is why engineers speak of “Carnot efficiency” as a benchmark. Real engines might achieve 60–70% of it. The gap between actual efficiency and Carnot efficiency tells you how much room remains for improvement.
Irreversibility: Where the Real World Falls Short
The Carnot cycle is a theoretical idealization. Real engines lose efficiency through:

– Friction — mechanical dissipation – Finite-time processes — real expansions and compressions happen in finite time, not infinitely slowly, making them irreversible – Heat losses — some heat leaks to the environment rather than being transferred to the working fluid – Pressure drops — fluid flow through valves and pipes incurs viscous losses
These irreversibilities mean real engines never reach Carnot efficiency. But Carnot tells you why they can’t — and what the structural upper bound is.
The Carnot Engine as a Definition, Not a Design
No one builds a Carnot engine. It would require infinitely slow, perfectly frictionless operation — processes that take infinite time. But it serves a more important role: it is the definition of the thermodynamic performance limit.
In a sense, Carnot gave engineers something more valuable than a better engine. He gave them a ruler.
Explore the Carnot Cycle
The interactive visualization below lets you adjust the hot and cold reservoir temperatures, choose different working substances (monatomic, diatomic, or polyatomic gas), and watch the cycle evolve on a P-V diagram in real time. Watch how the efficiency changes as you move the temperature sliders — and why the shape of the cycle remains the same regardless of the gas type.