Why Two Waves Can Cancel Each Other Out — And What Reappears Instead
The Scene That Shouldn’t Make Sense
Two sources emit identical waves. At some points in space, the crests arrive together and double in strength. At other points, a crest meets a trough and the two vanish entirely — silence, even though neither source has stopped. This is interference, and it is the phenomenon that turned a 19th-century physics classroom into a laboratory for understanding light, sound, and quantum mechanics all at once.
You have seen it before, even if you didn’t name it. The colorful sheen on a soap bubble is interference. The resolution limit of your phone camera is interference. The entire architecture of quantum measurement — the reason an electron can behave like a wave before it behaves like a particle — rests on interference between probability amplitudes. What looks like a curiosity is actually the foundational behavior of anything that waves.
The surprising part is not that interference exists. It is how predictable it is. Once you know the geometry of the sources and the wavelength of the oscillation, you can write down exactly where the bright bands will appear — and where absolute darkness will reign.
How Waves Actually Add Together
When two sources sit side by side and emit synchronized waves, each point in space receives two displacements at once. The net effect is the arithmetic sum of the two. If both displacements push in the same direction, they reinforce. If they push in opposite directions, they cancel.
The math is straightforward. Two point sources separated by distance d both emit waves of wavelength λ. A point on the far-screen at angle θ receives waves that have traveled slightly different paths. The path difference is d sin θ. When this path difference equals an integer multiple of the wavelength — d sin θ = mλ — the crests arrive in lockstep and the amplitude doubles. These are the bright fringes.
When the path difference equals half-integer multiples — d sin θ = (m + ½)λ — a crest meets a trough. The sum is zero. A dark band appears on the screen.
This relationship is called the interference condition, and it governs everything from double-slit experiments to holographic data storage.
The Double-Slit: When Light Becomes a Pattern
The double-slit experiment is the cleanest demonstration of interference. Light passes through two narrow openings separated by a small distance — typically on the order of the wavelength of the light itself. The result is not two bright spots but a succession of bright and dark bands across a screen.
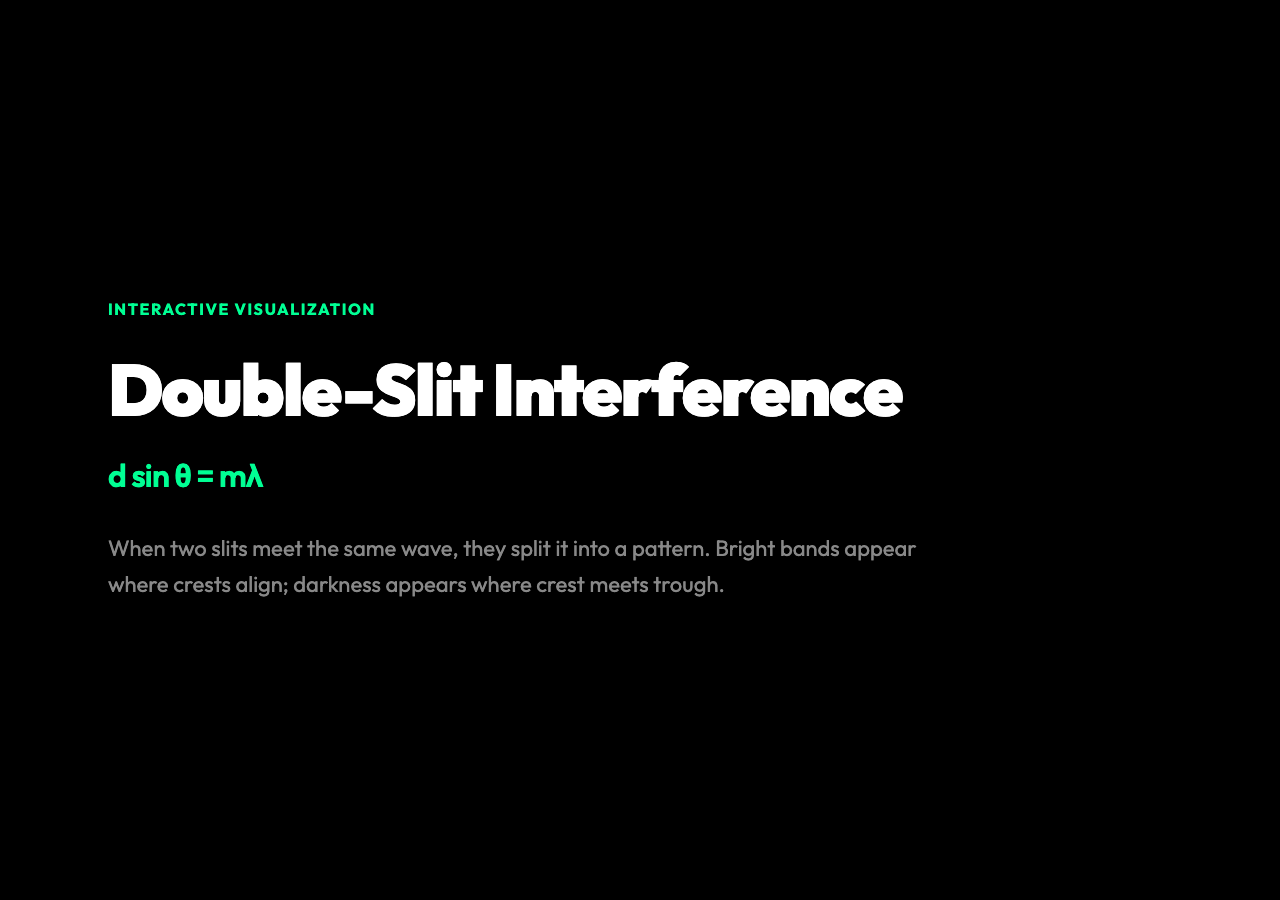
The pattern appears even when the light intensity is turned so low that individual photons are detected one at a time. Each photon arrives at a specific point on the screen. But collectively, the accumulated detections trace out the interference bands. The photon, whatever it is between emission and detection, passes through both slits simultaneously and interferes with itself.
Young’s double-slit experiment (1801) was the first direct evidence that light behaves as a wave. It was also a preview of quantum mechanics — because the exact same geometry, applied to electrons instead of photons, produces the same interference pattern. The phenomenon is not specific to light. It is a property of anything that exhibits wave behavior.
Triple-Slit and N-Slit: More Sources, Sharper Peaks
The double-slit is the canonical case, but adding more sources changes the pattern in a physically significant way. With three equally spaced slits, the bright fringes become narrower and more pronounced. With N slits, the bright peaks become razor-sharp — the main peaks narrow dramatically while the space between them fills with smaller secondary maxima.
This is the principle behind diffraction gratings — physical structures with hundreds or thousands of parallel slits per millimeter. Scientists and engineers use diffraction gratings to separate light into its component wavelengths with extraordinary precision. Spectrometers, laser cavity output couplers, and the anti-counterfeiting strips on banknotes all rely on multi-slit interference.
The key relationship for N slits is that the main maxima occur at the same angle as the double-slit case — d sin θ = mλ — but the intensity of each maximum scales as N². More sources means more collected amplitude and therefore more total energy in each bright fringe.
Coherence: Why Synchronization Is Everything
Interference is only observable when the sources are coherent — meaning they maintain a fixed phase relationship over time. Two independent light bulbs next to each other will not produce an interference pattern, no matter how perfectly you align their slits, because each bulb’s emission is a random succession of wave trains with no stable phase reference.
Lasers are highly coherent sources, which is why laser interferometers (like LIGO, which detected gravitational waves in 2015) can measure distances changes of less than one ten-thousandth of a proton radius. The coherence length of a laser allows the two arms of the interferometer to maintain interference even when their path lengths differ by meters.
For the multi-source interference visualization, coherence is built in — all sources emit in phase. This is the idealization that lets you see the pure geometry of interference without the complication of random phase drift. It is the same idealization that makes the double-slit experiment tractable in a textbook, and it is why the visualization shows crisp, stable fringe patterns rather than washing in and out.
What the Interactive Graph Reveals
The multi-source interference simulation lets you change two variables that reshape the pattern in real time. The wavelength slider changes λ, which changes the spacing between fringes — longer wavelength means wider-spaced fringes. The source spacing slider changes d, which changes the angular separation of the bright bands — wider spacing means narrower fringes.
Changing wavelength (λ) and source spacing (d) independently shows that the interference pattern is controlled by their ratio d/λ. If you double the wavelength with the same slit spacing, the fringe spacing doubles. If you double the slit spacing with the same wavelength, the fringes squeeze together toward the center. This d/λ ratio is the fundamental parameter of interference.
The number of sources slider (N) controls how sharp the peaks are. With N=2, the bright fringes are broad and the secondary maxima between them are relatively bright. With N=5, the main peaks are narrow spikes and the secondary maxima between them almost disappear. This is why diffraction gratings use many slits — you want the light to concentrate into narrow, well-defined peaks rather than spread into a diffuse pattern.
Why This Matters Beyond the Physics Classroom
Interference is not a special-case phenomenon. It appears wherever waves interact, and waves are the language of physics at every scale.
In acoustics, interference between speakers is why concert venue designers carefully model sound propagation — overlapping sound waves can produce dead zones where the audience hears almost nothing. In optics, the compound eyes of insects exploit interference effects to produce iridescent color patterns that serve as camouflage and signaling. In cellular biology, the Golgi apparatus’s layered membrane structure creates interference colors in certain staining protocols, giving diagnosticians clues about cellular health.
At the quantum scale, interference between electron wave functions is the mechanism behind the Aharonov-Bohm effect — where a magnetic field influences an electron’s path even though the electron never enters the field region. This is not a metaphor. The electron’s quantum phase is altered by the vector potential, and this phase shift manifests as a measurable interference pattern when the electron’s path is routed around the field in two different directions.
The Enduring Punch Line
Every interference pattern is a map of the geometry that produced it. The spacing of the fringes tells you the wavelength. The sharpness of the peaks tells you how many sources contributed. The presence or absence of a central maximum tells you whether the sources are in phase or half a wavelength offset.
What began as a wave mechanics curiosity — light fringes on a screen — turned out to be one of the most powerful measuring instruments in physics. The pattern is not a distraction from the physics. It is the physics, encoded in space where you can read it with your eyes.