Why Water Falls Where It Does: The Physics Behind Earth’s Water Cycle
The ocean is losing water tonight. Not visibly — no splashing, no draining — but somewhere above the Pacific, water is rising toward the sky without anyone’s permission. A parcel of seawater absorbs enough solar energy to break its molecular bonds, shifts from liquid to vapor, and keeps going until the temperature drops or the air gives up. This is evaporation, and it is one node in a continuous mechanical system that moves approximately 1.4 × 10⁹ kg of water through the atmosphere every second.
The water cycle is not a metaphor. It is a thermodynamic engine driven by solar radiation, governed by the latent heat of vaporization, and shaped by everything from ocean temperature to the slope of a mountainside. Understanding why rain falls where it does — and why that pattern is shifting — requires following the physics step by step.
Solar Energy as the Engine
The sun supplies roughly 1.74 × 10¹⁷ watts to Earth each year, and the water cycle captures a meaningful fraction of that. The critical number is latent heat of vaporization: 2,260 kJ/kg — the amount of energy required to turn 1 kilogram of liquid water into vapor at 100°C. At lower temperatures, the cost is even higher. At 20°C, the enthalpy of vaporization sits around 2,450 kJ/kg.
This energy is not lost when the vapor condenses. It is released back into the environment as latent heat of condensation, warming the surrounding air. This heat release drives atmospheric circulation — the rising air cools, condensation continues, and the cycle reinforces itself. A cumulus cloud is partly a thermal engine running on released vapor heat.
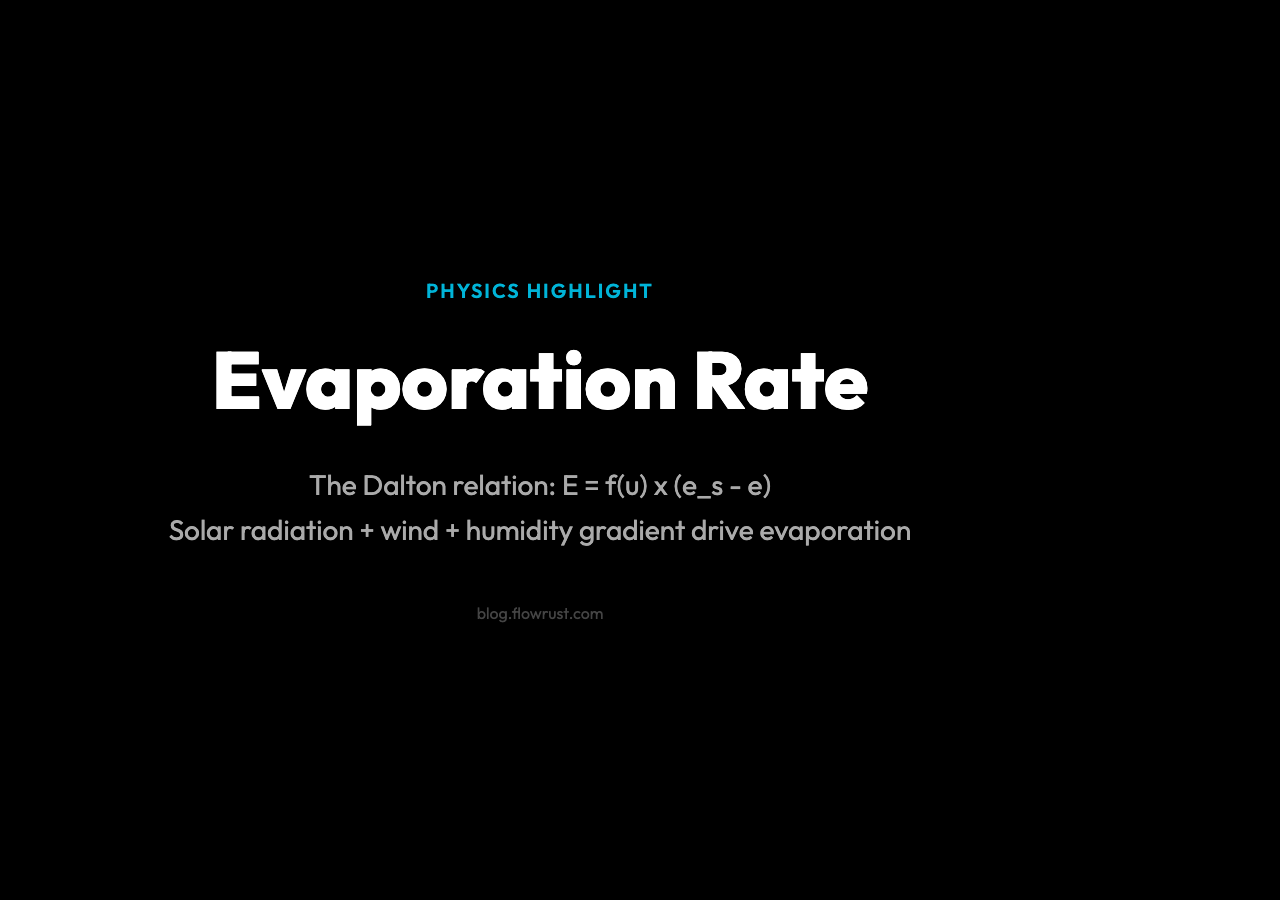
The rate of evaporation depends on more than just temperature. The Dalton type relation captures the key variables:
E = f(u) × (e_s − e)
Where E is evaporation rate, f(u) is a wind speed function, e_s is saturation vapor pressure, and e is actual vapor pressure. Higher wind accelerates evaporation by stripping vapor molecules from the surface. Lower humidity (a smaller e_s − e gap) slows it. The simulation exposes these relationships interactively: drag the solar radiation slider, change the temperature, adjust wind speed — and watch the evaporation particle count respond in real time.
Condensation and the Cloud Formation Problem
Water vapor condenses into droplets when air cools below its dew point. The dew point is the temperature at which the air becomes saturated — relative humidity hits 100%, and further cooling forces vapor to become liquid.
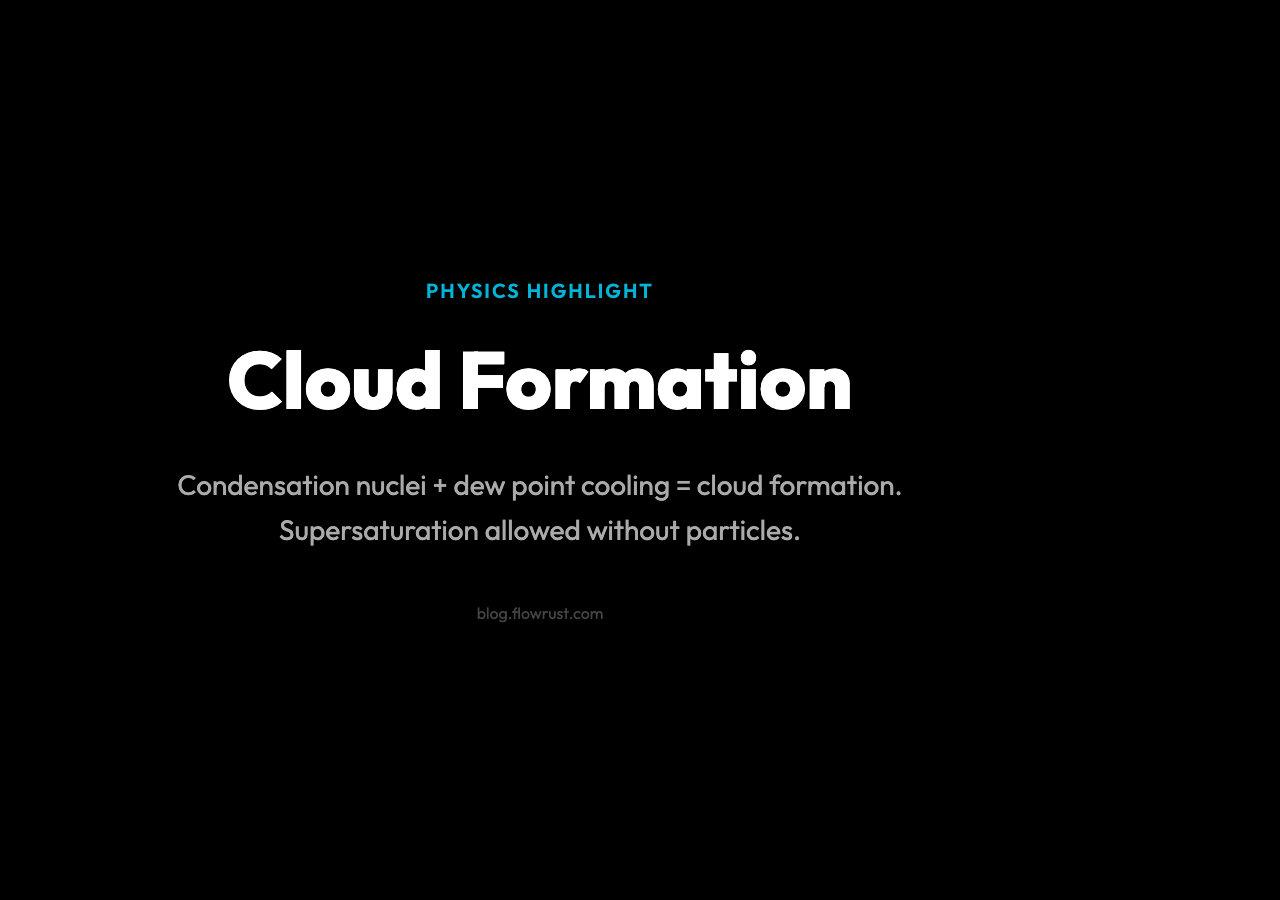
The catch: pure water droplets need a surface to condense on. In the atmosphere, this role is played by condensation nuclei — microscopic particles: dust, sea salt, pollen, industrial aerosol. Without them, water vapor can remain Supersaturated to relative humidity well above 100% before condensing spontaneously. This is why cloud seeding with silver iodide works: it provides extra nuclei that trigger condensation at lower humidity levels.
In the simulation, condensation appears as cloud particles forming at altitude. The cloud color shifts with density — more particles mean a whiter, brighter cloud. Real clouds operate the same way: thicker clouds scatter more light and appear brighter, which is partly why an overcast sky looks white rather than transparent.
Precipitation: When Gravity Wins
For rain to fall, condensation droplets must grow large enough that gravity overcomes updrafts. The critical threshold is a droplet radius of roughly 0.1–0.5 mm — below this range, surface tension keeps droplets small and light, and they stay suspended.
The two primary growth mechanisms:
Collision–coalescence: Larger droplets fall faster and collide with smaller ones along their path, accumulating mass quickly. This dominates in warm clouds (above freezing throughout) and produces rain within 20–30 minutes of cloud formation.
Bergeron process: In mixed-phase clouds (with both ice crystals and supercooled water droplets), ice grows at the expense of surrounding vapor (since the saturation vapor pressure over ice is lower than over water). Ice crystals eventually become heavy enough to fall, melting into rain as they descend through the melting layer. This process is slower but produces more sustained precipitation and operates at higher altitudes.
The simulation’s precipitation intensity slider controls how aggressively the condensation produces rain particles — reflecting how cloud thickness and vertical velocity determine whether a cloud produces light drizzle or a downpour.
Runoff and Groundwater: The Downhill Half
Once precipitation hits the ground, gravity takes over again. Water follows the shortest path down: over the surface as sheet flow, concentrating into streams and rivers as overland flow, or infiltrating into the soil as infiltration. The split between runoff and infiltration depends on soil type, vegetation cover, and the saturation state of the surface.
The infiltration capacity of soil follows the Green–Ampt model, which describes how water moves into a wetted front:
f(t) = K × [1 + (ψ × Δθ) / F(t)]
Where f(t) is infiltration rate, K is hydraulic conductivity, ψ is soil suction head, Δθ is water content difference, and F(t) is cumulative infiltration. Initially dry soil infiltrates quickly, then slows as the front wets and the hydraulic gradient decreases.
In the simulation, the human impact toggles — deforestation, urbanization, water withdrawal — directly affect this split. Removing vegetation reduces interception (the canopy’s ability to catch rainfall before it hits the ground) and reduces transpiration, which normally pumps water back into the atmosphere. Urbanization creates impermeable surfaces that eliminate infiltration entirely, increasing flood runoff.
The Residence Time Perspective
One of the most useful numbers in water cycle physics is residence time: how long a water molecule spends in a given reservoir before being transferred to the next stage.
| Reservoir | Approximate Residence Time |
|---|---|
| Atmosphere | 9 days |
| Rivers and lakes | 2–3 weeks |
| Soil moisture | 1–2 months |
| Groundwater (shallow) | 1–10 years |
| Groundwater (deep) | 10,000+ years |
| Oceans | 3,000–4,000 years |
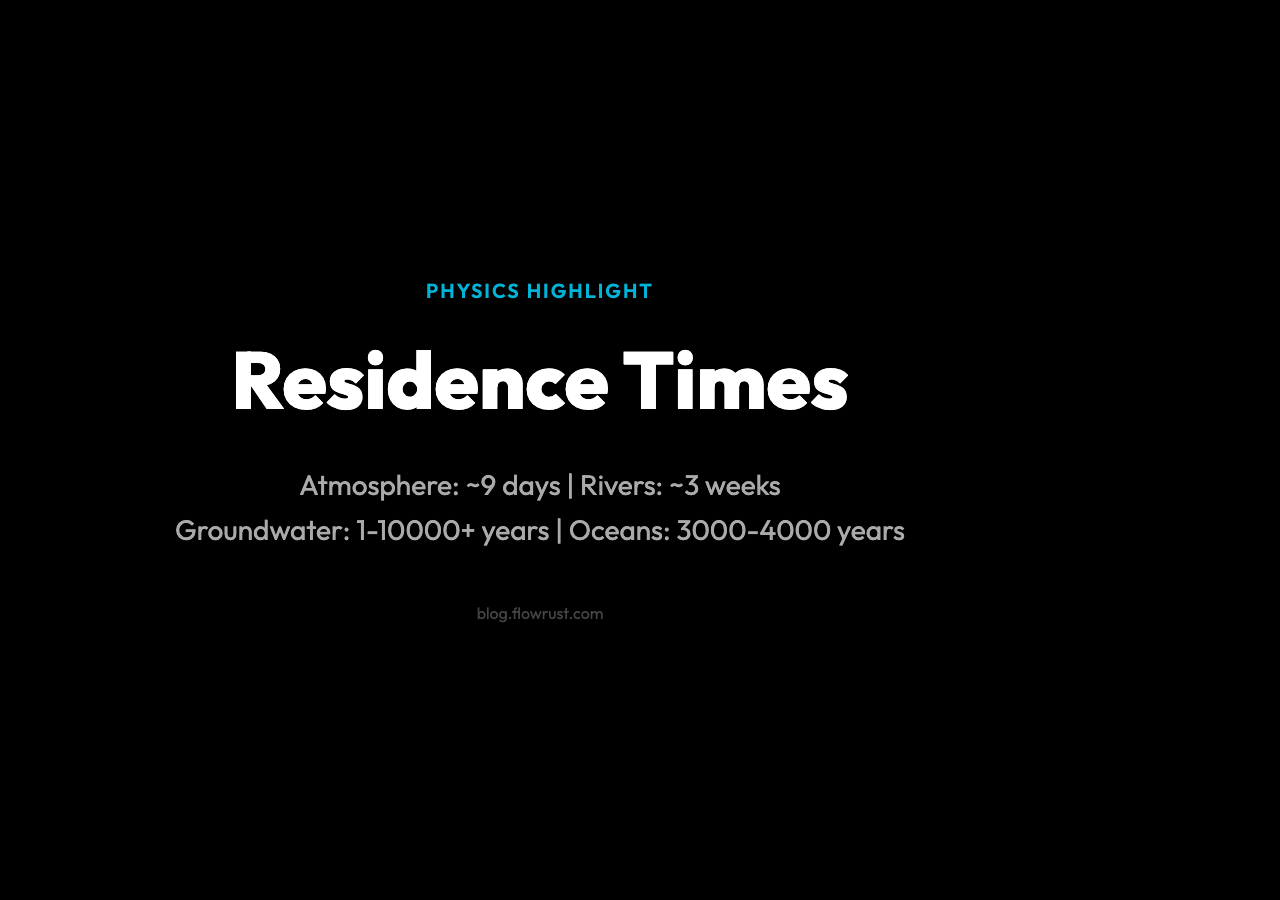
The short atmospheric residence time is what makes the water cycle so sensitive to perturbation. A molecule evaporated today could rain out next week anywhere within a mid-latitude storm track. Changes in ocean temperature, vegetation cover, or aerosol loading alter evaporation rates and atmospheric circulation — and those changes show up in precipitation patterns within a season or two.
What the Interactive Simulation Reveals
The value of the water cycle simulation is not just showing that evaporation, condensation, and precipitation happen — it is showing how the parameters interact. Push solar radiation up and evaporation accelerates immediately. Increase humidity and the condensation rate changes. Toggle climate change and watch the particle balance shift across years of simulated time.
The coupling is what makes the system physically interesting and practically important. You cannot adjust one slider in isolation; every change propagates through the cycle because the inputs and outputs are physically linked. Solar radiation increases → more evaporation → more atmospheric moisture → potentially more precipitation, but also depending on wind patterns and temperature gradients, that moisture may be transported hundreds of kilometers before condensing.
This interconnectedness is also why climate models struggle with regional precipitation predictions. The global water cycle is well understood as a budget — evaporation equals precipitation over the ocean, and the atmospheric transport bridges the gap. But regional distribution depends on mesoscale circulation patterns, topography, and land-use change in ways that remain difficult to resolve.
Why the Water Cycle Is the Climate’s Most Visible Variable
When scientists talk about climate change intensifying the water cycle, the statement has a specific physical meaning: a warmer atmosphere holds more moisture (approximately 7% more per degree Celsius via the Clausius–Clapeyron relation), which increases both evaporation rates and precipitation intensity. The atmosphere can hold more water vapor, so when it rains, it rains harder. When it does not rain, the higher temperature accelerates surface drying.
The water cycle is the climate system in motion. Its physics — the energy cost of vaporization, the mechanics of condensation, the gravity-driven flow of runoff — encode everything the atmosphere and surface are doing. Watching a simulation run through different climate scenarios makes that connection concrete.
The water molecule evaporated from the Pacific this morning may fall as snow in the Himalayas next spring. The path it takes through the atmosphere is the climate’s fingerprint, and the water cycle simulation traces that fingerprint with equations that are among the most reliable in environmental science.