

Estimate first, access second. The osmolality of a parenteral nutrition admixture is the single number that decides whether a patient gets a peripheral cannula, a PICC line, or a central venous catheter — and the formula to compute it is one short sum that fits on a sticky note. The catch is that the formula has three real failure modes (denominator confusion, double-counting lipid, and the calcium-phosphate solubility hole that osmolality never sees), and most spreadsheets that compute it get at least one wrong.
This guide walks through the TPN Osmolality Estimator from first principles: how the Osm ≈ Dextrose(g/L)×5.0 + Amino acids(g/L)×10.0 + Electrolyte additive identity actually behaves when a real pharmacy worksheet goes in, why the 900 / 1200 mOsm/L peripheral-vs-central thresholds are consensus not law, and the four checks you should run on any osmolality number before you trust it for an access decision. The whole computation runs in the browser — no PHI leaves the tab — so you can iterate against a real admixture on the screen and read the threshold that decides the access route as you change the dextrose concentration.
What the formula actually computes
TPN osmolality is a sum-of-solute calculation, not a measurement. Each dissolved component contributes proportionally to its molar concentration; the empirical factors 5.0 for dextrose and 10.0 for amino acids already absorb the dissociation and hydration effects for typical clinical concentrations, so you do not need to multiply by the number of particles. The third term is everything else — sodium, potassium, calcium, magnesium, phosphate, acetate — handed to the calculator as a single Electrolyte additive (mOsm/L) value you either measure on the source-bag label or sum from each individual electrolyte.
A typical central TPN admixture lands at 1500–2000 mOsm/L, which is roughly five to seven times the osmolality of plasma (~285 mOsm/L). That gap is the whole reason central venous access exists: peripheral veins tolerate ~900 mOsm/L before phlebitis risk rises sharply, and short peripheral cannulas will thrombose well before they reach the central concentration. The numeric thresholds are empirical and institution-dependent — most adult protocols use 900 mOsm/L as the upper peripheral limit with PICC/midline as the gray zone up to 1200 mOsm/L, and central venous access above 1200 mOsm/L. Neonatal and pediatric thresholds are tighter still. The TPN Osmolality Estimator prints the verdict alongside the number so you see the access decision without computing it in your head.
The denominator trap (and why lipid changes everything)
The single most common bug in handwritten osmolality calculations is forgetting that the formula divides by the aqueous volume, not the total volume. Dextrose and amino acids dissolve in the water phase; lipid emulsion is a separate phase and contributes ~0 mOsm/L to the aqueous solution. If you treat the total bag volume as the denominator, you understate the aqueous-phase concentrations and get an osmolality that is too low by 5–15 percent.
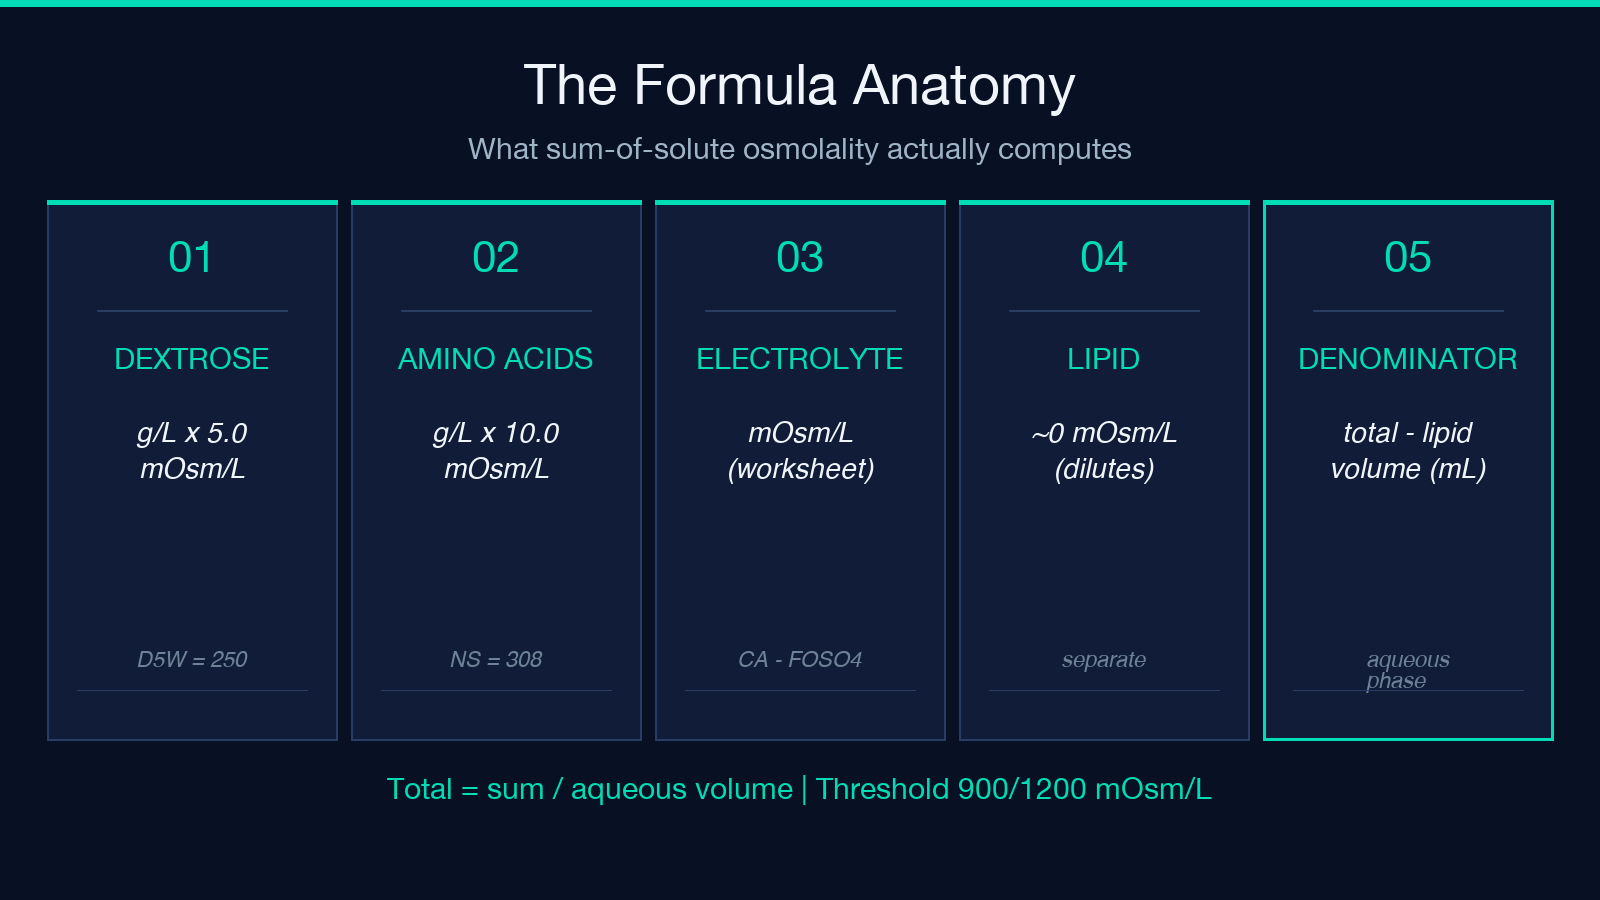
The correct denominator is total volume - lipid volume. A 2-in-1 admixture (dextrose + amino acids, no lipid) uses the full volume; a 3-in-1 admixture (all-in-one with lipid) uses the aqueous phase only. The calculator’s Lipid volume (mL) input exists exactly so you do not silently make this error. For reference, a typical 20 percent lipid emulsion is itself near-iso-osmolar with plasma at ~270–350 mOsm/L, so it does not raise the aqueous osmolality — it dilutes the apparent concentration of everything that dissolved in the water.
Why electrolytes are a single number, not a sum
The third term collapses the entire electrolyte additive into one input for a reason: a real TPN worksheet contains six to twelve individual electrolytes (sodium chloride, sodium acetate, potassium chloride, potassium phosphate, calcium gluconate, magnesium sulfate, trace elements) and the order of mixing matters for stability. The standard clinical practice is to read the cumulative electrolyte osmolality off the compounding-pharmacy worksheet as one number, not to re-derive it from the individual salts every time you change the dextrose concentration.
This keeps the osmolality estimator aligned with how pharmacy actually documents the admixture. If you have the individual salts and you want a from-scratch number, multiply each salt’s mOsm/L by its bag volume in liters and divide by the aqueous volume — but expect that to disagree with the lab-measured freezing-point depression value by 100–200 mOsm/L on a real admixture. The sum-of-solute approximation is good to within that band, which is why the TPN Osmolality Estimator flags the output as an estimate, not a measurement.
Reference values that anchor the threshold
A few landmarks make the threshold numbers feel less arbitrary. D5W (5 percent dextrose in water) is ~250 mOsm/L — peripheral-vein-friendly. D10W is ~505 mOsm/L — still peripheral. Normal saline is ~308 mOsm/L. Plasma itself is ~285 mOsm/L. A peripheral-borderline admixture is whatever it takes to push the number past 900 mOsm/L; a typical central TPN is 1500–2000 mOsm/L; an adult total-parenteral-nutrition admixture can hit 2500+ mOsm/L on a high-dextrose ICU mix.
If you want a hands-on feel for the threshold, plug the following into the TPN Osmolality Estimator and watch the verdict change as you move the dextrose concentration: 500 mL D25W + 500 mL 10 percent amino acids + 100 mL 20 percent lipid + 250 mOsm/L electrolyte additive. D25W → D40W → D50W sweeps the same recipe from peripheral-borderline to central-clearly-required in three clicks, and the printed threshold tells you which access route applies at each step.
The calcium-phosphate hole (and why osmolality will not catch it)
Osmolality tells you whether the vessel can tolerate the admixture. It does not tell you whether the admixture itself is stable. Calcium and phosphate precipitate as calcium-phosphate when their product exceeds the solubility limit at the admixture’s pH, and the resulting microcrystals — when infused through a central line — are an embolism risk on par with a misplaced catheter. The solubility limit depends on the amino acid concentration (higher AA lowers the free calcium), the temperature, and the order of mixing; it is not a fixed number.
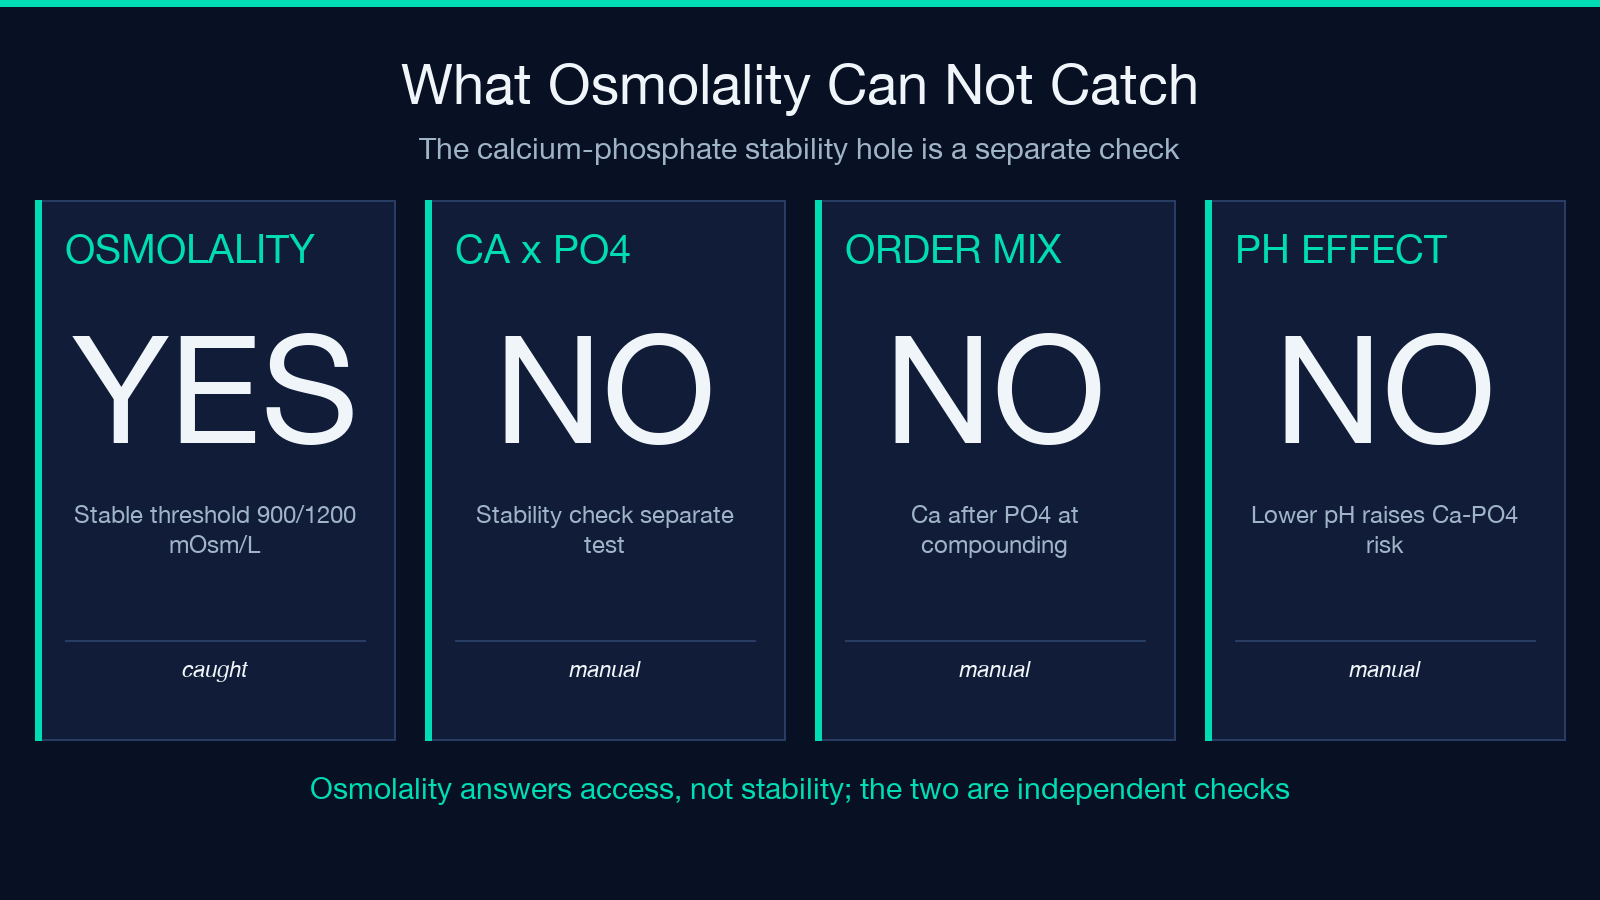
Any osmolality-only calculator, including the TPN Osmolality Estimator, is silent on calcium-phosphate. A separate stability check against the calcium × phosphate product at the admixture’s amino acid concentration is required for any high-electrolyte or neonatal admixture. Mirtallo 2004 and the ASPEN safe-practice guidelines lay out the order-of-mixing and the calcium-phosphate product curves; the calculator is one of two checks, not a substitute for the other.
When the lab-measured value will disagree with the estimate
The freezing-point depression osmometer is the gold standard, and it is what the pharmacy actually records on the compounding worksheet. The sum-of-solute estimate is good to within 100–200 mOsm/L on a typical adult admixture, but the gap widens on high-electrolyte and neonatal admixtures for two reasons: the empirical factors 5.0 and 10.0 are average values, and the electrolyte additive is itself an estimate.
When the calculator’s output disagrees with the lab by more than ~15 percent, the right move is to read the lab number off the worksheet rather than the estimate. The TPN Osmolality Estimator is built for the estimate-only case: when you do not have access to a lab measurement, or you are iterating against a recipe change before sending it to the pharmacy. It is not the right tool to override a measured value.
The four checks before you trust an osmolality number
Run these four checks against any osmolality output before you act on the access-route verdict. They take about thirty seconds and they catch every common failure mode.
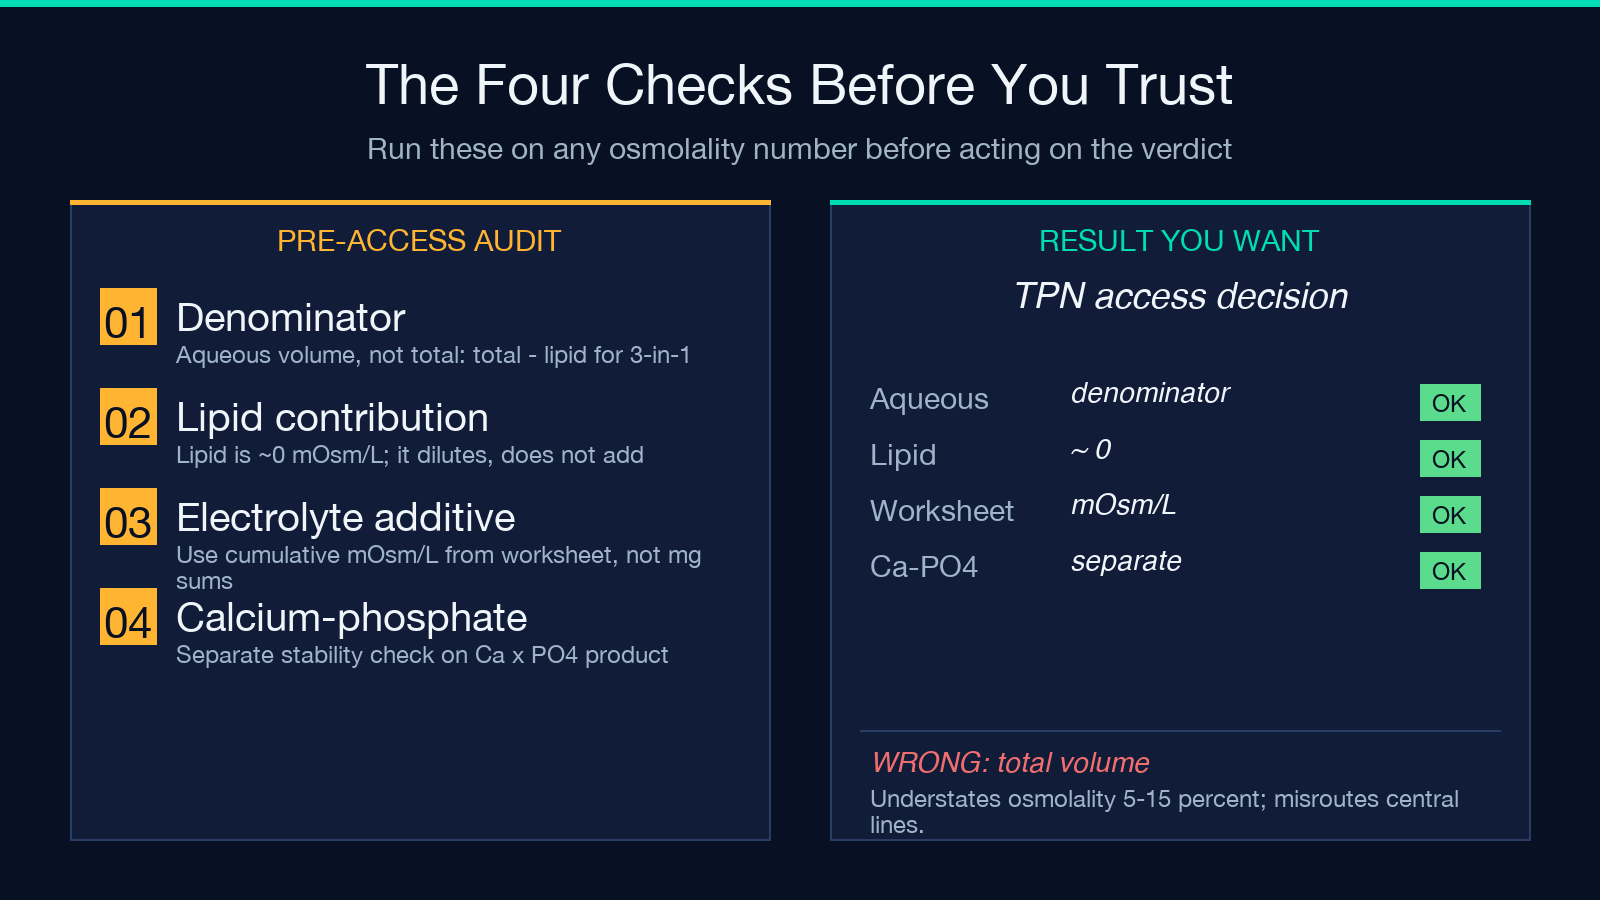
First, confirm the denominator is the aqueous volume, not the total volume — total - lipid for a 3-in-1 admixture, total for a 2-in-1. Second, confirm the lipid contribution is treated as ~0 (the calculator does this automatically when you fill Lipid volume (mL)). Third, confirm the electrolyte additive is the cumulative mOsm/L from the pharmacy worksheet, not the sum of individual electrolyte milligrams — the latter understates the value because individual salts dissociate differently than their mOsm/L label implies. Fourth, confirm the calcium-phosphate product is in range separately — osmolality is not a stability check.
A clean run of those four on a typical adult 2-in-1 admixture lands within 10–15 percent of the lab value, which is close enough for an access decision but worth flagging to the reader. The calculator is auditable for the formula but not for the input recipe quality, which is on you.
Putting it together: when the access decision flips
The clearest use case for the TPN Osmolality Estimator is the access-decision flip. Start with a working adult admixture at the upper end of peripheral tolerance (~850 mOsm/L, borderline). Bump the dextrose concentration from D25W to D40W to feed a hypermetabolic ICU patient and watch the number cross 1200 mOsm/L in the next iteration — the printed verdict flips from borderline PICC/midline to central venous access. The whole loop takes about thirty seconds, and the threshold change is visible in the same view as the inputs.
This is also where the calculator’s featured access verdict earns its keep. The numeric osmolality is the headline; the access verdict is the actionable summary. Both come out of the same calculation, but the second is what the prescriber, the pharmacist, and the nurse need to see at the same time. You can read more about TPN admixture stability and the access-threshold rationale in Pittiruti 2009 (peripheral vs central in adult TPN) and the 2020 ASPEN safe-practice update; the TPN Osmolality Estimator is a fast what-if layer over those guidelines, not a replacement for them.
Explore more tools at elysiatools.com.
