
Most clinical calculators give you a number without telling you where it broke. The alveolar gas equation is the rare exception: it forces every assumption to the surface. FiO₂, barometric pressure, water vapor pressure, respiratory quotient, PaCO₂ — five inputs, one output, and every one of them is a clinical decision. A patient at sea level on room air has a baseline PAO₂ around 100 mmHg. The same patient at 3,000 m on a non-rebreather collapses to a different number, and the math tells you exactly why. This field guide walks through the equation, the defaults you should challenge, and the failure modes that turn a 100 into a 50 without any error message.
The alveolar gas equation is short. The clinical reasoning behind each input is not.
The Five Inputs and What Each One Does
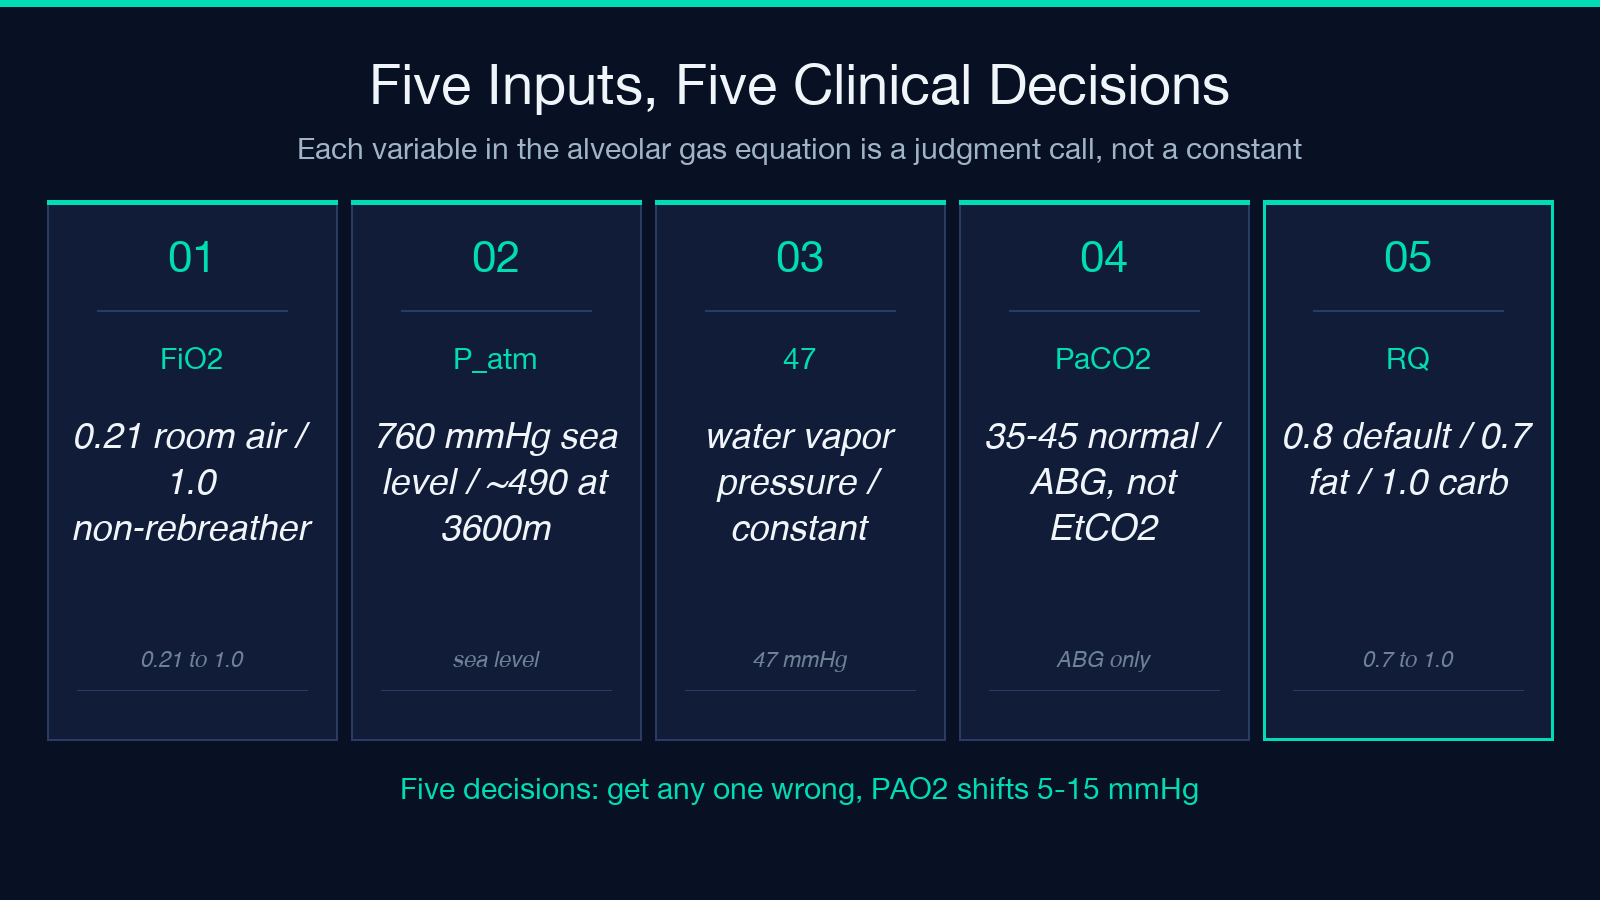
The canonical form: PAO₂ = FiO₂ × (P_atm − 47) − PaCO₂ / RQ. Each variable carries a clinical workload.
FiO₂ is the fraction of inspired oxygen, expressed as a decimal — 0.21 for room air, 1.0 for a sealed non-rebreather mask on 15 L/min oxygen, 0.40 for a simple nasal cannula at 4 L/min. The naive guess is that doubling FiO₂ doubles alveolar oxygen. It does not, because the term is multiplied by a pressure difference that itself shrinks at altitude.
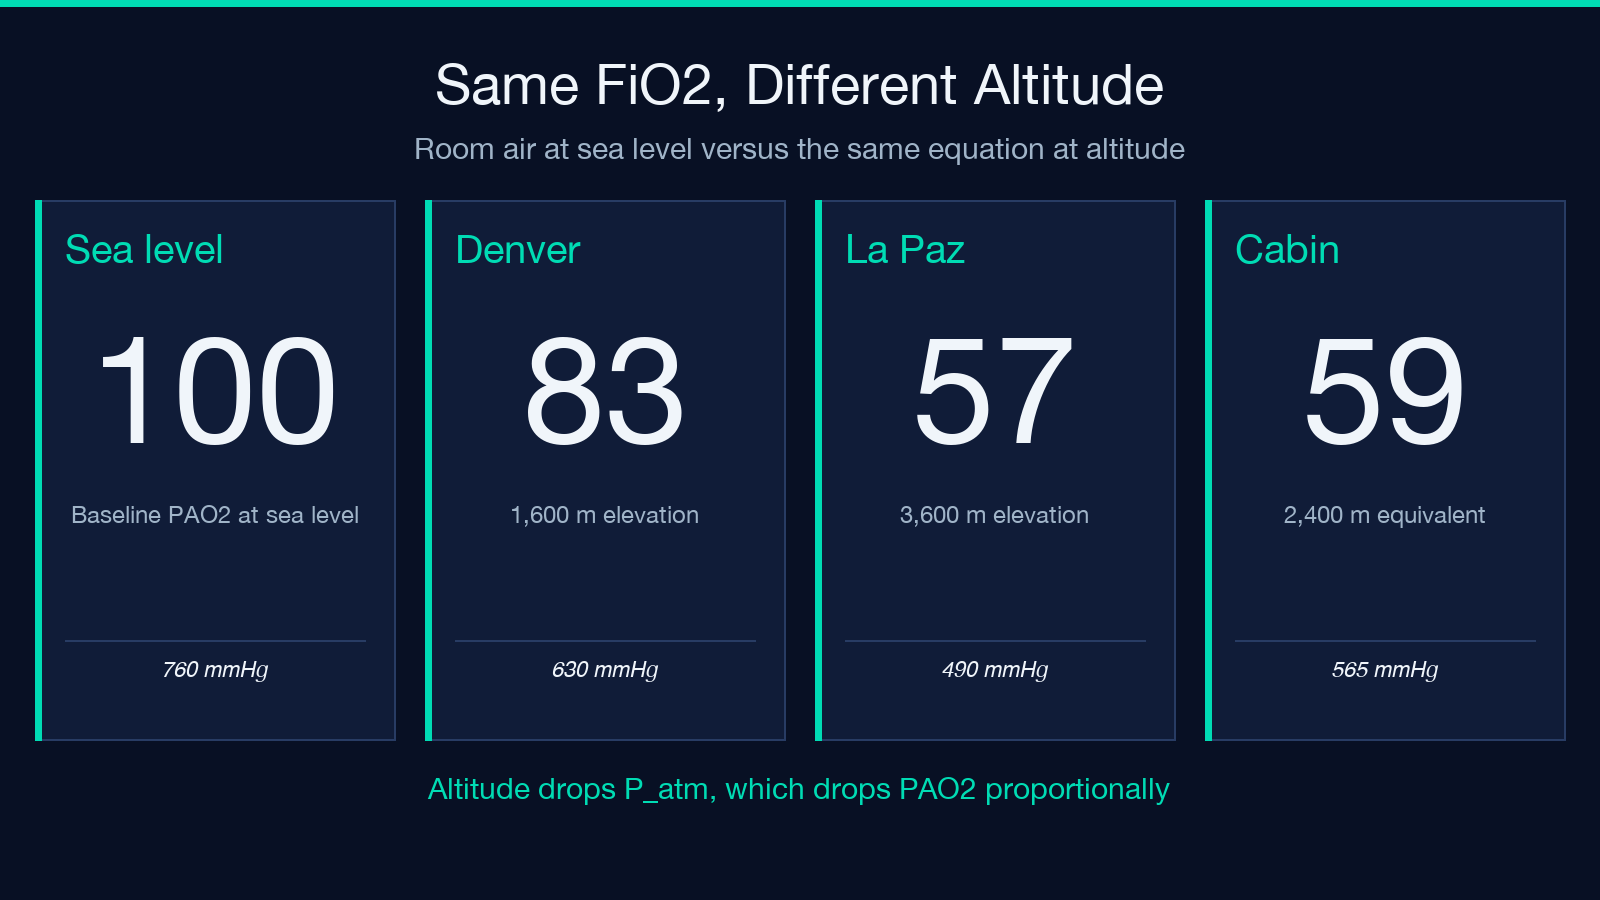
P_atm is barometric pressure. The default is 760 mmHg at sea level. Every 1,000 m of altitude drops P_atm by roughly 75 mmHg. At Denver (1,600 m) P_atm is about 630 mmHg; at La Paz (3,600 m) it is closer to 490 mmHg. The (P_atm − 47) term reflects the partial pressure of water vapor at body temperature, which is treated as a constant 47 mmHg regardless of altitude. This is a model simplification, not a measured value.
PaCO₂ is the arterial partial pressure of carbon dioxide, normally 35–45 mmHg. The division by RQ captures the metabolic CO₂ production rate relative to O₂ consumption.
RQ is the respiratory quotient — typically 0.8 for a mixed diet, 1.0 for pure carbohydrate metabolism, 0.7 for pure fat oxidation. A septic patient on a lipid-heavy parenteral nutrition regimen runs closer to 0.7; a DKA patient metabolizing ketones runs closer to 0.8–0.9. The default 0.8 is correct in 70% of ward patients and wrong in 30%.
Open the tool at Elysia Tools and the five inputs sit on a single screen with the output below them. The altitude toggle between sea level and a custom millimeter-of-mercury value is the most-clicked feature.
Why the Sea Level 100 mmHg Baseline Is a Coincidence
Run the equation at sea level, room air, normal PaCO₂, and RQ 0.8:
PAO₂ = 0.21 × (760 − 47) − 40 / 0.8 = 0.21 × 713 − 50 = 149.7 − 50 = 99.7 mmHg.
That is the famous “100 mmHg” number. It is not a physiologic constant. It is the arithmetic output of four assumptions stacked on each other. Change any one of them and the number moves.
Lift the same patient to 2,500 m. P_atm drops to about 560 mmHg. The same calculation gives PAO₂ = 0.21 × (560 − 47) − 50 = 0.21 × 513 − 50 = 107.7 − 50 = 57.7 mmHg. The alveolar oxygen pressure has nearly halved, and FiO₂ has not changed at all. The mountain did it.
What most calculators do not show you is the decomposition — which term contributed how much. The tool at Elysia Tools breaks the calculation into the FiO₂×pressure component and the CO₂/RQ component, so you can see the tradeoff directly.
The Respiratory Quotient Default and When to Override It
The 0.8 default is so widely used that most clinicians have forgotten it is an assumption. It is the weighted average of carbohydrate (RQ 1.0), fat (RQ 0.7), and protein (RQ 0.8) oxidation on a typical Western diet. Three populations where 0.8 is wrong:
Pure carbohydrate feeders (TPN patients on dextrose-only, post-prandial ICU patients): RQ can transiently hit 1.0 or above. At RQ 1.0 with everything else equal, PAO₂ = 149.7 − 40 = 109.7 mmHg — a 10 mmHg upward shift from the 0.8 default.
Ketotic patients (DKA on insulin, starvation ketoacidosis, ketogenic diet): RQ drops to 0.7. The same calculation gives PAO₂ = 149.7 − 57.1 = 92.6 mmHg. A 7 mmHg downward shift.
Hypercapnic patients with elevated metabolic CO₂ production: the PaCO₂/RQ term grows because PaCO₂ itself is the numerator variable. This is the case where RQ becomes second-order — the PaCO₂ shift dominates.
The default keeps things simple. Override it when the metabolic state is known and not “average”.
What the A–a Gradient Tells You Once You Have PAO₂
PAO₂ alone is half a calculation. The other half is the alveolar–arterial gradient: A–a = PAO₂ − PaO₂ (where PaO₂ is measured from an arterial blood gas). A normal A–a gradient for a young adult on room air is 5–15 mmHg. It widens with age — the rule of thumb is that A–a should be less than (age / 4) + 4.
A patient with PAO₂ = 100 mmHg but PaO₂ = 60 mmHg has an A–a gradient of 40 mmHg — wide, suggesting V/Q mismatch, shunt, or diffusion impairment. A patient with PAO₂ = 100 mmHg and PaO₂ = 95 mmHg has an A–a gradient of 5 mmHg — narrow, suggesting the hypoxemia is purely hypoventilation (high PaCO₂, normal lungs).
The two failure modes look identical on a pulse oximeter (SpO₂ 88% in both) and require the alveolar gas equation plus a measured PaO₂ to distinguish. The tool gives you PAO₂; the blood gas gives you PaO₂; the subtraction gives you the answer. No single input alone is sufficient.
Altitude, FiO₂, and the Cabin Pressure Trap
Commercial aircraft cabin pressure is typically equivalent to 1,800–2,400 m altitude, meaning P_atm of about 600–565 mmHg. A patient with chronic lung disease flying home from a holiday can drop their PAO₂ by 30 mmHg simply from the cabin pressure change. The math:
PAO₂_cabin = 0.21 × (565 − 47) − 40 / 0.8 = 108.7 − 50 = 58.7 mmHg.
For a healthy 30-year-old with PaO₂ of 95 mmHg at sea level, this gives an A–a gradient of 36 mmHg — outside the normal range. For a 70-year-old with COPD and a sea-level PaO₂ of 75 mmHg, the cabin pressure pushes them into respiratory failure territory.
This is why pre-flight oxygen assessments use the alveolar gas equation with the destination cabin pressure, not the origin airport pressure. The tool at Elysia Tools accepts a custom P_atm value in mmHg so you can model any altitude directly. Plug in 565 mmHg and the math reflects the cabin environment.
Common Failure Modes and How to Read Them
Three failure modes account for most of the “this number looks wrong” moments:
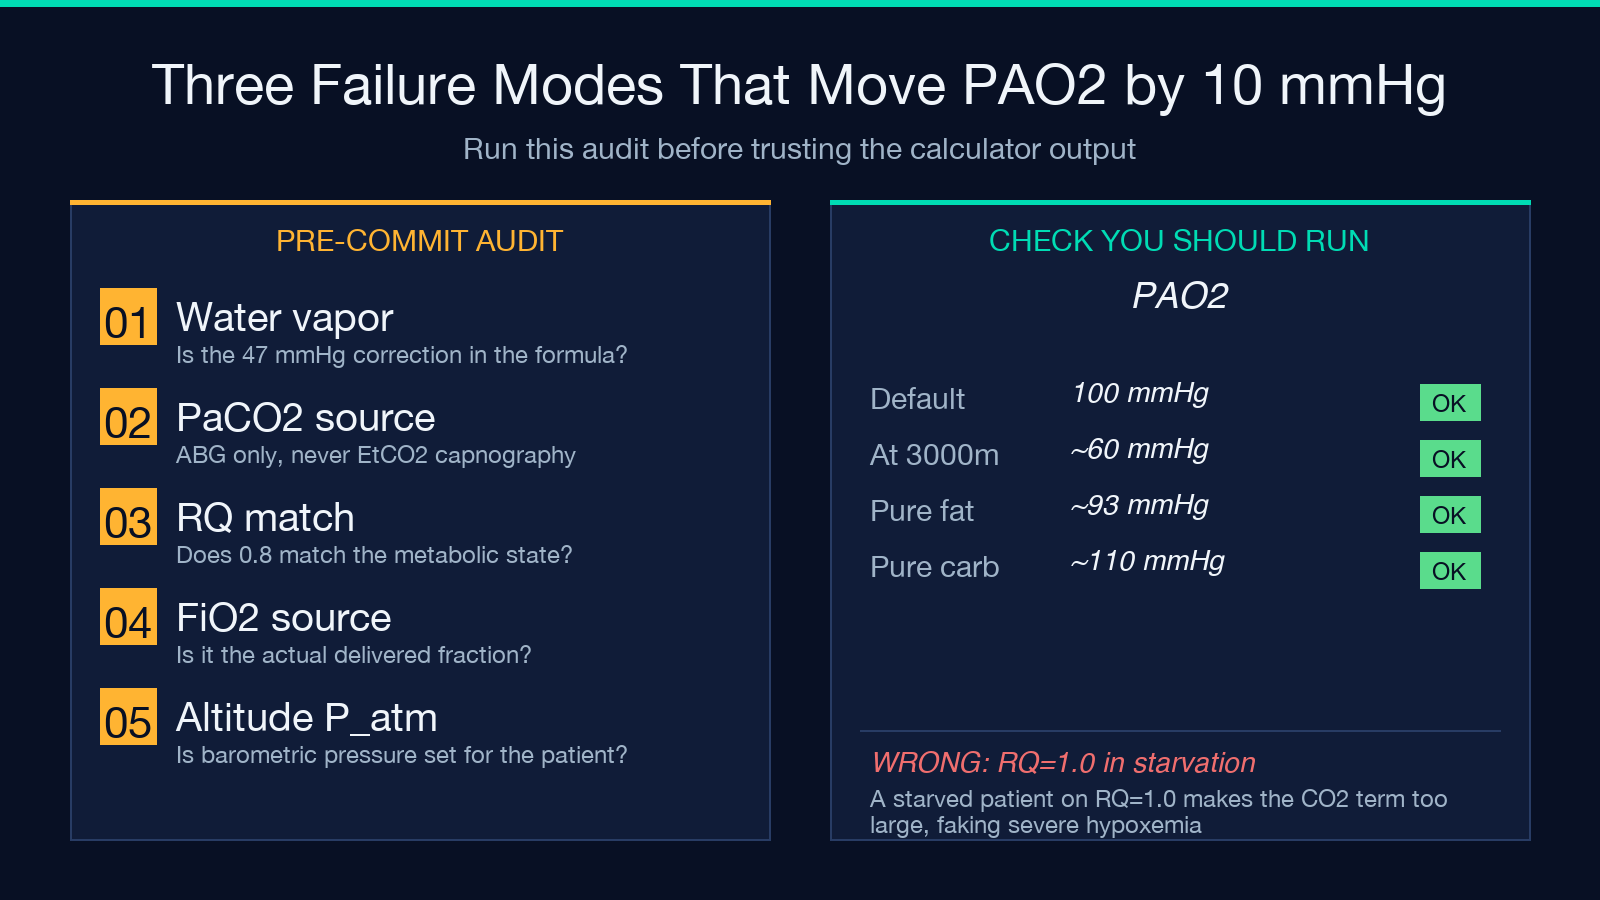
Failure 1 — forgetting the water vapor correction. The equation subtracts 47 mmHg regardless of altitude because water vapor pressure at body temperature is roughly constant. A calculator that does not subtract 47 gives a PAO₂ that is 47 mmHg too high for every patient. Always confirm the 47 is in the formula.
Failure 2 — using PaCO₂ when the patient is on the ventilator. Ventilator patients have measured PaCO₂ values from ABG; their FiO₂ is the set fraction. The equation still works. The failure comes from using end-tidal CO₂ (EtCO₂) instead — EtCO₂ underestimates PaCO₂ by 2–5 mmHg normally, more in COPD, and the PAO₂ output is wrong by an equivalent amount.
Failure 3 — using an RQ of 1.0 in a starved patient. A starved patient has an RQ below 0.8 (ketone metabolism). Using 1.0 overestimates the CO₂ term subtracted from PAO₂, giving an artificially low PAO₂ that looks like severe hypoxemia when the patient is fine.
Each failure mode is a 5–10 mmHg error — enough to change a clinical decision at the margins, not enough to change it in obvious cases.
When the Equation Breaks Down Entirely
The alveolar gas equation assumes steady-state gas exchange, a single RQ for the whole body, and a uniform FiO₂. Three situations violate these assumptions:
High-frequency ventilation. The mean alveolar pressure oscillates around the set value, but instantaneous FiO₂ varies through the cycle. The equation gives a time-averaged answer that does not capture the oscillation.
Non-steady-state scenarios (intubation just performed, suction just done, bronchodilator just administered). The equation assumes alveolar gas has equilibrated with capillary blood. Within 10–20 minutes of a ventilator change, the output is misleading.
Right-to-left shunt above 10% of cardiac output. Pure shunt blood does not participate in gas exchange — it stays at mixed venous oxygen content regardless of FiO₂. The equation’s prediction becomes a ceiling, not a forecast. Increasing FiO₂ from 1.0 to 1.0 (the maximum) does not help shunt physiology; only reducing shunt fraction does.
The equation is a model. Use it where the model applies.
Quick Reference: Five Inputs, Five Decisions
FiO₂ — confirm the source: room air (0.21), nasal cannula (0.24–0.40), simple mask (0.35–0.60), non-rebreather (0.60–0.80), ventilator (set value). The most common error is assuming a nasal cannula at 6 L/min delivers 0.60 — it does not.
P_atm — default 760 mmHg, but always confirm altitude. ICU and ward rooms are at sea level; mountain hospitals, helicopters, and aircraft cabins are not.
47 — water vapor pressure at body temperature. Treated as constant. Some calculators expose it; most do not.
PaCO₂ — measured from ABG, not from EtCO₂ capnography. The two differ, especially in COPD.
RQ — default 0.8. Override only when metabolic state is known and not average.
Each input is a clinical decision, not a constant. The output is a model answer that reflects how clean those decisions were. Open the Alveolar Gas Equation tool and run your next patient through it. The math is short. The reasoning is not.
For more clinical calculators and reference tools, browse the full collection at elysiatools.com.
