
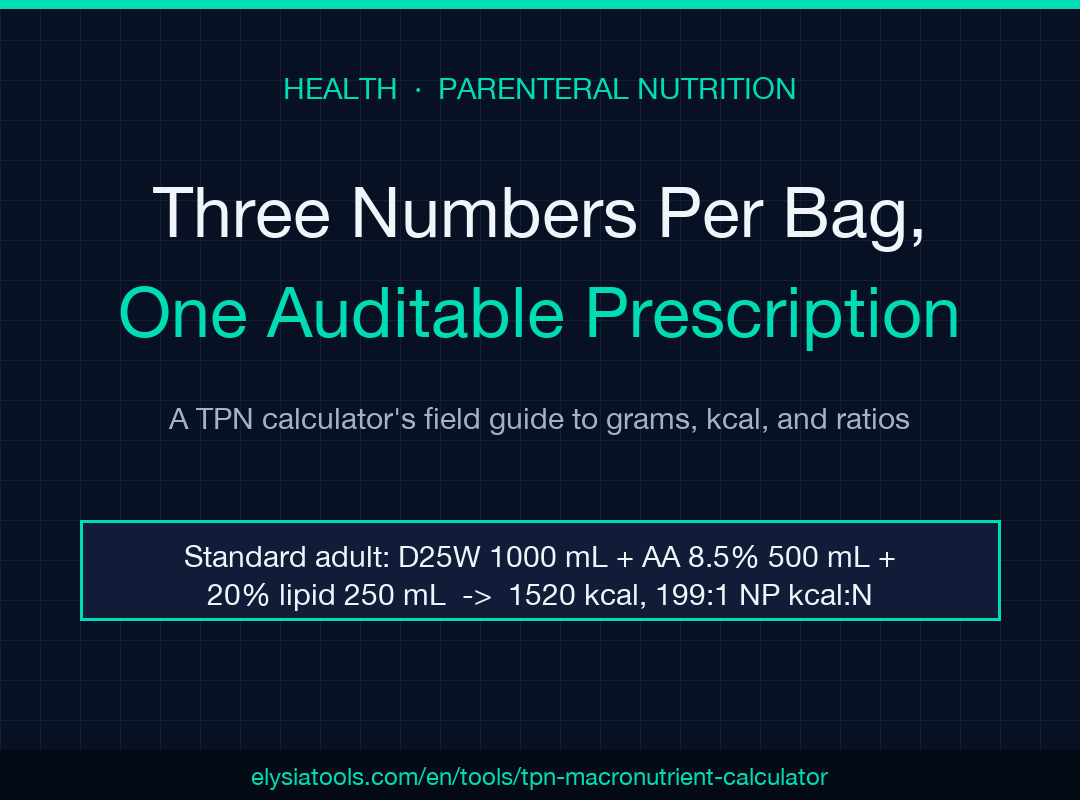
A TPN prescription is three numbers per macronutrient — dextrose percent and volume, amino-acid percent and volume, lipid emulsion percent and volume — and the entire parenteral nutrition analysis is a translation problem that turns those numbers into grams, kcal, a non-protein kcal to nitrogen ratio, and a per-kg audit. A standard 70 kg adult on 1000 mL of D25W, 500 mL of 8.5% amino acids, and 250 mL of 20% lipid delivers 250 g of dextrose (850 kcal), 42.5 g of amino acids (170 kcal, 6.8 g of nitrogen), and 50 g of lipid (500 kcal) for a total of 1520 kcal — about 21.7 kcal per kg per day with a non-protein kcal to nitrogen ratio of roughly 199 to 1, sitting in the energy-dominant band typical of a maintenance parenteral nutrition order. That kind of audit is exactly what the TPN Macronutrient Calculator was built for: the tool ingests a product-based prescription and emits grams, kcal, nitrogen, ratios, per-kg values and a category tag against the ASPEN 2016, ESPEN 2019, McClave 2016 and Mirtallo 2004 reference targets.
Why a Prescription-Audit Calculator Beats Mental Math
A TPN order reads like a pharmacy label, not a metabolic equation. Dextrose 25% in 1000 mL is 250 g of carbohydrate and 850 kcal; amino acids 8.5% in 500 mL is 42.5 g of protein and 170 kcal, which converts to roughly 6.8 g of nitrogen because amino-acid nitrogen is approximately 16 percent of the weight of the amino-acid solution. Lipid 20% in 250 mL is 50 g of fat and 500 kcal at 10 kcal per gram. Doing the arithmetic once is fine, but the moment the order changes — D30W replaces D25W, the lipid emulsion flips to 30 percent, or the patient is reweighed — the per-kg numbers, the ratio and the category band all need to be recomputed, and the typo risk multiplies. A calculator that ingests the prescription as product inputs and emits the audited deliverable removes that risk. The same logic is built into the sibling TPN Osmolality Estimator, which sits one step later in the same prescription workflow and decides whether a peripheral vein tolerates the final mixture.
The Three Energy Constants That Anchor Every TPN Calculation
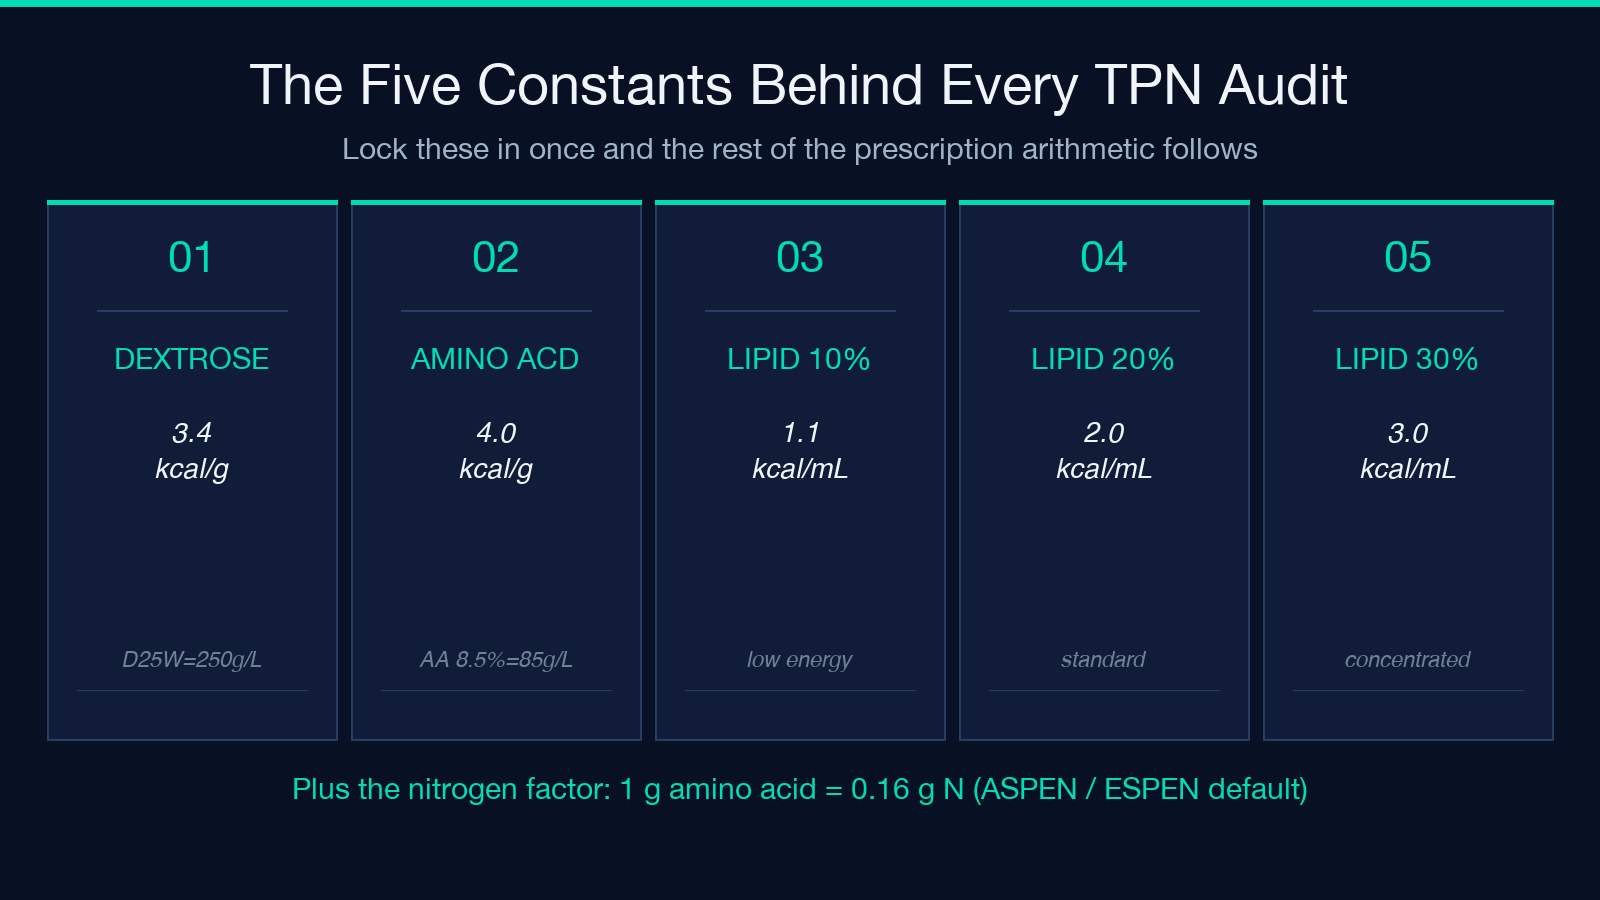
Three constants do almost all of the work. Dextrose monohydrate yields 3.4 kcal per gram; amino-acid solutions yield 4.0 kcal per gram; and lipid emulsions are usually cited at 10 kcal per gram of fat, but the volumetric form is the one that ends up on a TPN label, so a 20% emulsion at 2.0 kcal per mL is the operational rule, a 10% emulsion is 1.1 kcal per mL, and a 30% emulsion is 3.0 kcal per mL. The fourth constant is the amino-acid nitrogen factor, with 0.16 g of nitrogen per gram of amino acids being the standard figure used in ASPEN and ESPEN guidance. Once those four numbers are locked in, every TPN analysis is a multiplication cascade: grams of dextrose equals percent times volume times ten (because a 25% solution is 25 g per 100 mL), grams of amino acids works the same way, and grams of lipid equals volume in mL times the volumetric factor (2.0 for a 20% emulsion). The calculator threads those constants in one place so the order is auditable.
Non-Protein kcal to Nitrogen Ratio Is the Single Most Misread Number
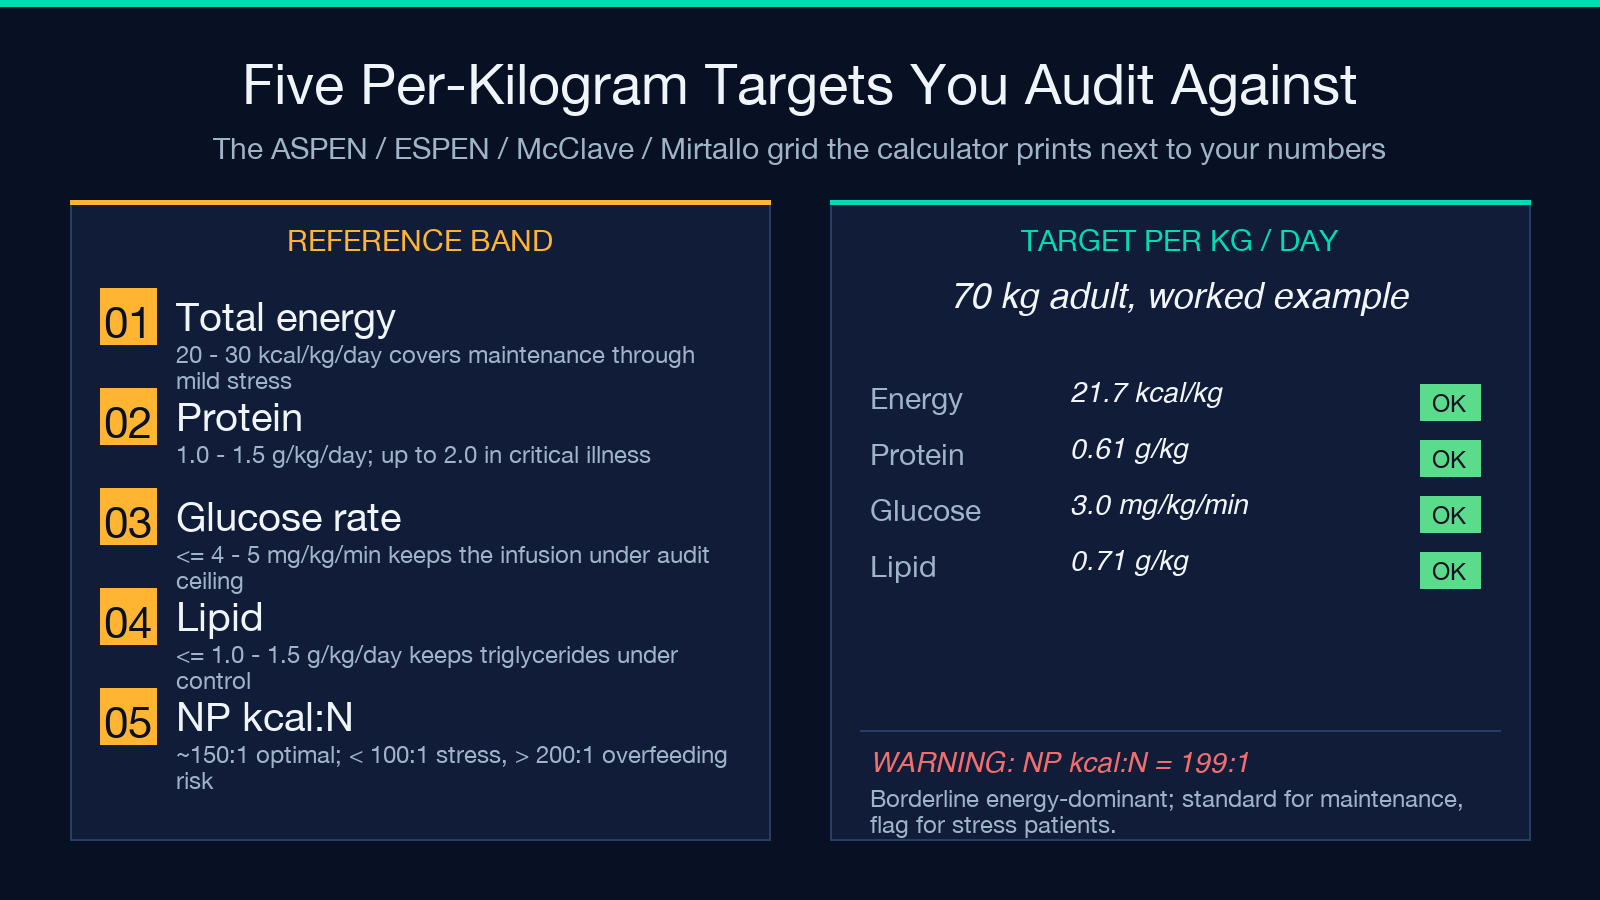
The non-protein kcal to nitrogen ratio — often written NP kcal:N — divides the sum of dextrose and lipid calories by the grams of nitrogen delivered, and it is the single most frequently misread figure on a TPN report. A ratio of about 150 to 1 is considered optimal under ASPEN 2016; under 100 to 1 means the protein dose is high relative to non-protein energy, the pattern seen in stress or critical-illness dosing where the priority is lean-body preservation; and above 200 to 1 means the non-protein energy is high relative to nitrogen, which raises the overfeeding risk because any further amino acids will simply be oxidized for fuel rather than used for synthesis. A maintenance 70 kg adult on the worked-example prescription lands near 199 to 1, just inside the energy-dominant band — borderline, but consistent with a typical maintenance order. Stress patients are usually dosed to land below 100 to 1, and re-feeding or chronic malnutrition patients are usually dosed to climb above 150 to 1 as energy is reintroduced.
Reference Targets Per Kilogram: The Audit Grid
The audit grid most clinicians anchor against has four rows. Total energy between 20 and 30 kcal per kg per day; protein between 1.0 and 1.5 g per kg per day, climbing toward 2.0 in critical illness; glucose infusion rate at or below 4 to 5 mg per kg per minute (the 7 mg per kg per minute ceiling is sometimes cited, but the lower threshold is the safer audit line for adults); and lipid at or below 1.0 to 1.5 g per kg per day. The worked example comes in low on protein at 0.61 g per kg per day, inside the energy band at 21.7 kcal per kg per day, and inside the lipid ceiling at 0.71 g per kg per day. That reading is a maintenance signal: the order meets energy and lipid targets but the protein arm is under-dosed, which is the kind of finding that changes a prescription before it leaves the pharmacy, not after. The calculator surfaces those per-kg readings next to the ratio, so the audit is a single glance rather than four manual divisions.
Worked Example Walkthrough at Standard Adult Maintenance
The standard adult prescription is a clean test case. A 70 kg patient, 1000 mL of D25W, 500 mL of 8.5% amino acids, 250 mL of 20% lipid. Dextrose grams: 25 percent times 1000 mL times 0.01 equals 250 g, at 3.4 kcal per gram is 850 kcal. Amino-acid grams: 8.5 percent times 500 mL times 0.01 equals 42.5 g, at 4.0 kcal per gram is 170 kcal, and at 0.16 g of nitrogen per gram of amino acids is 6.8 g of nitrogen. Lipid grams: 250 mL times 2.0 kcal per mL divided by 10 kcal per gram equals 50 g, at 10 kcal per gram is 500 kcal. Total energy: 850 plus 170 plus 500 equals 1520 kcal, which at 70 kg is 21.7 kcal per kg per day. Non-protein calories: 850 plus 500 equals 1350 kcal. Ratio: 1350 divided by 6.8 equals 198.5, which rounds to about 199 to 1 — the maintenance band. Plug the same numbers into the TPN Macronutrient Calculator and it returns the same audit in a single JSON result plus a category tag, which is the version that drops straight into a pharmacy note or an EMR entry.
Inputs, Outputs, and the JSON Shape the Tool Returns
The tool’s input schema is product-based, not gram-based, which is the design choice that makes the audit closer to the pharmacy label than to a metabolic equation. Weight in kilograms, dextrose percent and volume, amino-acid percent and volume, lipid emulsion percent (10, 20 or 30) and volume, plus a decimal-place selector for the report. The output is a structured JSON object that exposes dextrose grams and kilocalories, amino-acid grams and kilocalories, lipid grams and kilocalories, total kilocalories, non-protein kilocalories, nitrogen grams, the non-protein kcal to nitrogen ratio, a category tag (maintenance, stress-dominant, energy-dominant, hypocaloric, or overfeeding), and the reference set the audit is anchored against. That JSON shape is what lets a downstream note or an EMR import pick up the values directly without retyping the audit, and it is what lets the same tool plug into a clinical-decision-support workflow as an auditable component.
How Lipid Emulsion Choice Tilts the Whole Audit
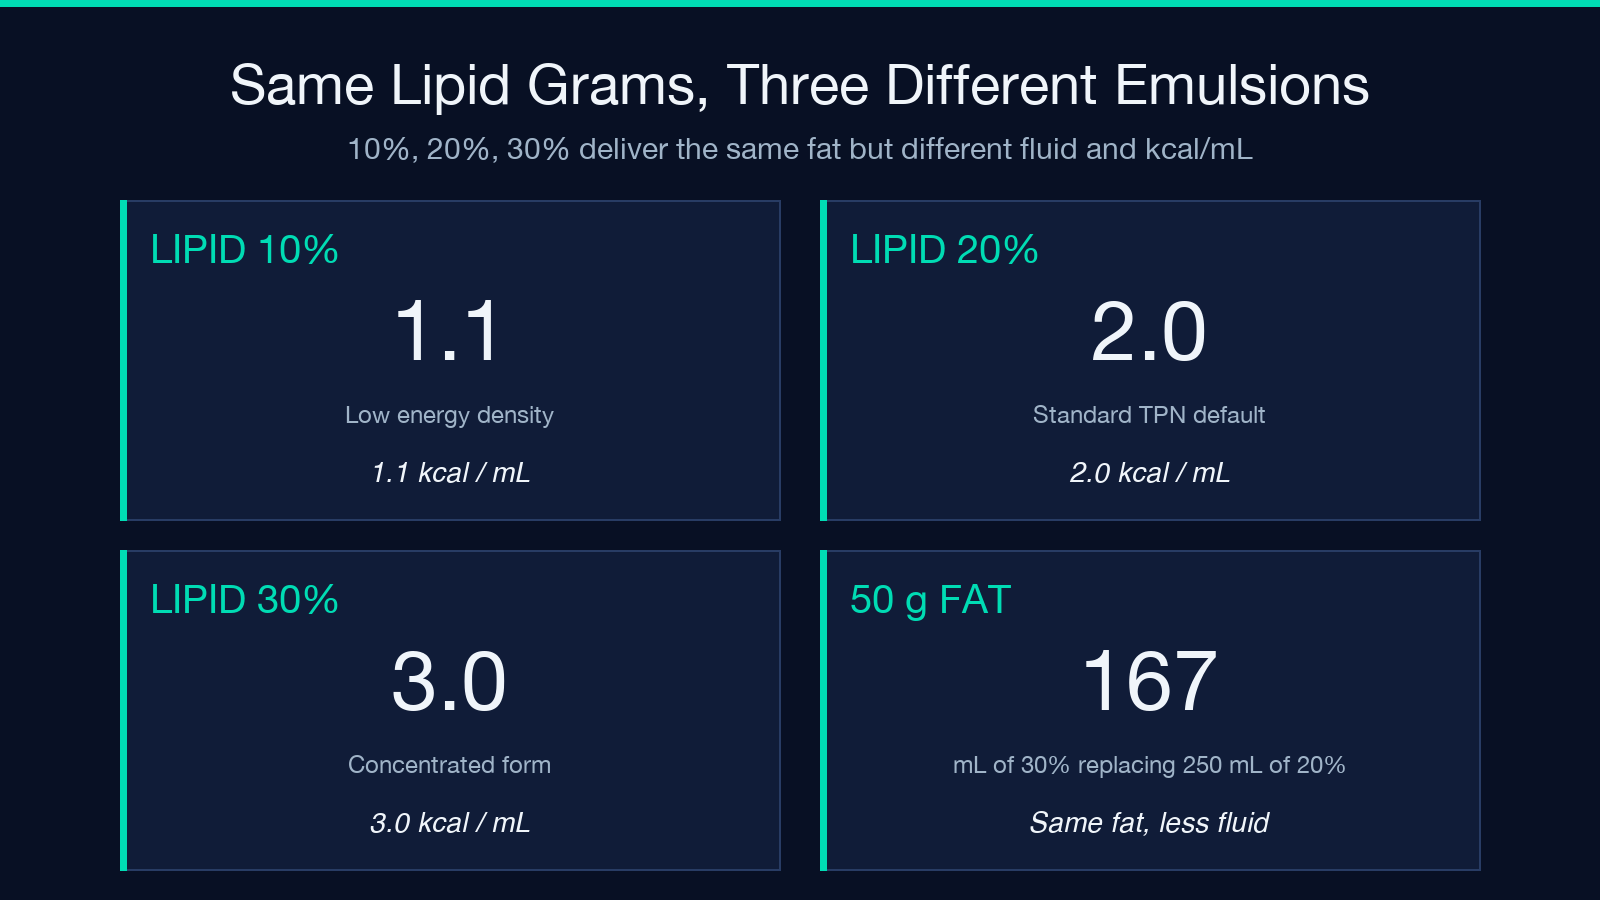
The lipid line is where the prescription gains or loses the most wiggle room, because the volumetric energy density changes with the emulsion. A 20% emulsion at 2.0 kcal per mL is the standard; a 10% emulsion at 1.1 kcal per mL is more permissive on volume but delivers the same grams of fat at higher total fluid; and a 30% emulsion at 3.0 kcal per mL is the concentrated form used when fluid restriction is the priority. Switching the worked example from 250 mL of 20% lipid to 167 mL of 30% lipid keeps the 50 g of fat but drops 83 mL of total fluid, which matters when the patient is on a strict intake-and-output ledger. The calculator ingests the emulsion percent as a discrete field, so swapping 10% and 20% and 30% becomes a one-edit-variable change in the input rather than a recompute of every downstream constant.
Practical Limits and When to Recompute
The audit is only as current as the last prescription edit, so the calculator earns its keep when the order is changing — for example when D25W is bumped to D30W to chase a higher glucose infusion rate, when the lipid is held because of a triglyceride spike, when the amino-acid solution is switched from 8.5% to 10% during a stress-dose escalation, or when the patient is reweighed after a fluid resuscitation. It is also worth re-running the audit any time a new bag is hung, because the same patient on a different ratio can flip the ratio band and the per-kg protein in a single cycle. The full reference grid lives at the TPN Macronutrient Calculator, and the calculation is a prescription-analysis aid rather than a compounding recipe — the TPN still has to be mixed aseptically in the pharmacy with a calcium-phosphate solubility check, and any clinical move toward re-feeding has to clear enteral tolerance first. Glucose, triglycerides, liver function tests and the basic electrolyte panel remain the monitoring loop. For a broader tour of the prescription workflow, browse the Health calculators collection.
