
A calculated LDL-C is only as honest as the triglycerides behind it. The Friedewald formula has been the workhorse of lipid panels for more than fifty years, but it leans on a single hidden assumption — that triglyceride and VLDL cholesterol rise in lockstep at a 5:1 ratio. The instant that ratio drifts, the equation starts lying quietly in one direction. The good news is that two newer estimators, Martin/Hopkins (2013) and Sampson-NIH (2020), tighten the estimate across the realistic TG range, and the LDL-C Calculator (Friedewald) tool at Elysia Tools applies all three side by side so a clinician can see when the formulas converge and when they no longer agree.
What the Friedewald Formula Actually Calculates
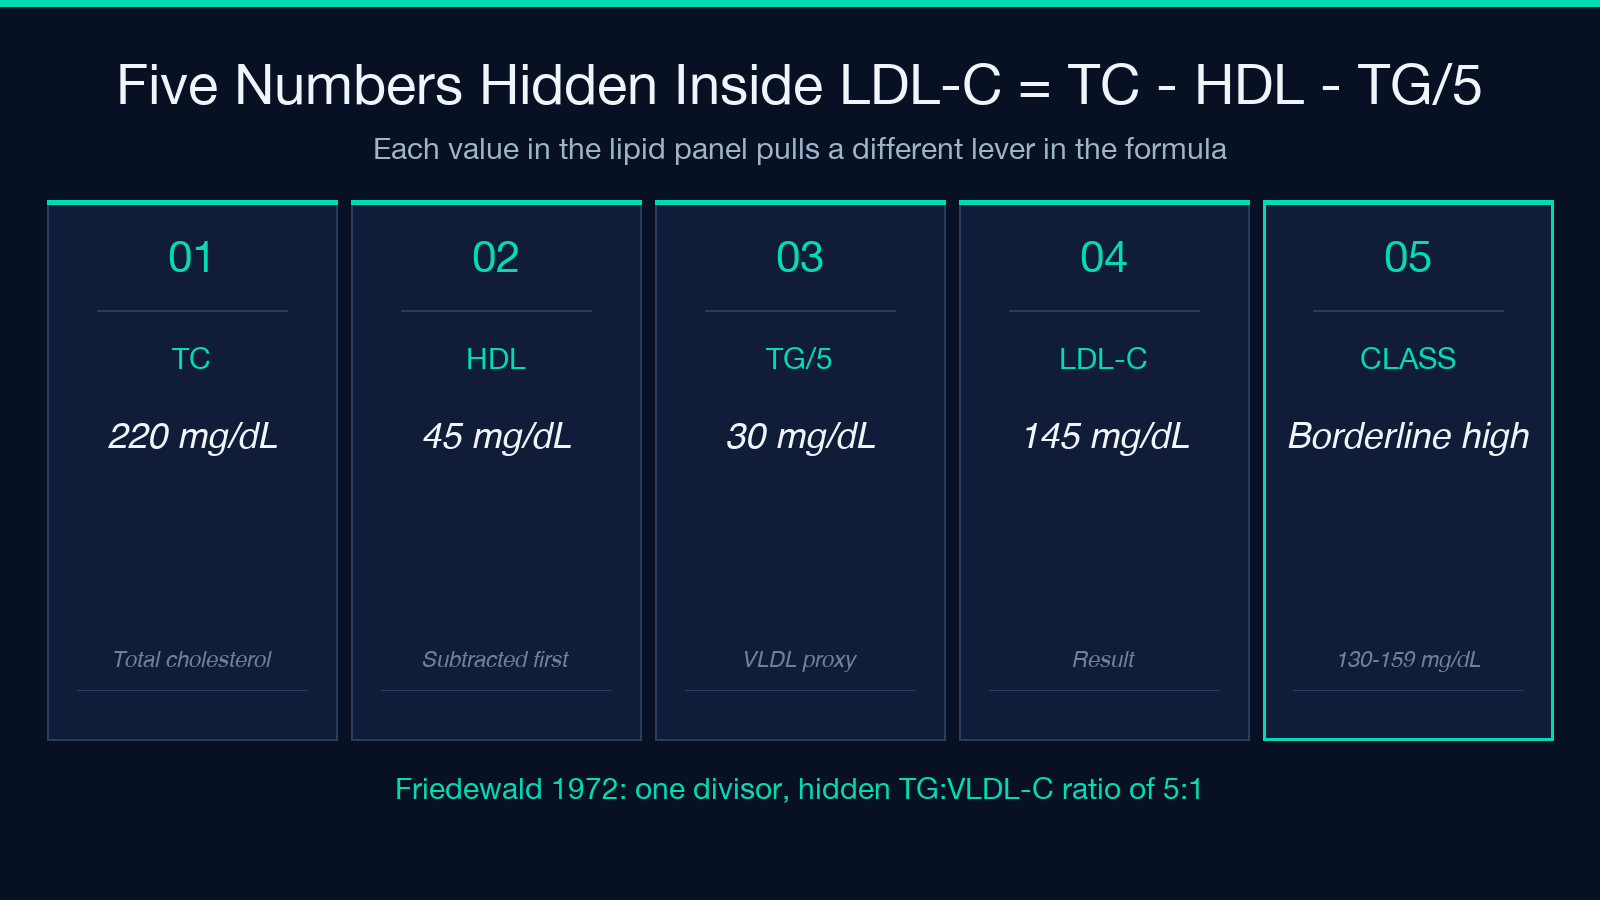
The 1972 Friedewald paper is short enough to summarize in one line: subtract HDL and one fifth of the triglycerides from total cholesterol and call the rest LDL-C. In mg/dL the form is LDL-C = TC - HDL - (TG / 5); in mmol/L the divisor becomes 2.2 because the ratio is preserved in molar units. The math is not an estimate of LDL particles but a rearrangement of the standard lipid-panel identity TC = HDL + LDL + VLDL, with VLDL approximated as TG/5. This shortcut worked because most outpatient fasting panels cluster around the 5:1 assumption.
The hidden assumption is the entire reason modern calculators ask for the unit system explicitly. The LDL-C Calculator (Friedewald) lets you switch between mg/dL and mmol/L without retyping the rest of the panel, and it reports the divisor it actually used so the result can be audited against the original paper.
Why TG ≥ 400 mg/dL Breaks the Equation
The 5:1 ratio is an empirical average across fasting outpatients. As triglycerides climb, VLDL particles get larger and more cholesterol-rich, and the ratio drops toward 3:1 or lower. Plugging TG = 600 mg/dL into Friedewald assumes VLDL-C = 120 mg/dL when it might really be 180. The calculated LDL is therefore under-reported, sometimes by 30–50 mg/dL, and the under-reporting gets worse as TG rises. Every guideline that recommends Friedewald — NCEP, ESC, ACC/AHA — qualifies it with the same line: do not use it above 400 mg/dL.
A direct LDL assay is the conservative replacement; the LDL-C Calculator (Friedewald) tool flags the input as outside the Friedewald-valid range and reports the Friedewald, Martin/Hopkins, and Sampson-NIH outputs side by side so the reader can see how much the methods disagree at the cliff. If the three estimators split by more than 20 mg/dL the panel almost certainly needs a direct measurement before treatment decisions are made.
The Martin/Hopkins Replacement (2013)
Martin and colleagues at Johns Hopkins noticed that the TG:VLDL-C ratio depends on the actual TG and non-HDL-C values, not just on a constant. They fitted 1.3 million lipid panels and built a 180-cell lookup table indexed by TG and non-HDL-C. Each cell carries a custom divisor, ranging from about 4.0 at low TG to 11.7 at very high non-HDL-C. The published form is LDL-C = TC - HDL - (TG / adjustable_factor) where the factor comes from the table. Compared with direct LDL measured by beta-quantification, Martin/Hopkins reduced misclassification by about 40 percent in the 100–189 mg/dL range.
The LDL-C Calculator (Friedewald) tool at Elysia Tools applies the Martin/Hopkins 180-cell table automatically and reports the divisor it used in the same payload, which makes the calculation auditable when it is appended to a clinical note.
The Sampson-NIH Refinement (2020)
Sampson and colleagues at NIH extended the table-based approach with a larger, more diverse cohort and added cells for very low LDL-C (< 70 mg/dL), where the original Friedewald formula is most biased toward underestimation. Sampson-NIH is the estimator currently bundled into most modern EHR lipid panels in the United States. The published form is also LDL-C = TC - HDL - (TG / adjustable_factor), but the factor grid is finer and was validated against direct LDL plus VLDL-C measured by ultracentrifugation. In head-to-head comparison Sampson-NIH reclassified about 12 percent of patients into a different treatment threshold versus Friedewald, and about 4 percent versus Martin/Hopkins.
The point of comparing the three estimators in the same calculator is not to crown a winner — they all converge within about 5 mg/dL on a typical fasting panel — but to spot the panels where the spread is large enough to matter.
When the Calculation Is Not the Right Question
There are three clinical situations where no estimator returns a trustworthy LDL-C and a direct measurement is mandatory. First, the non-fasting state with high triglycerides, where the TG:VLDL-C assumption is violated both ways. Second, type III dysbetalipoproteinemia (apoE2/E2 genotype), where VLDL carries cholesterol rather than triglycerides and Friedewald systematically over-estimates LDL. Third, severe hypertriglyceridemia (TG ≥ 1000 mg/dL), where the patient is at acute pancreatitis risk and the lipid panel itself is being read as a triage flag rather than a treatment target.
The LDL-C Calculator (Friedewald) tool does not pretend to replace a direct assay in any of these situations. It returns a flagged result with a clear note that the estimator is outside its validated range, and it lists the alternative estimators it knows about so the reader can see whether Martin/Hopkins or Sampson-NIH is more defensible in a given cell.
ACC/AHA 2018 Treatment Thresholds
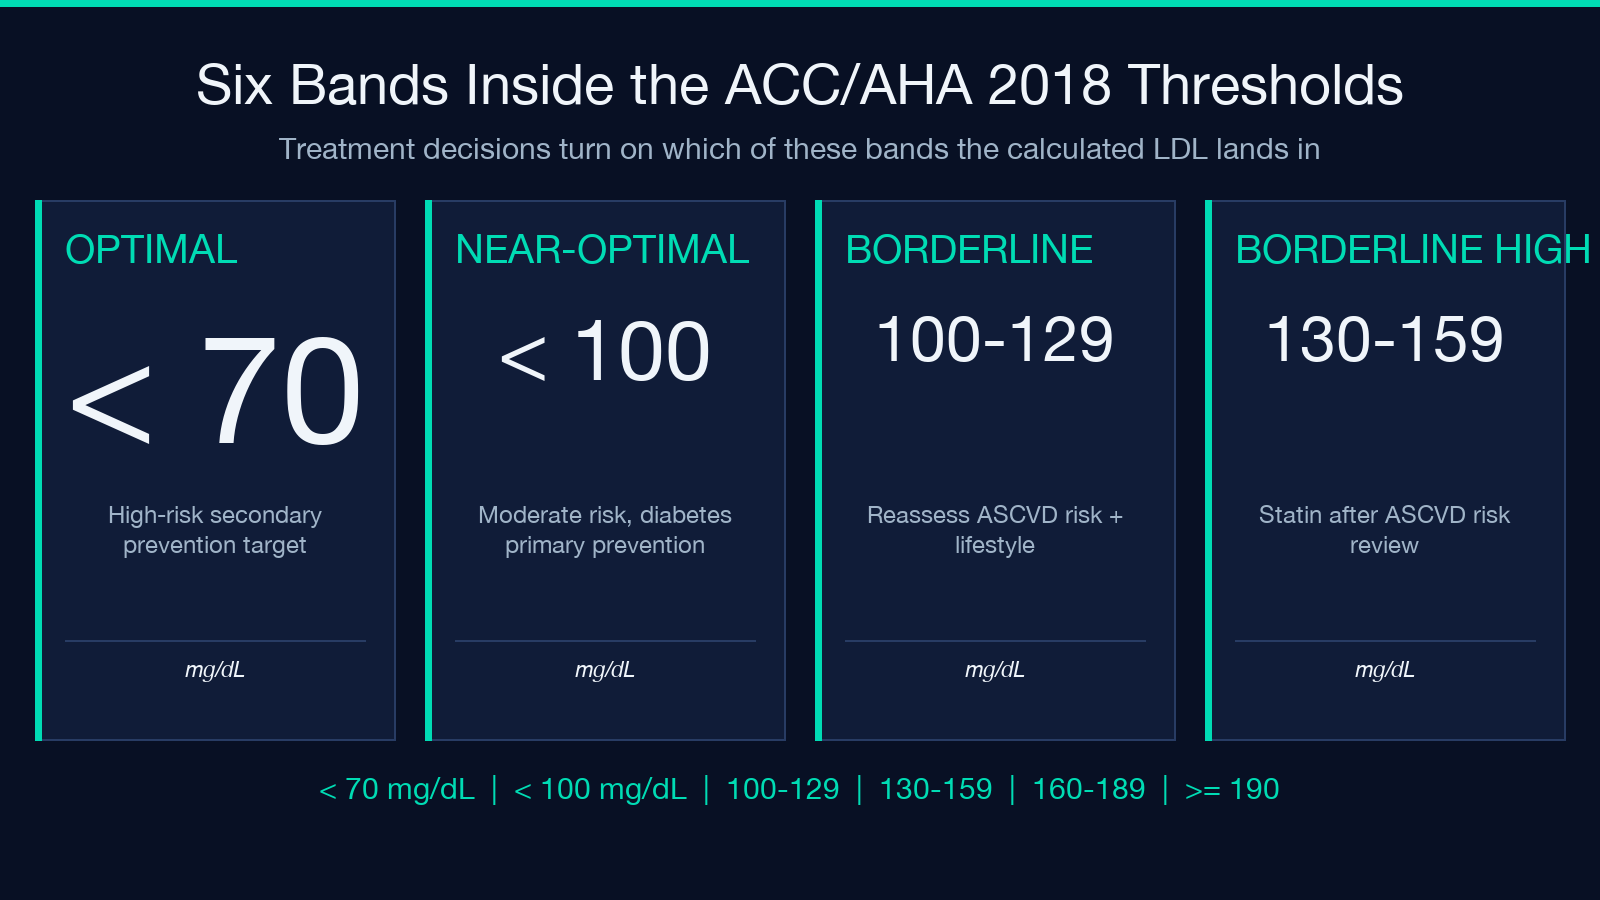
A calculated LDL-C only matters when it crosses a treatment threshold. The 2018 ACC/AHA cholesterol guideline set the following categories in mg/dL: < 70 high-risk secondary prevention; < 100 moderate-risk or diabetes primary prevention; 100–129 borderline; 130–159 borderline high; 160–189 high; ≥ 190 suggests familial hypercholesterolemia and warrants cascade screening. In mmol/L the bands translate approximately as < 1.8, < 2.6, 2.6–3.3, 3.4–4.1, 4.1–4.9, ≥ 4.9.
The category that catches the most patients off guard is 70–99 mg/dL in someone with established ASCVD — the threshold for high-intensity statin therapy in secondary prevention is < 70 mg/dL, so a calculated LDL of 75 on Friedewald might really be 95 on Sampson-NIH, and the latter crosses the “needs escalation” boundary. The LDL-C Calculator (Friedewald) tool at Elysia Tools reports all three estimators in the same payload so this gap is visible at a glance rather than hidden inside a single Friedewald number.
Worked Example: A Typical Fasting Panel
Take TC = 220 mg/dL, HDL = 45 mg/dL, TG = 150 mg/dL. Friedewald gives 220 - 45 - 150/5 = 145 mg/dL, which lands in the borderline-high band (130–159). Martin/Hopkins picks a divisor around 6.2 for this TG and non-HDL-C and returns about 151 mg/dL. Sampson-NIH lands close to 148. All three estimators agree within 6 mg/dL, and the patient is borderline high on each — the same treatment decision follows.
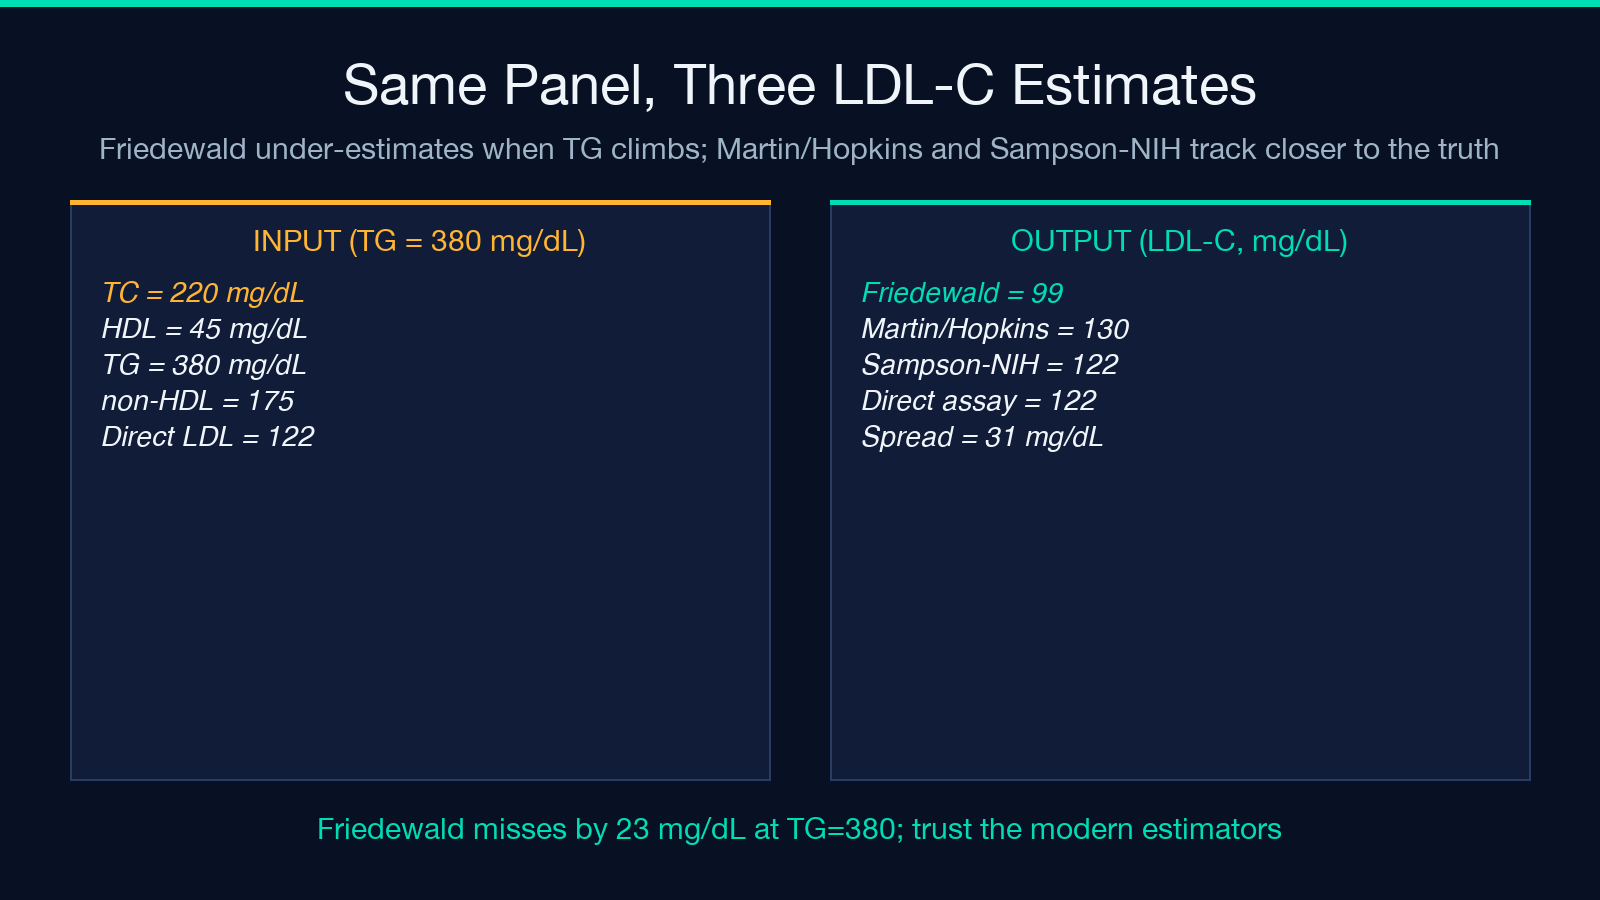
The exercise that exposes the spread is to take the same TC and HDL but raise TG to 380 mg/dL. Friedewald assumes VLDL-C = 76 and returns 220 - 45 - 76 = 99. Martin/Hopkins uses a divisor closer to 8.5 and returns about 130. Sampson-NIH returns about 122. Friedewald under-estimates LDL-C by more than 20 mg/dL here — the patient looks fine on the old formula and clinically elevated on the new ones.
Why Three Estimators Beat One
The single most useful clinical question a lipid-panel calculator can answer is not “what is the LDL” — it is “do the estimators agree”. When Friedewald, Martin/Hopkins, and Sampson-NIH converge, the panel is consistent with the underlying assumptions and a treatment decision can be made on the result. When they diverge, the divergence is itself the diagnostic signal: a high-TG panel will spread the three estimators, and the spread quantifies how much the hidden 5:1 assumption has been violated. The LDL-C Calculator (Friedewald) tool exposes this spread directly, which is the point of running all three estimators in one place rather than picking the historical default.
For clinicians who want to keep the legacy formula in their notes, the calculator also reports which estimator was used and the divisor it applied, so the choice is auditable. Browse the rest of the clinical calculator catalog at elysiatools.com for parallel calculators that follow the same multi-estimator pattern — the Apgar, CHA₂DS₂-VASc, and Caprini tools all expose the same kind of “do these methods agree” view rather than collapsing to a single number.
Calculated LDL-C is a tool, not a verdict. The Friedewald formula is the historic default for a reason — it is fast, transparent, and works on most fasting panels — but it has a clear failure mode at high triglycerides and an empirically measurable bias across the realistic range. Martin/Hopkins and Sampson-NIH fix the bias in different ways, and the LDL-C Calculator (Friedewald) tool at Elysia Tools is the easiest way to see which one matches your panel.
