
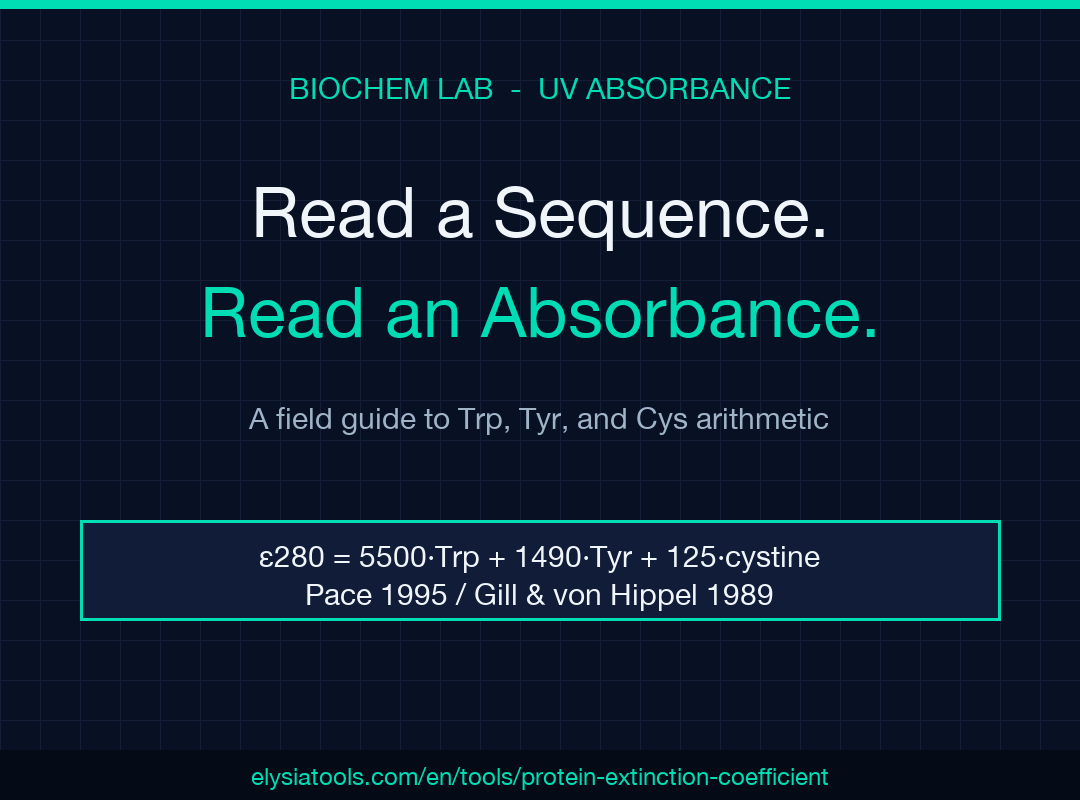
Close the spectrophotometer cuvette, open the sequence file, and the arithmetic is already done. Estimating a protein’s molar extinction coefficient at 280 nm used to mean punching residue counts into a lab notebook spreadsheet or opening ExPASy ProtParam in another tab and waiting for it to load. For most working biochemists it is the kind of step you do ten times a day, which is precisely why it should not be the kind of step that introduces noise into your prep. The Protein Extinction Coefficient Calculator (ε280) takes a sequence — or a manual count of Trp, Tyr, and Cys — and returns both the Pace 1995 / Gill & von Hippel 1989 coefficient and the practical A0.1%, so you can drop straight from A280 to mg/mL without re-deriving the maths on every prep.
What ε280 Actually Represents
A protein’s molar extinction coefficient at 280 nm, written ε280, is the absorbance a 1 M solution would have in a 1 cm path. In practice nobody prepares 1 M stocks, so the lab uses two derived forms: ε280 itself, in M⁻¹cm⁻¹, and A0.1%, defined as the absorbance of a 1 mg/mL solution in a 1 cm cuvette. The two are linked by the protein’s molecular weight: A0.1% = ε280 / MW. Once you have either, Beer-Lambert gives you c = A280 / ε280 (with path length factored in for non-1 cm cuvettes). The reason labs default to 280 nm rather than 205 nm or BCA is convenience: aromatic residues absorb strongly there, plain buffer does not, and you can read the same sample that you are about to load on a column.
Why Tryptophan Dominates the Number
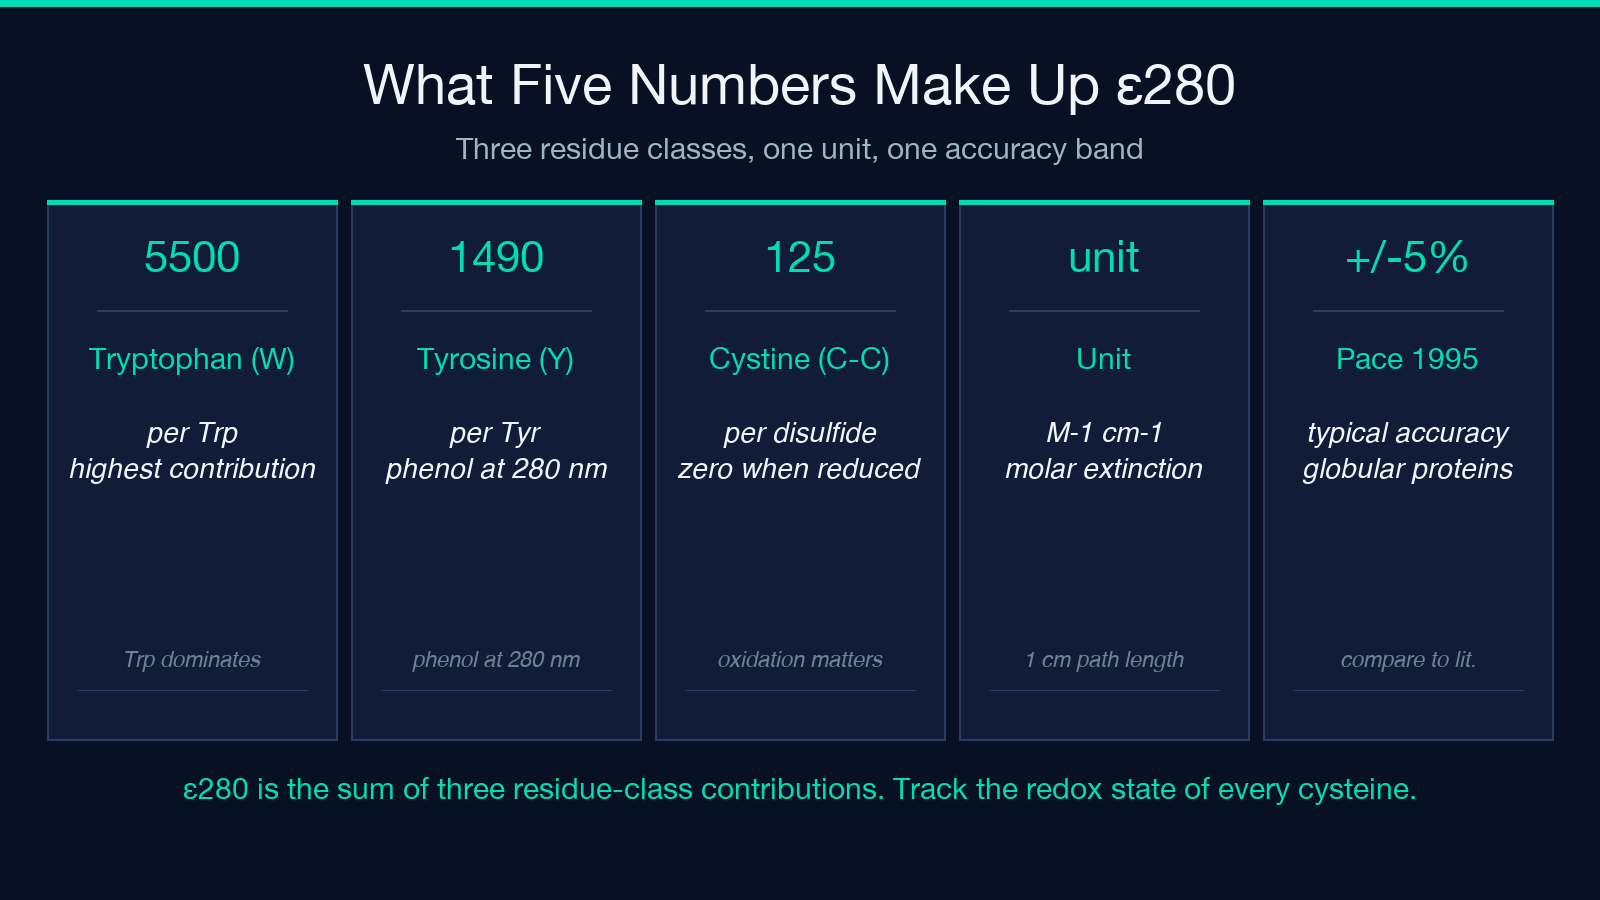
The Pace 1995 / Gill & von Hippel 1989 form is ε = 5500·nTrp + 1490·nTyr + 125·ncystine, with all values in M⁻¹cm⁻¹. The coefficients are the molar contributions per residue: each tryptophan adds 5500, each tyrosine 1490, and each disulfide-paired cystine 125. Tryptophan so dominates because its indole side chain has two orders of magnitude more absorbance than phenol at 280 nm. A single Trp in a 30 kDa protein can outweigh the contribution of every Tyr and Cys in the sequence combined. This is also why antibodies — which deliberately bury tryptophans to stabilize the variable domain — are notoriously variable in their ε280, and why labs that work on IgG often use A205 or BCA instead.
Redox State Changes the Answer
Cysteine is the only residue whose contribution depends on its chemical state. Reduced cysteines — free thiols — contribute nothing to ε280; only disulfide-paired cystines (⌊Cys/2⌋ pairs) contribute. The calculator explicitly returns both bounds: the all-reduced estimate and the all-oxidized estimate. For most intracellular expression hosts, the dominant form varies with the protein and the purification protocol: a cytosolic E. coli preparation with iodoacetamide blocking during lysis will sit at the reduced bound; a secreted antibody from CHO with proper folding will sit at or above the oxidized bound. If you do not know the redox state of your prep, the spread between the bounds tells you how much room for error you actually have. For a 40 kDa protein with eight cysteines, the difference can be a few percent; for a 12 kDa cysteine-rich scaffold it can be 30% or more.
A0.1% Tells You What the Spectrophotometer Will See
A0.1% — absorbance of a 1 mg/mL solution in a 1 cm path — is what your benchtop NanoDrop or cuvette actually displays once you dilute to working concentration. Many published protocols give A0.1% directly so the lab does not have to redo the MW calculation. The calculator emits both forms because both are wrong for some workflows and both are right for others. If your prep is well-characterized and you trust your extinction coefficient, use ε280 and let the benchtop do the arithmetic. If you are working from a published protocol on the same construct prepared the same way, use A0.1% as a quick cross-check between preps.
When ε280 Stops Working
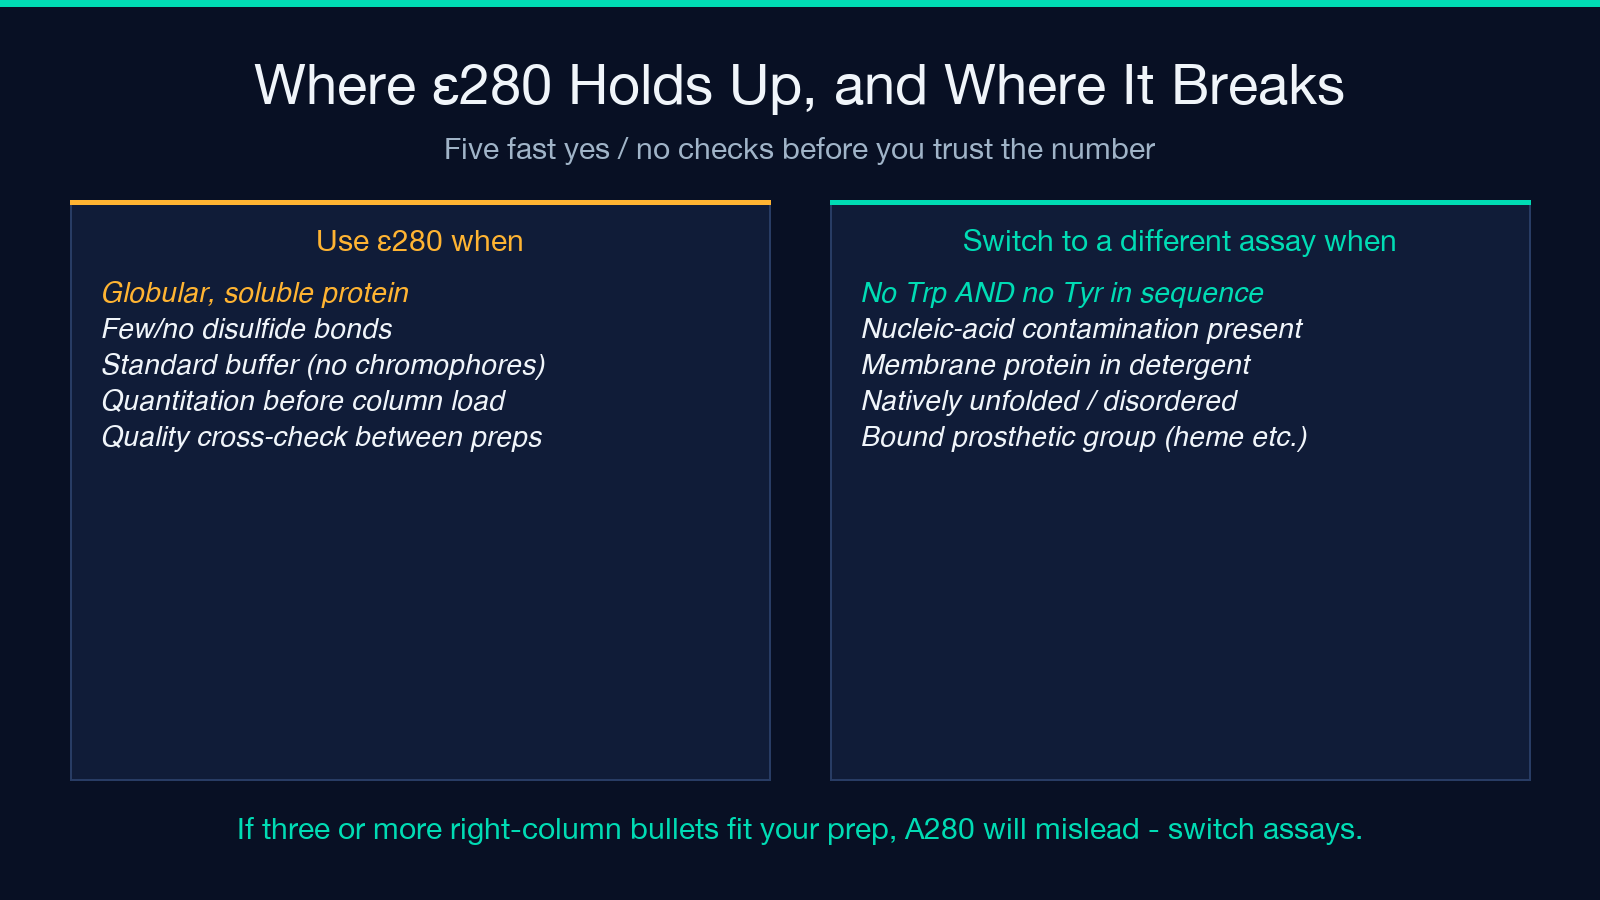
Three common situations break the method entirely. First, proteins without Trp or Tyr have near-zero ε280, and the resulting concentration estimate is dominated by buffer and pipetting error; switch to A205, BCA, or a fluorescent dye assay. Second, nucleic-acid contamination inflates A280 through the absorbance of the bases; the canonical correction is the Warburg-Christian formula, which subtracts a contribution proportional to A260. Third, samples with non-1 cm path lengths (capillary cells, pedestal instruments) require explicit path-length factor; the calculator covers the standard 1 cm case, and a path-length scalar has to be applied for the others. None of these are bugs in the method — they are properties of the chemistry.
What to Type Into the Tool
Two input modes cover most working flows. Sequence mode accepts a one-letter sequence in the 20 standard amino acid codes (with FASTA headers, whitespace, and asterisk stops stripped) and counts W, Y, and C automatically; it also derives the ProtParam-average molecular weight so the A0.1% calculation does not need a separate lookup. Residue-count mode accepts Trp, Tyr, and Cys as explicit integers plus an optional MW; use it when you only know the sequence composition (e.g. from a homology model or a published crystal structure) and the molecular weight already. Cysteine state switches between All reduced and All oxidized. Decimal places is purely cosmetic — the underlying arithmetic is double-precision throughout.
A Worked Example
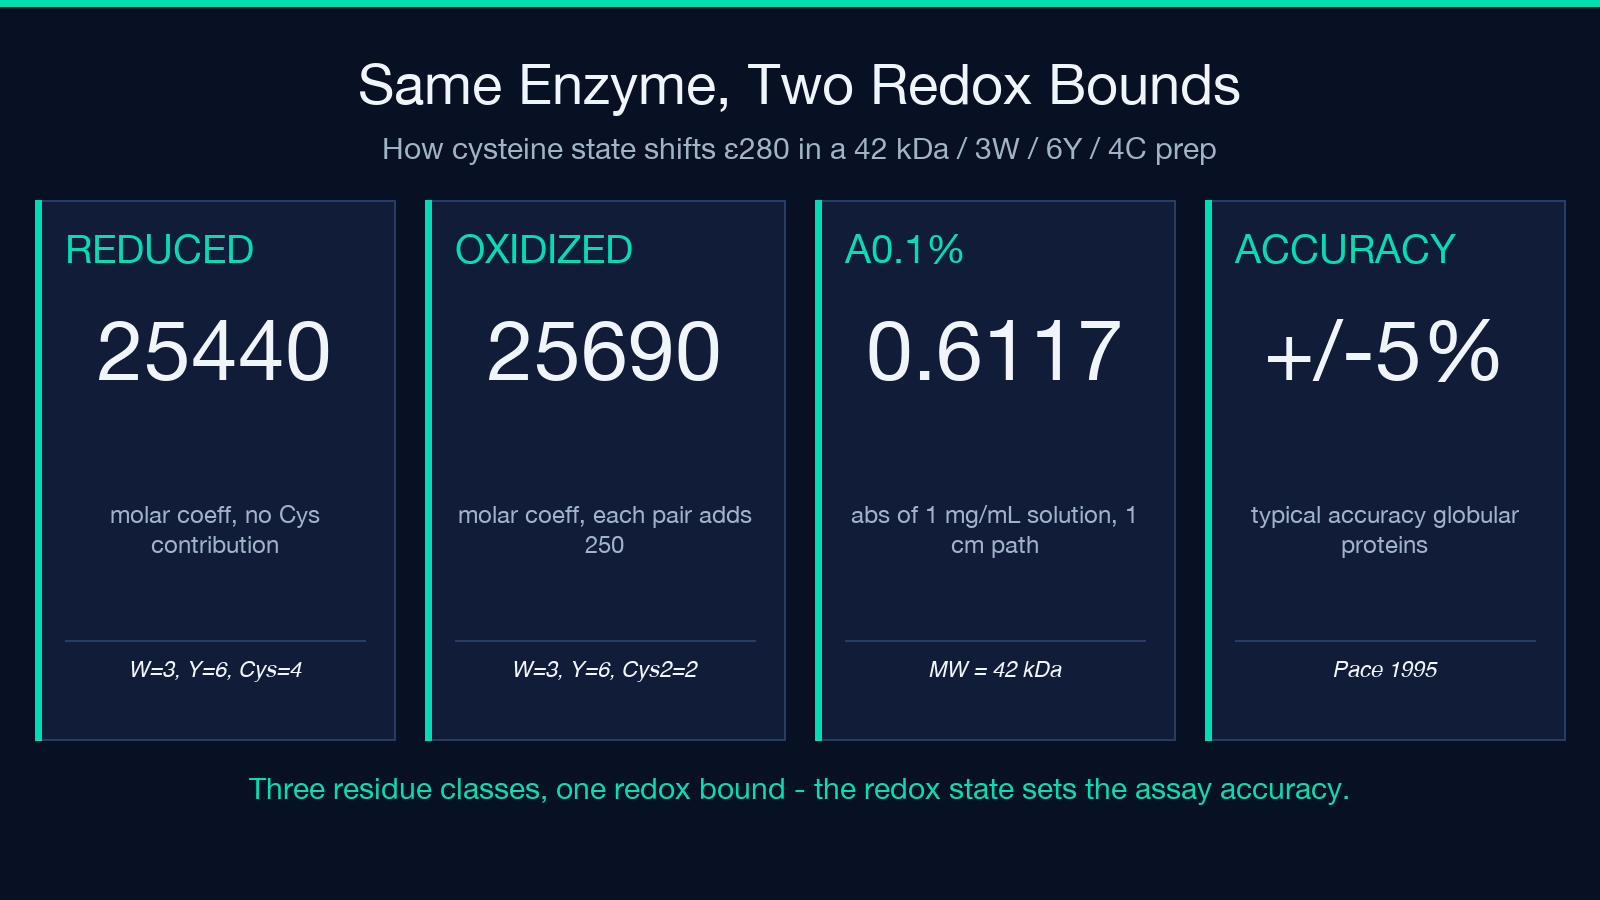
A 42 kDa enzyme is reported to contain 3 tryptophans, 6 tyrosines, and 4 cysteines; the prep is from a cytosolic E. coli expression with iodoacetamide blocking, so all cysteines are reduced. In residue-count mode, ε280 reduced = 5500·3 + 1490·6 + 0 = 25440 M⁻¹cm⁻¹. All-oxidized would be 5500·3 + 1490·6 + 2·125 = 25690 M⁻¹cm⁻¹. A0.1% = 25690 / 42000 ≈ 0.61. With an A280 reading of 0.42 on a 1 cm cuvette, concentration comes out to c = A280/ε280 ≈ 16.4 µM (≈ 0.69 mg/mL). The reduced-bound estimate of 25440 gives 16.5 µM — a 0.6% difference, well within the ±5% accuracy typical of the Pace method.
What the Number Is Not
ε280 from Pace 1995 is typically accurate to ±5% for well-behaved, globular, cysteine-light proteins. It is not accurate for natively unfolded proteins, membrane proteins in detergent, glycoproteins with significant chromophore-bearing sugars, or any construct with a bound prosthetic group (heme, flavin, retinal). For those samples, ε280 is a useful sanity check but not a primary quantitation method. The calculator’s output reports the underlying assumption — Pace 1995 / Gill & von Hippel 1989 — so you know whether the figure you are quoting is comparable to the literature you are comparing it against.
For more on protein quantification in the lab, the broader protein quantification hub collects the related calculators — Bradford, BCA, A260 DNA concentration, enzyme kinetics — so the work after ε280 stays in the same toolset. Explore more tools at elysiatools.com.
