
An enzyme with a turnover number of 10 s⁻¹ can outrank one that turns over 100,000 times a second. Not because the assay was wrong, but because kcat alone ranks catalysts by the wrong question. Divide by Km and the leaderboard reshapes, and the ceiling you hit next is not chemistry at all.
Two enzymes, one substrate, an inverted ranking
Take two hydrolases acting on the same substrate.
Enzyme A is fast. Its turnover number is 100,000 s⁻¹, and its Michaelis constant is 50 mM. Enzyme B is sluggish at 10 s⁻¹ with a Km of 1 µM. On kcat alone, A wins by four orders of magnitude.
On catalytic efficiency, B wins by fivefold:
- Enzyme A: 100,000 s⁻¹ ÷ 50 mM = 2.0 × 10⁶ M⁻¹s⁻¹
- Enzyme B: 10 s⁻¹ ÷ 1 µM = 1.0 × 10⁷ M⁻¹s⁻¹
That inversion is the whole point of the metric. Km is the substrate concentration at which the enzyme runs at half its maximum rate, so it prices the substrate. A catalyst that needs 50 mM to reach top speed is not fast at the concentrations a cell maintains. A slow catalyst that saturates at 1 µM works near its maximum the whole time.
The catalytic efficiency calculator computes this ratio in either direction: kcat and Km entered directly, or kcat derived from Vmax and enzyme concentration.
kcat/Km is a second-order rate constant, not a speed
The units tell you what you own. kcat is per second. Km is a concentration. Their ratio carries units of M⁻¹s⁻¹, the signature of a second-order rate constant, and that is exactly what it is: the apparent rate at which free enzyme and substrate meet and commit to product.
Under Briggs-Haldane steady state the ratio has a closed form:
- kcat/Km = k₁k₂ / (k₋₁ + k₂)
Two limits fall out, and they explain most of the confusion in the literature. The 1977 Knowles and Albery study of catalytic perfection built its argument on this identity, and Fersht’s treatment of specificity in Structure and Mechanism in Protein Science starts from the same place.
When chemistry is slow relative to dissociation (k₂ ≪ k₋₁), the ratio reduces to k₂/KD. It measures binding plus catalysis, which is what most bench scientists mean by “specificity”.
When chemistry is fast (k₂ ≫ k₋₁), the ratio approaches k₁, the association rate constant. At that point the enzyme is no longer being measured. Diffusion is.
Prove it with numbers. With k₁ = 10⁹ M⁻¹s⁻¹, k₋₁ = 10⁵ s⁻¹ and k₂ = 10³ s⁻¹, the ratio is 9.9 × 10⁶ M⁻¹s⁻¹, matching k₂/KD. Push k₂ to 10⁷ s⁻¹ and the ratio climbs to 9.9 × 10⁸ M⁻¹s⁻¹, pressed flat against k₁. Good luck pushing further.
The conversion that silently cuts your answer by 60×
Units, not algebra, cause most of the bad numbers I see reported in talks. Three conversions do the damage: 60, 1,000, and 60,000×.
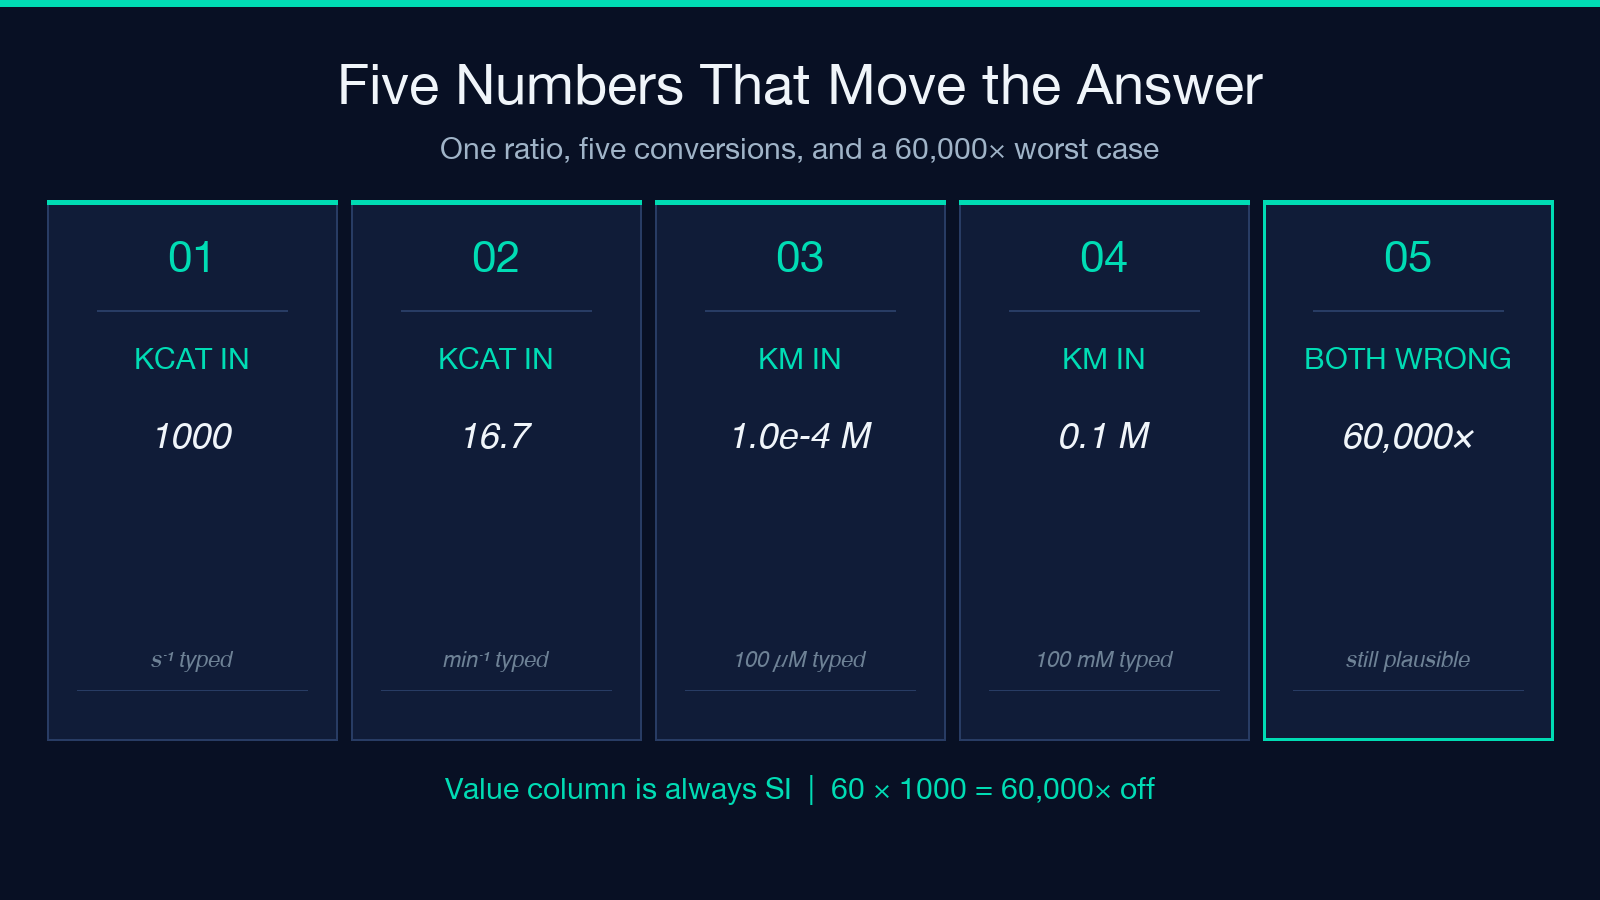
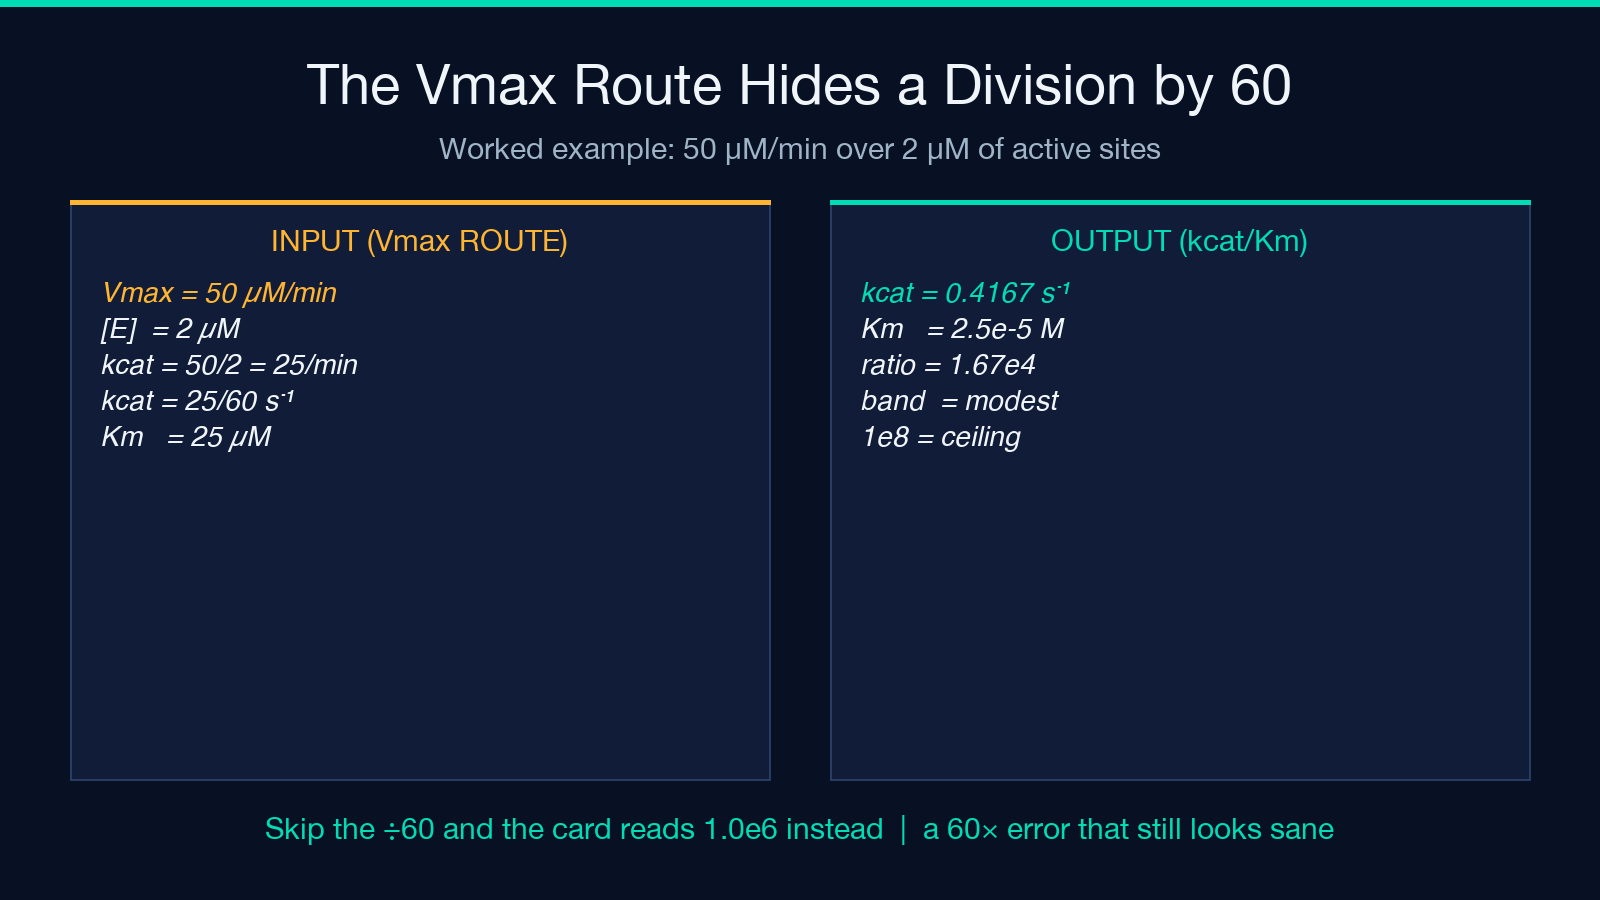
Turnover per minute. Enter kcat as 1000 min⁻¹ instead of 1000 s⁻¹ and the answer drops by 60×. With Km at 100 µM, that is the gap between 1.00 × 10⁷ M⁻¹s⁻¹ and 1.67 × 10⁵ M⁻¹s⁻¹, a full band and an order of magnitude. In Vmax mode the division happens for you. For example, 50 µM/min ÷ 2 µM = 25 min⁻¹, then ÷ 60 = 0.4167 s⁻¹. Forget that second divisor and you ship a number sixty times too large that still looks plausible.
Km in the wrong prefix. 1 mM is 1,000 µM and 1,000,000 nM. Enter 100 mM where you meant 100 µM and the answer drops by 1,000×: from 1.00 × 10⁷ to 1.00 × 10⁴ M⁻¹s⁻¹, two bands down.
Active sites versus total protein. kcat needs the concentration of catalytic sites, not the mass of purified protein. A 2 µM solution of a dimeric enzyme with one functional site per subunit is 4 µM of sites, and that factor of two propagates straight through into the ratio.
Stack the first two and you can ship an answer wrong by 60,000× while each individual step looked reasonable.
Where the number stops being about chemistry
Around 10⁸ to 10⁹ M⁻¹s⁻¹, a small substrate meeting a well-folded active site arrives as fast as diffusion allows. That ceiling is not a record to break. It is a physical wall, and three of the textbook exemplars sit against it: triosephosphate isomerase, carbonic anhydrase, acetylcholinesterase. Radzicka and Wolfenden’s 1995 benchmarks are the usual citation for the first of those.
Two consequences matter for interpretation.
First, differences above the ceiling are noise, not signal. A reported 2 × 10⁸ against a reported 1 × 10⁹ is a difference in assay conditions, not in evolved quality. Both enzymes are perfect in the only sense the number can express.
Second, the ratio holds only when substrate sits well below Km and enzyme sits well below substrate. For a tight-binding inhibitor or a tight substrate, the measured value can be limited by association rate instead of by any catalytic step, and the steady-state assumption that produced the formula breaks down. Two labs can report the same enzyme a decade apart and disagree tenfold; the measured number is a property of the assay as much as of the protein.
The bands are a reading aid, and one boundary moves with your rounding
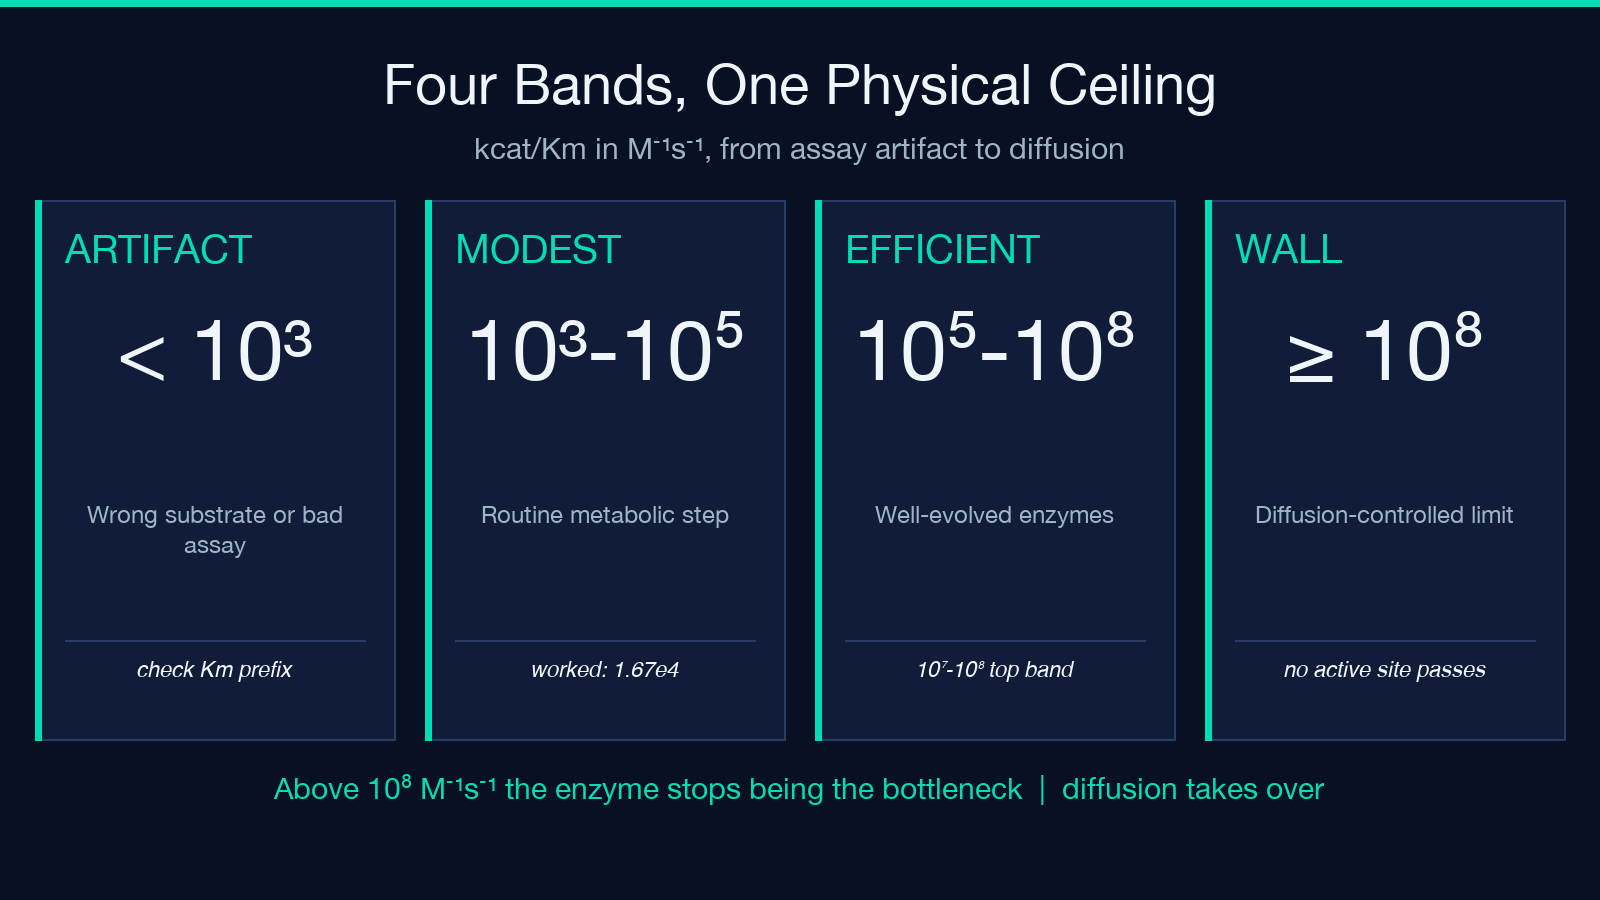
The calculator bands the result: below 10³ inefficient, 10³ to 10⁵ modest, 10⁵ to 10⁷ efficient, 10⁷ to 10⁸ the next band up, and 10⁸ and above the diffusion-controlled region.
Two honest caveats on that ladder.
The band is assigned from the rounded result, so the decimal-places setting can change the verdict. Set decimals to zero and a 999.6 M⁻¹s⁻¹ measurement rounds to 1000 and reads “modest” instead of “inefficient”. The number did not change; the label did.
The 10⁷ boundary also sits in the next band, not the current one. A result of exactly 1.00 × 10⁷ M⁻¹s⁻¹, which is what the tool’s first published example produces, returns the 10⁷ to 10⁸ label, while the prose above calls 10⁵ to 10⁷ “efficient.” Read the bands as ranges with open upper ends, not as words to quote in a figure caption.
There is a sharper edge too. kcat accepts zero, because the validator only rejects negatives. A blank or mis-bound field that arrives as 0 forces a confident diagnosis of an inefficient enzyme instead of an error. Km is validated more strictly and rejects zero outright, since the ratio is undefined there. If your result reads inefficient at the last digit, check that the kcat field was populated before you believe the readout.
A worked example you can check by hand
Both cases below come from the tool’s published examples, so you can reproduce each step.
Direct mode. kcat = 1000 s⁻¹, Km = 100 µM. Convert Km to molar: 100 µM = 1.0 × 10⁻⁴ M. Divide 1000 by 1.0 × 10⁻⁴ to get 1.00 × 10⁷ M⁻¹s⁻¹. One order of magnitude below the diffusion limit, inside the 10⁷ to 10⁸ band.
From Vmax. A saturated assay gives a measured Vmax = 50 µM/min with 2 µM of active sites, so kcat = 25 min⁻¹ = 0.4167 s⁻¹. With Km = 25 µM, divide 0.4167 by 2.5 × 10⁻⁵ M for 1.67 × 10⁴ M⁻¹s⁻¹, banded modest. That is a routine metabolic step, not a diffusion-limited one, and the label says so.
Run both by hand once. Running them removes the abstraction from the conversions, and you will spot a bad Km prefix from the order of magnitude alone.
Report the pair, not the ratio alone
A ratio can hide its inputs, which is how contradictory values for the same enzyme build up in review articles. Report kcat and Km separately, each with units, beside the ratio.
Add the conditions that move both numbers: temperature, pH, buffer, ionic strength, the substrate range used for the fit, and whether kcat came from Vmax with an active-site titration or from a direct measurement. A Km measured at 25 °C does not transfer to a 37 °C assay, and a kcat derived from total protein instead of active sites is off by an unknown factor that no reviewer can recover.
If the comparison matters, fix the conditions and vary one thing. Same buffer, same temperature, same enzyme batch, different substrate. Then the ratio ranks the substrates. Change two variables and it ranks your pipetting.
Run the arithmetic before you cite the paper
The kcat/Km calculator exists for the boring, high-value step: checking a number you already have against the conversions above. It shows the result numerically and in scientific notation, reports the band, and states the steady-state assumption in its caveats so you cannot forget it mid-figure.
Two neighbours cover the rest of the workflow. The turnover number calculator derives kcat from Vmax and enzyme concentration, and the Ki calculator handles inhibition constants when your substrate comparison turns into a competition experiment. Browse the full Education catalog if you want the surrounding kinetics tools in one place.
Feed it the two inputs, then read the band as a sanity check, not a grade.
I set out to argue that kcat/Km is the honest number and kcat is the vanity one. Half of that survives contact with the arithmetic.
For ranking substrates of one enzyme, the ratio is the only fair comparison available, and it catches a 60× unit slip before a reviewer does. For ranking one enzyme against another, it measures proximity to a diffusion ceiling no active site can engineer past. Both jobs are real. Neither one is efficiency in the sense the word suggests.
So ask what job your last figure caption gave the number, and whether it would survive being asked out loud? That question is the point.
本文有中文版:kcat 最高的酶,往往是输家
