8 Free Interactive Finance Tools That Make Risk and Uncertainty Actually Understandable
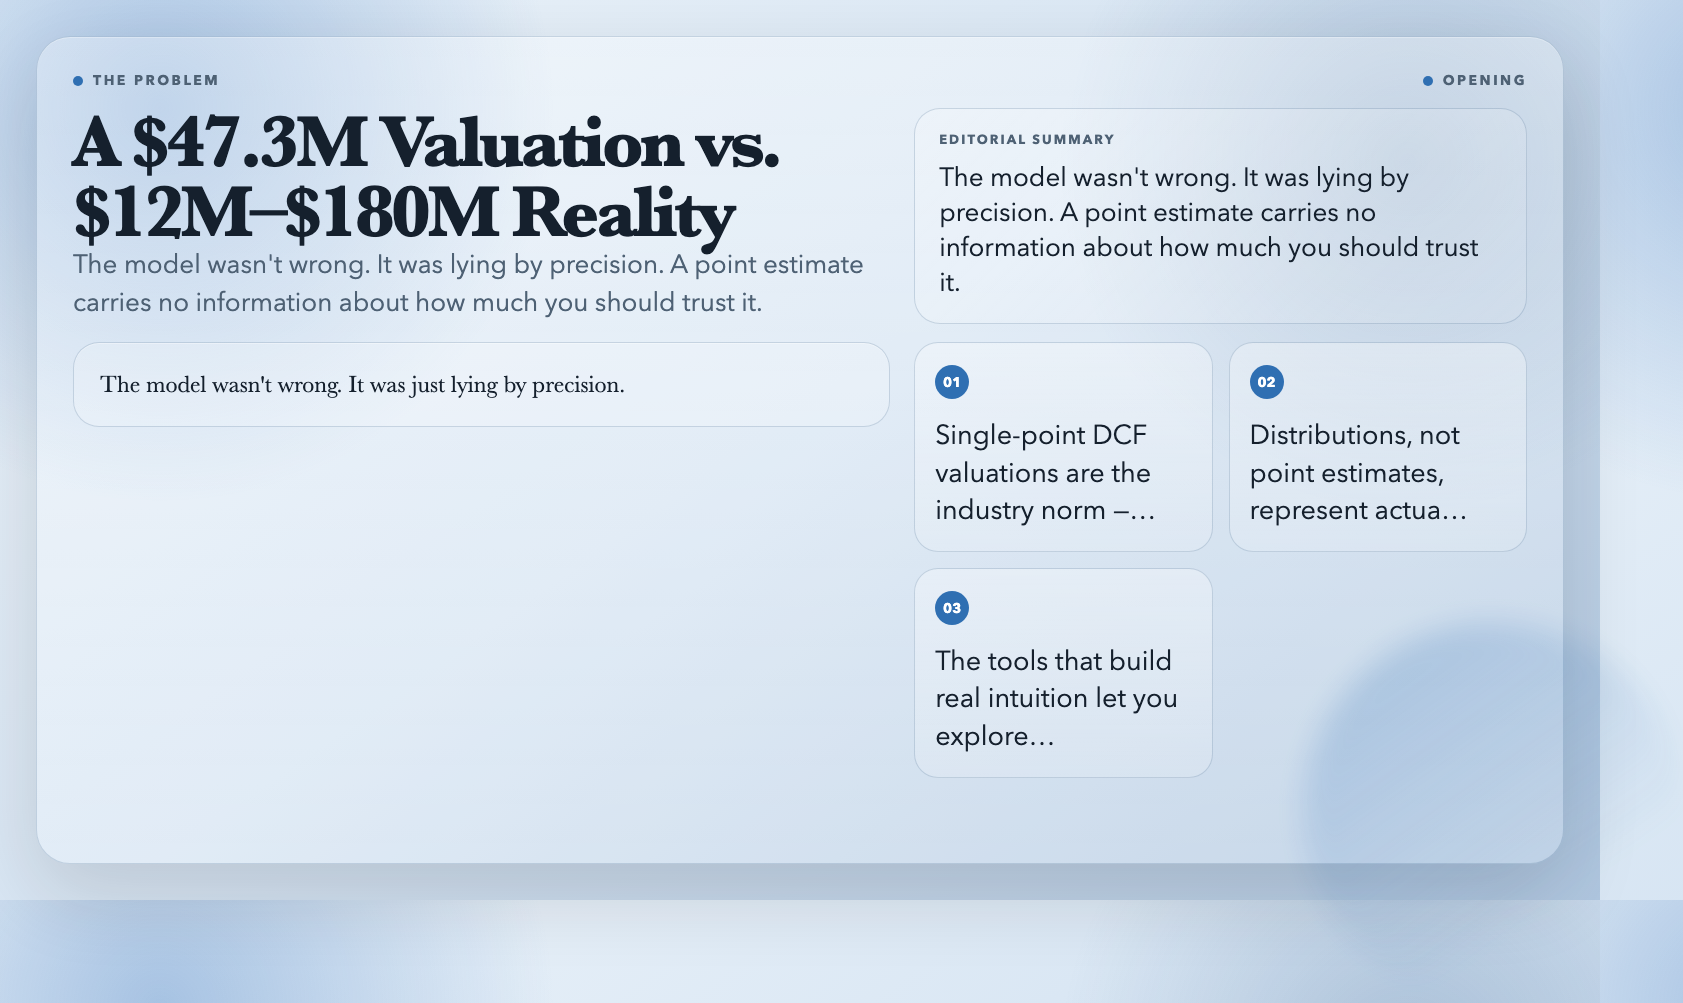
Every analyst has run a DCF model that spat out a precise valuation — $47.3 million — and then watched the stock trade at $12 million or $180 million within two years. The model wasn’t wrong. It was just lying by precision. A point estimate carries no information about how much you should trust it.
Real financial decisions aren’t about point estimates. They’re about distributions, ranges, and the space between what the model says and what actually happens. These eight free browser-based tools let you build intuition for that space by making abstract financial concepts interactive. No Excel. No sign-up. Just open and explore.
—
#
1. Option Greeks Visualizer — See How Derivatives Actually Respond to Market Moves
Options pricing is notoriously hard to reason about. You know the Black-Scholes formula exists. You know there are “Greeks” — delta, gamma, theta, vega, rho — that describe how an option’s price changes. But static textbook explanations don’t show you what happens when spot price, time, and volatility all move simultaneously.
The Option Greeks Visualizer puts all five Greeks on a single interactive canvas. The centerpiece is a 3D price surface — rotate it with your mouse and watch how call and put values warp across the spot-price-by-time-to-expiry landscape. Around it, five heatmaps (one per Greek) show you the full two-dimensional sensitivity map for each parameter.
Delta heatmap shows you exactly where the option behaves most like the underlying asset (delta near 1.0 at deep in-the-money) versus most like pure time value (delta near 0 at deep out-of-the-money). The insight isn’t new — but seeing it rendered in color gradients as you drag the spot price slider is something a textbook can’t replicate.
You get four preset configurations: ATM Baseline, Deep ITM, High Volatility, and Near Expiry. Each preset resets all inputs so you can immediately see how the Greek landscape shifts under different conditions. Run the high-volatility preset and watch gamma spike at the money — suddenly the concept of gamma as “delta’s rate of change” makes intuitive sense.
👉 Explore Option Greeks Visualizer
—
#
2. Confidence Interval Calculator — Let Your Data Tell You How Sure You Should Be
“We are 95% confident the true mean lies between X and Y.” Most people who say this don’t know what it actually means. It doesn’t mean there’s a 95% probability that the true mean is in that range — it means the method produces an interval containing the true mean 95% of the time, if you repeated the sampling many times. That distinction matters enormously in how you interpret any statistical result.
The Confidence Interval Calculator on ElysiaTools makes this viscerally clear. You paste a CSV, it auto-detects numeric columns, calculates mean and standard deviation, and shows the confidence interval in real time as you drag the confidence level slider. Watch the interval widen sharply as you push from 90% to 99%. Then watch it collapse as you add more data points. The relationship between sample size, spread, and confidence level becomes impossible to misunderstand.
The tool handles both known and unknown standard deviation cases — the Z-interval vs. t-interval problem that trips up even people who’ve taken statistics.
👉 Try Confidence Interval Calculator
—
#
3. Stock Option Calculator — Black-Scholes Without the Code
If you’ve ever wanted to price an option using Black-Scholes but didn’t want to implement the cumulative normal distribution function from scratch, the Stock Option Calculator is the no-code alternative. Spot price, strike price, time to expiry, risk-free rate, volatility — in return, you get call and put prices plus all five Greeks.
What makes this genuinely useful isn’t the price output itself — it’s the scenario capability. What happens to the put price if IV spikes from 25% to 50%? What does the call look like with six months instead of three? Drag the sliders and the answer comes in under a second. After running a dozen scenarios, you have a feel for option behavior that no formula study gives you.
👉 Try Stock Option Calculator
—
#
4. DCF Simulator — What Your Valuation Actually Depends On
Discounted cash flow analysis produces a single number. That number feels authoritative. It almost never is.
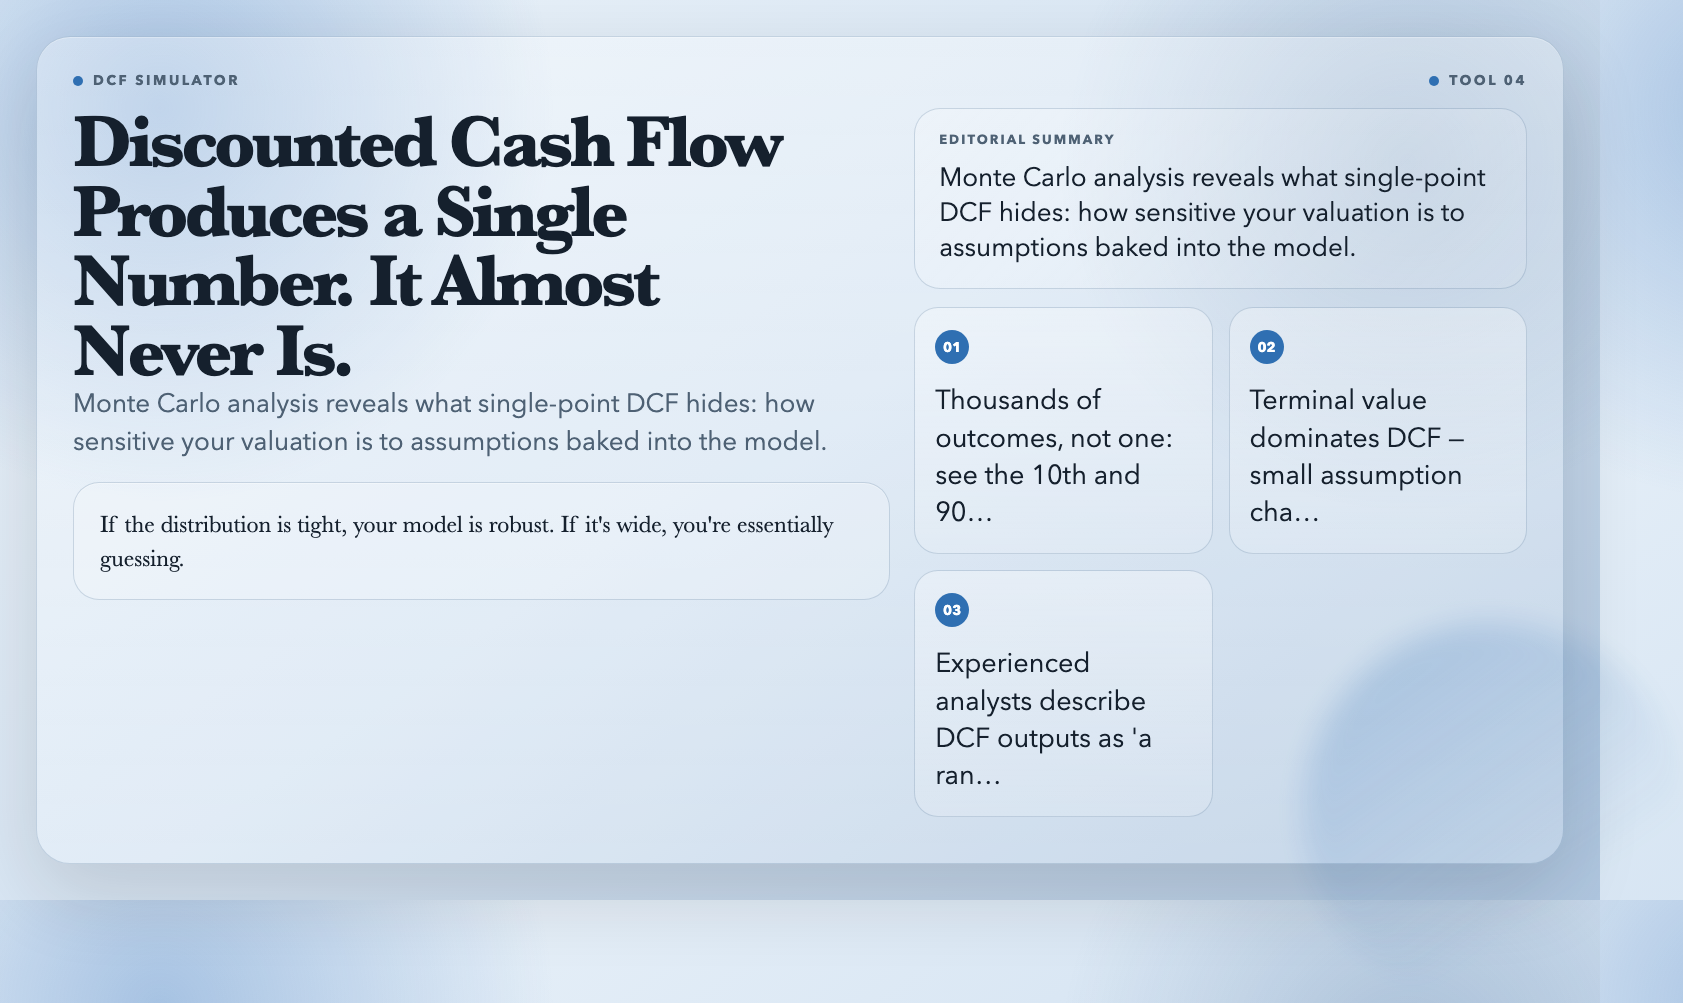
The DCF Simulator runs Monte Carlo analysis on your DCF model. Instead of one deterministic output, you get a distribution of possible valuations — thousands of outcomes, each with slightly different assumptions about growth rate, discount rate, and terminal value. The output is a probability distribution: where is the mean? Where does most of the mass fall? What are the 10th and 90th percentile outcomes?
This exposes something most DCF analyses hide: how sensitive your valuation is to the assumptions baked into the model. If the distribution is tight, your model is robust. If it’s wide, you’re essentially guessing — and the single-point estimate was giving you a false sense of precision. Running the simulation with real inputs is the fastest way to understand why experienced analysts describe DCF outputs as “a range, not a number.”
👉 Try DCF Simulator
—
#
5. Correlation Analyzer — Understand How Variables Actually Move Together
Correlation coefficients are famously misunderstood. A correlation of 0.7 sounds moderate. But without seeing the scatter plot, you can’t know whether you’re looking at a clean linear relationship, a relationship distorted by outliers, or a non-linear pattern entirely.
The Correlation Analyzer takes two variables and produces a scatter plot, correlation matrix, and regression line. Upload a CSV, the tool auto-identifies numeric columns, and you can explore correlations across multiple variables in a single view. The scatter plot shows you the actual data cloud, not just the abstract number.
Here’s the concrete payoff: two variables with a correlation of 0.5 can look dramatically different depending on their joint distribution. Seeing the scatter plot — how tight the cloud is, whether there are obvious outliers, whether the relationship curves — changes how you interpret the coefficient. This is also the foundation of portfolio diversification intuition: covariance is what drives the benefit, not just correlation magnitude.
👉 Try Correlation Analyzer
—
#
6. Amortization Schedule Generator — See Exactly Where Your Money Goes
Amortization is one of the most practically important financial concepts — and one of the most misunderstood. Most people know that early payments in a mortgage are “mostly interest.” But they can’t tell you exactly how much principal vs. interest is in payment 60 versus payment 180 versus payment 360. The Amortization Schedule Generator makes this visible in a single interactive schedule.
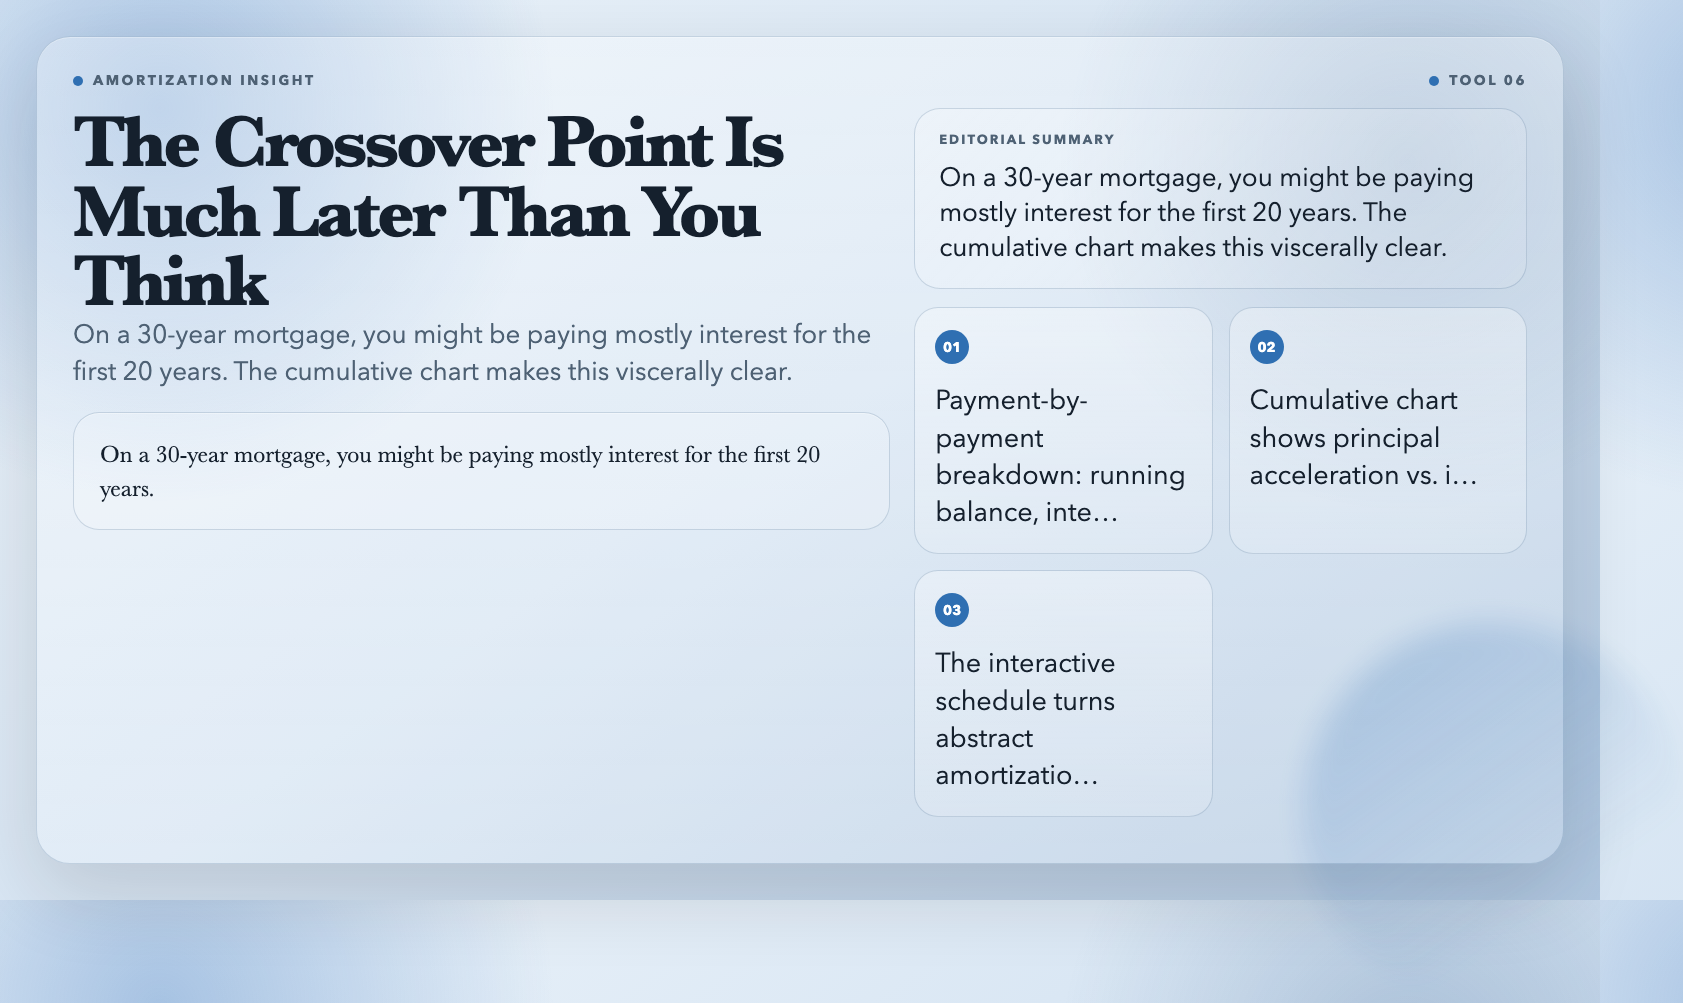
Enter principal, annual interest rate, and term. The tool generates a full month-by-month breakdown: running balance, interest portion, principal portion, and cumulative interest paid for every single payment. The cumulative chart is where the insight lands. Watch the principal line accelerate as the interest line flattens. The crossover point where principal starts dominating interest is much later than most people expect — on a 30-year mortgage, you might be paying mostly interest for the first 20 years.
👉 Try Amortization Schedule Generator
—
#
7. Z-Score Calculator — Put Any Number in Context
The Z-score tells you how many standard deviations a given value is from the mean. It bridges descriptive statistics (what is) and inferential statistics (what it means). The Z-Score Calculator computes it instantly and visualizes where that value sits on the normal distribution curve.
Enter a value, the mean, and the standard deviation. The tool shows you the Z-score, the percentile (what proportion of values fall below yours), and shades the area under the curve up to your Z-score. That shading is the key. It makes the percentile intuitive: the shaded area is literally the proportion of values below yours.
In finance, this applies directly to returns and risk. Values beyond ±3 standard deviations (Z > 3 or Z < -3) are statistical outliers. Knowing where those thresholds lie — without having to calculate — changes how you think about “tail risk.” The Z-Score Calculator gives you that threshold sense in seconds.
👉 Try Z-Score Calculator
—
#
8. Covariance Calculator — Understand Joint Variability, Not Just Direction
Correlation measures the direction and strength of a linear relationship on a normalized scale (-1 to +1). Covariance measures the raw joint variability — how two variables vary together, in the original units of measurement. A high correlation can coexist with very different covariances depending on the individual variances — and this distinction has real consequences in portfolio construction.
The Covariance Calculator takes two variables (or a CSV), calculates covariance, and displays it alongside a scatter plot. The scatter plot is what makes the distinction useful. You see the actual joint distribution — not just the normalized correlation number — which lets you judge whether the observed relationship is practically significant.
In portfolio theory, covariance is what determines diversification benefit. Two assets with correlation near zero might still have meaningful covariance depending on their individual volatilities. This tool gives you the building block for understanding that relationship.
👉 Try Covariance Calculator
—
#
The Pattern: Understanding Over Calculation
Every one of these tools could be replaced by a spreadsheet formula. None of them would be as illuminating.
Financial concepts — option sensitivity, confidence intervals, amortization dynamics, distribution tails — are genuinely hard to reason about from static explanations. A textbook description of delta says “it measures the rate of change of option price with respect to underlying price.” The Option Greeks Visualizer shows you delta changing as spot price changes, with the 3D surface warping in real time. The difference in comprehension is immediate.
This is what ElysiaTools does across all 1,500+ tools on the platform: it makes the abstract interactive. When you can move a slider and watch a chart respond, understanding replaces memorization.
Pick one tool from this list. Not to become a finance expert — you won’t. But because ten minutes with a live chart builds something a textbook can’t: a gut feel for where the model is brittle, where small inputs create large swings, and why a single number is never the whole story.