8 Free Fractal & Chaos Visualizations That Reveal Why Simple Rules Create Infinite Complexity
# 8 Free Fractal & Chaos Visualizations That Reveal Why Simple Rules Create Infinite Complexity
In 1961, Edward Lorenz restarted a weather simulation on a Royal McBee computer. He entered 0.506 instead of 0.506127—a difference of one part in a thousand. The result was a completely different forecast. He’d just discovered sensitive dependence on initial conditions, and it would change science forever.
The unsettling truth Lorenz uncovered: most systems that actually matter—weather, economies, the human heart, ecosystems—all behave this way. Small errors grow exponentially. Predictions collapse beyond a horizon. And the math behind this isn’t advanced. It’s usually just a few lines of code, run thousands of times.
These eight free interactive visualizations let you see chaos theory with your own eyes. No math degree required.

1. The Mandelbrot Set — Three Lines of Code, Infinite Complexity
The formula fits on a napkin: z = z² + c. Pick any complex number c. Set z = 0. Iterate. If the result never escapes beyond |z| = 2, mark c black. If it flies off to infinity, color it by how fast it escaped.
What comes back is a shape that looks like a blurry beetle. But zoom into any edge, and you’ll find smaller copies of the whole thing—then smaller copies of those. Zoom again. The detail never ends. Mathematicians call this self-similarity, and it shows up in coastlines, mountain ranges, and lung branching too.
The Mandelbrot set also has a non-integer dimension—around 2, technically. It’s not quite a 2D shape, not quite 1D. It lives in the space between dimensions, and no amount of zooming reveals all its structure.
Benoit Mandelbrot coined the word “fractal” in 1975 after spending years trying to measure coastlines, realizing their length depended entirely on how small a ruler you used.
Explore it: Mandelbrot Set Fractal Explorer
2. The Julia Set — Every Parameter Is a Different Universe
Same formula. Different setup: fix c, vary the starting point z. Pick a different c and you get a completely different fractal. Some Julia sets look like connected blobs. Others look like dust scattered across the plane. Some have tree-like branches with no interior at all.
Mathematician Gaston Julia worked these out by hand in 1918—he could never explore them interactively. The connection he didn’t live to see: the Mandelbrot set is literally a map of all possible Julia sets. Points inside the Mandelbrot set produce connected Julia shapes. Points outside produce dust. The boundary between them is where all the interesting Julia sets live.
Explore it: Julia Set Explorer
3. The Logistic Map — Order Collapses into Chaos
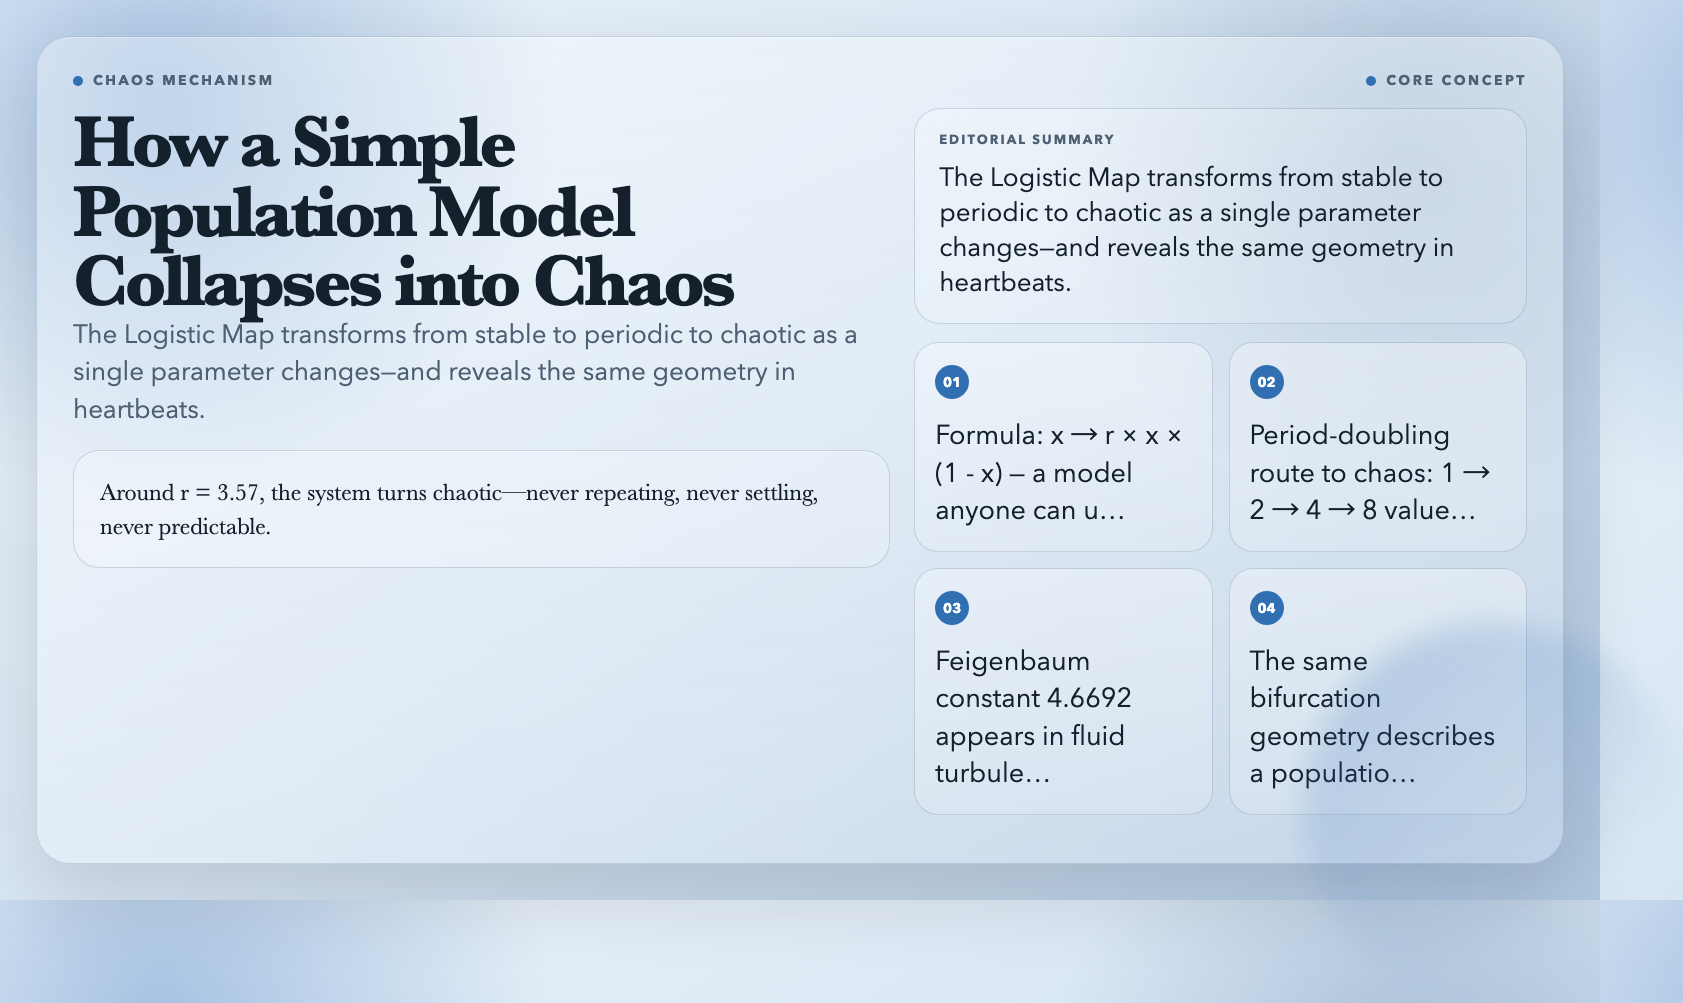
Try this: x → r × x × (1 – x). For low r, the population settles into one value. Bump r: it splits, oscillating between two values. Higher r: four values. Then eight. Then sixteen.
Then, around r = 3.57, the splitting stops. Instead, the system turns chaotic—never repeating, never settling, never predictable.
But here’s what makes researchers lose sleep: embedded in that chaos are islands of stability. Adjust r to just the right value and the system snaps into a cycle, then splits again, then dissolves back into chaos. This pattern—period-doubling, chaos, stability windows—repeats inside the chaos, inside the windows, at infinitely many scales.
Mitchell Feigenbaum discovered this in the 1970s and found something stranger: the ratio between successive bifurcation intervals converges to 4.6692, regardless of what system you’re modeling. The same number appears in fluid turbulence, neural oscillations, and heart rhythm transitions. No one knows exactly why.
Explore it: Logistic Map Explorer
4. The Bifurcation Diagram — See the Chaos
The bifurcation diagram is the Logistic Map turned visual. For each r value, iterate thousands of times, discard the first thousand, then plot every remaining x. What emerges is a clean branching structure that eventually dissolves into a fog—the visual signature of chaos.
Medical researchers found the same structure in heartbeat data. Healthy hearts show periodic patterns. Arrhythmias show bifurcations—the heart is following the same mathematical path as the Logistic map on its way into fibrillation. The geometry is identical. That’s not a metaphor. It’s a literal mathematical isomorphism.
Explore it: Bifurcation Diagram
5. The Double Pendulum — Watch Chaos Happen
Two hinges. Two rods. Let it go. You’ll never see the same motion twice.
This isn’t randomness—it’s deterministic chaos. The same starting angle produces the same trajectory every time. But the sensitivity is brutal: a starting angle off by one degree produces an entirely different swing pattern after just a few seconds. Two pendulums released nearly identically diverge into unrelated motions.
In stable systems, small errors stay small. In chaotic systems, they compound exponentially. The double pendulum makes this viscerally obvious. You can watch the error grow in real time.
Explore it: Double Pendulum Simulator
6. The Lorenz Attractor — The Butterfly That Changed Weather Forecasting
Lorenz’s attractor is a 3D trajectory that never intersects itself, never repeats, yet never escapes a bounded region. It constantly folds and twists—always the same shape, never the same path.
Lorenz wasn’t hunting for chaos theory. He was trying to simulate weather. What he found: long-range weather prediction is fundamentally impossible, not because computers are weak, but because the system has a prediction horizon of roughly two weeks. After that, errors swamp the signal.
The butterfly shape gave the “butterfly effect” its name. But the real insight is more unsettling: you can’t predict where the butterfly lands, even if you know exactly how it flaps.
Explore it: Lorenz Attractor
7. Cellular Automata — How Four Rules Generate Everything
Conway’s Game of Life runs on four rules:
1. A live cell with 2-3 neighbors survives.
2. A dead cell with exactly 3 neighbors becomes alive.
3. All other live cells die.
4. All other dead cells stay dead.
Start with a random grid. Run four billion iterations. You’ll see gliders—configurations that move across the grid. You’ll see oscillators—patterns that pulse. Stable structures that persist without changing. And interactions between structures that produce entirely new behaviors.
Rule 30 is worse: a single black cell on white, evolved by a different rule set, produces output that fails every statistical test for randomness—yet it’s generated by the simplest deterministic process imaginable.
Stephen Wolfram spent a decade studying these systems and published *A New Kind of Science* in 2002. His argument: computation, not physics, may be nature’s fundamental language.
Explore it: Cellular Automata Rule 30/110
8. The Henon Map — Two Equations, Full Chaos
The Henon map: x₁ = 1 – ax² + y₀ and y₁ = bx₀. Two lines of algebra. With a = 1.4 and b = 0.3, it produces a strange attractor with fractal structure—deterministic, bounded, never repeating.
The same geometry shows up in the Lorenz system, discovered through completely different methods. The fact that two independent research paths converge on the same structure suggests chaos isn’t a quirk of particular systems. It’s a universal feature of nonlinear dynamics.
Explore it: Henon Map Explorer
The Horizon Problem
These visualizations teach the same lesson: simple deterministic rules produce output that looks random, resists prediction, and generates infinite complexity.
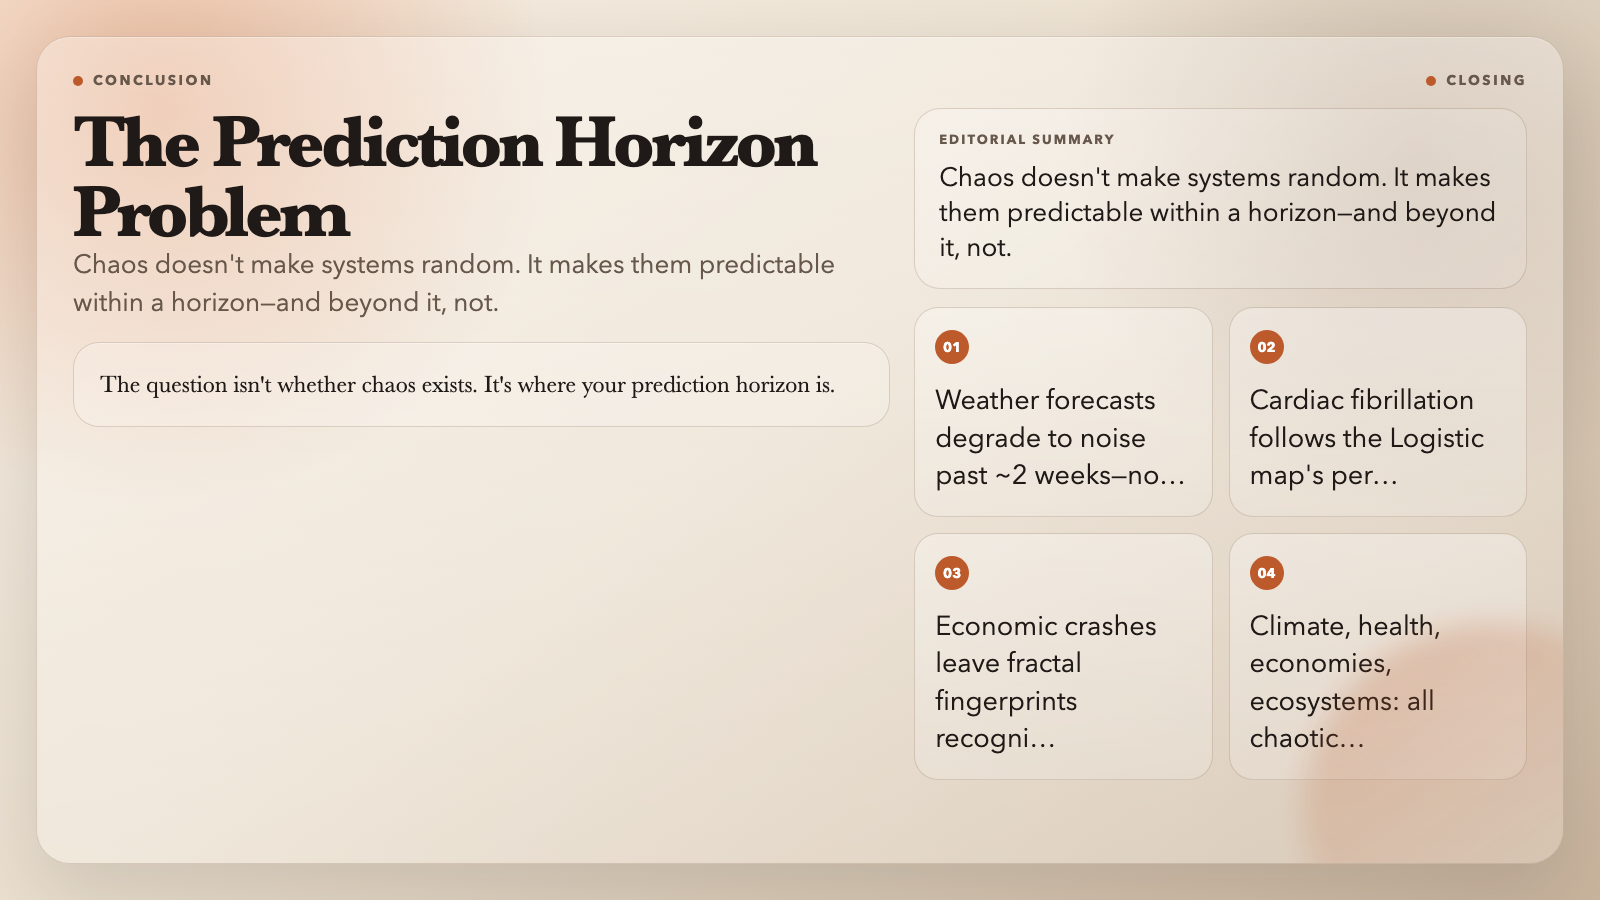
Weather forecasts degrade to noise past two weeks. Cardiac fibrillation follows the Logistic map’s period-doubling route to chaos. Economic crashes leave fractal fingerprints recognizable in hindsight but invisible in foresight.
Systems that matter most—climate, health, economies, ecosystems—are all chaotic. That doesn’t mean they’re random. It means they’re predictable within a horizon, and beyond it, they’re not.
The question isn’t whether chaos exists. It’s where your prediction horizon is, and whether you’re operating inside it or past it.