Why a Simple Spring Can Predict Stock Crashes and Bridge Collapses
The bridge you’re driving over stays up. The power grid doesn’t black out. The airplane doesn’t shake itself apart mid-flight. None of this is guaranteed. Every one of these systems can fail — and for the same deep mathematical reason.
It’s called the Duffing oscillator, and it’s one of the most brutally honest tools in applied mathematics.
The Equation That Breaks Determinism
Most of us learned about oscillators in physics class: a mass on a spring, bouncing back and forth, forever. The math is clean. Predictable. ÿ + ω²y = 0. Give it an initial push and you can calculate exactly where the mass will be at any future moment.
The Duffing oscillator adds three small words to that story: and nonlinear stiffness.
The equation is:
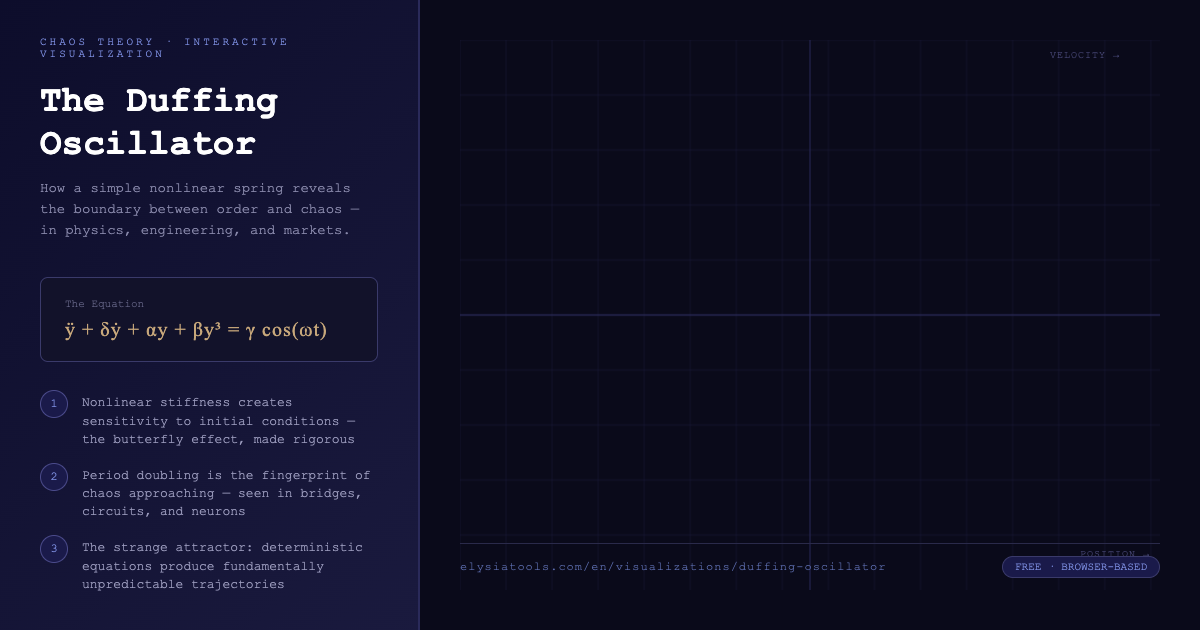
ÿ + δẏ + αy + βy³ = γ cos(ωt)Don’t panic. Here’s what each term actually does:
– δ (damping) — bleeds energy out of the system. Real springs get hot. Real bridges have air resistance.
– α (linear stiffness) — the normal spring behavior. Push it, it pushes back proportionally.
– β (nonlinear stiffness) — the twist. Push harder and the spring doesn’t just push back proportionally — it pushes back disproportionately. This is what real materials do.
– γ and ω — an external periodic force. Wind on a bridge. Voltage ripples in a circuit. Heartbeat rhythms in biology.
The moment you add βy³, the system stops being perfectly predictable in the long run.
The Phase Portrait: Where Order Dies
Open any textbook and they’ll show you a phase portrait — a plot of velocity versus position. For a simple harmonic oscillator, it draws a perfect ellipse, forever. The Duffing oscillator starts that way too.
But if you tune the parameters — increase the driving force γ — something strange happens.
The ellipse begins to distort. It develops loops. Then it splits into two distinct branches. Then four. Then eight. This is period doubling, and it’s the fingerprint of chaos approaching.
Keep pushing and the trajectory stops repeating altogether. It fills a region of the phase plane with intricate, never-repeating spirals. You’ve hit a strange attractor.
Here’s what makes it unsettling: the equation that produced this trajectory is completely deterministic. No randomness. No dice rolls. Just ÿ + δẏ + αy + βy³ = γ cos(ωt) — a clean set of symbols on a clean sheet of paper. And yet the result is fundamentally unpredictable beyond a certain time horizon.
This is sensitivity to initial conditions: the butterfly effect made rigorous. Two trajectories that start a millimeter apart will diverge exponentially. You can know the equation perfectly and still not know where the system will be in 30 seconds.
The Poincaré Section: Your Chaos Detector
If phase portraits are too dense to read, mathematicians use a trick called a Poincaré section. You wait for the driving force to complete one full cycle, then sample the system’s state at exactly that moment. Do it again, and again, for thousands of cycles.
A periodic oscillator produces a single point on the Poincaré section. Two-period motion produces two points. Four-period produces four.
Chaos produces something else entirely: a fractal structure. Points that seem random but follow a hidden geometry. The same structure appears whether you’re simulating a circuit, a bridge cable, or a neuronal cluster. It’s universal.
The visualization at Duffing Oscillator on ElysiaTools lets you build these sections interactively. Watch the Poincaré section transform as you slide the damping coefficient or the drive amplitude. Period doubling happens in real time. You can see chaos appear.
The Double Well: When Two Worlds Collide
Here’s where it gets physically meaningful.
When α < 0 and β > 0, the potential energy of the system has two minima — two valleys separated by a hill. The particle can settle in either valley, oscillating around one equilibrium point or the other.
Now add a moderate driving force. The particle oscillates in its valley. Everything looks stable.
Then you increase the drive amplitude just slightly.
The particle suddenly has enough energy to climb over the hill and fall into the other valley. Then back. Then — if the parameters are right — it starts hopping erratically between both wells. The system becomes bistable and chaotic simultaneously.
This is exactly what happens in:
– Bridge cables in wind: they don’t just oscillate in one mode — they can jump between galloping and vortex-induced modes, unpredictably
– Power grids near resonance: generators can snap between sync and async states, triggering blackouts
– Cardiac tissue at certain pacing rates: the heart rhythm bifurcates into life-threatening arrhythmias
The math is the same. The consequences are not.
What You Can Actually Do With This
The ElysiaTools visualization gives you five presets to explore:
1. Classic Chaos — the double-well potential with parameters tuned to produce genuine chaotic motion. Watch the phase trajectory never repeat.
2. Double Well — the bistable regime. Try to predict which well the particle ends up in after a given time.
3. Periodic — the orderly regime. A closed loop in phase space. This is what naive linear models always predict.
4. Hard Spring — α > 0, single-well. The stiffness increases with displacement, as in some real materials.
5. Free Oscillation — no driving force. Watch the damped spiral inward to equilibrium.
Each preset teaches you something different. The periodic regime is the lie that most engineering models are built on. The chaotic regime is the truth that most safety margins are tested against.
The Bridge in Your Commute
In 1940, the Tacoma Narrows Bridge collapsed in 40 mph wind — wind well within the bridge’s rated承受. Engineers had modeled it as a simple harmonic oscillator. It wasn’t. It was a Duffing oscillator with a nonlinear stiffness term that nobody had accounted for. The bridge twisted itself apart because its torsional mode coupled with its bending mode through a nonlinear resonance that linear analysis missed.
Every modern bridge has tension cables, suspension systems, and aerodynamic shapes that behave nonlinearly at high wind loads. The Duffing equation doesn’t tell engineers what will fail. But it tells them where to look for failure modes that linear models can’t predict.
This is why interactive chaos visualizations matter. Not because you’ll solve the Navier-Stokes equations over a suspension bridge — but because you’ll develop the intuition that tells you not to trust the clean ellipse.
Try It
The Duffing Oscillator visualization is free and runs entirely in your browser. No download. No signup. Slide the parameters, watch the phase portrait evolve, see period doubling happen in real time.
Pay attention to what happens at the boundary between periodic and chaotic behavior. That’s where real systems spend most of their time — not in clean textbook order and not in full chaos, but in the zone where order is breaking down.
That’s also where surprises live.
Tags: mathematics, physics, chaos-theory, visualization, engineering