# 5 Free Interactive Tools That Reveal Why We Keep Missing the Obvious Risks
In October 2012, hurricane forecasters watched Hurricane Sandy turn left. The models had been consistent: Sandy would head east into the Atlantic. Instead, it made a sharp west turn and struck New Jersey. $68 billion in damages later, the meteorology was sound — but it had not been the forecast.
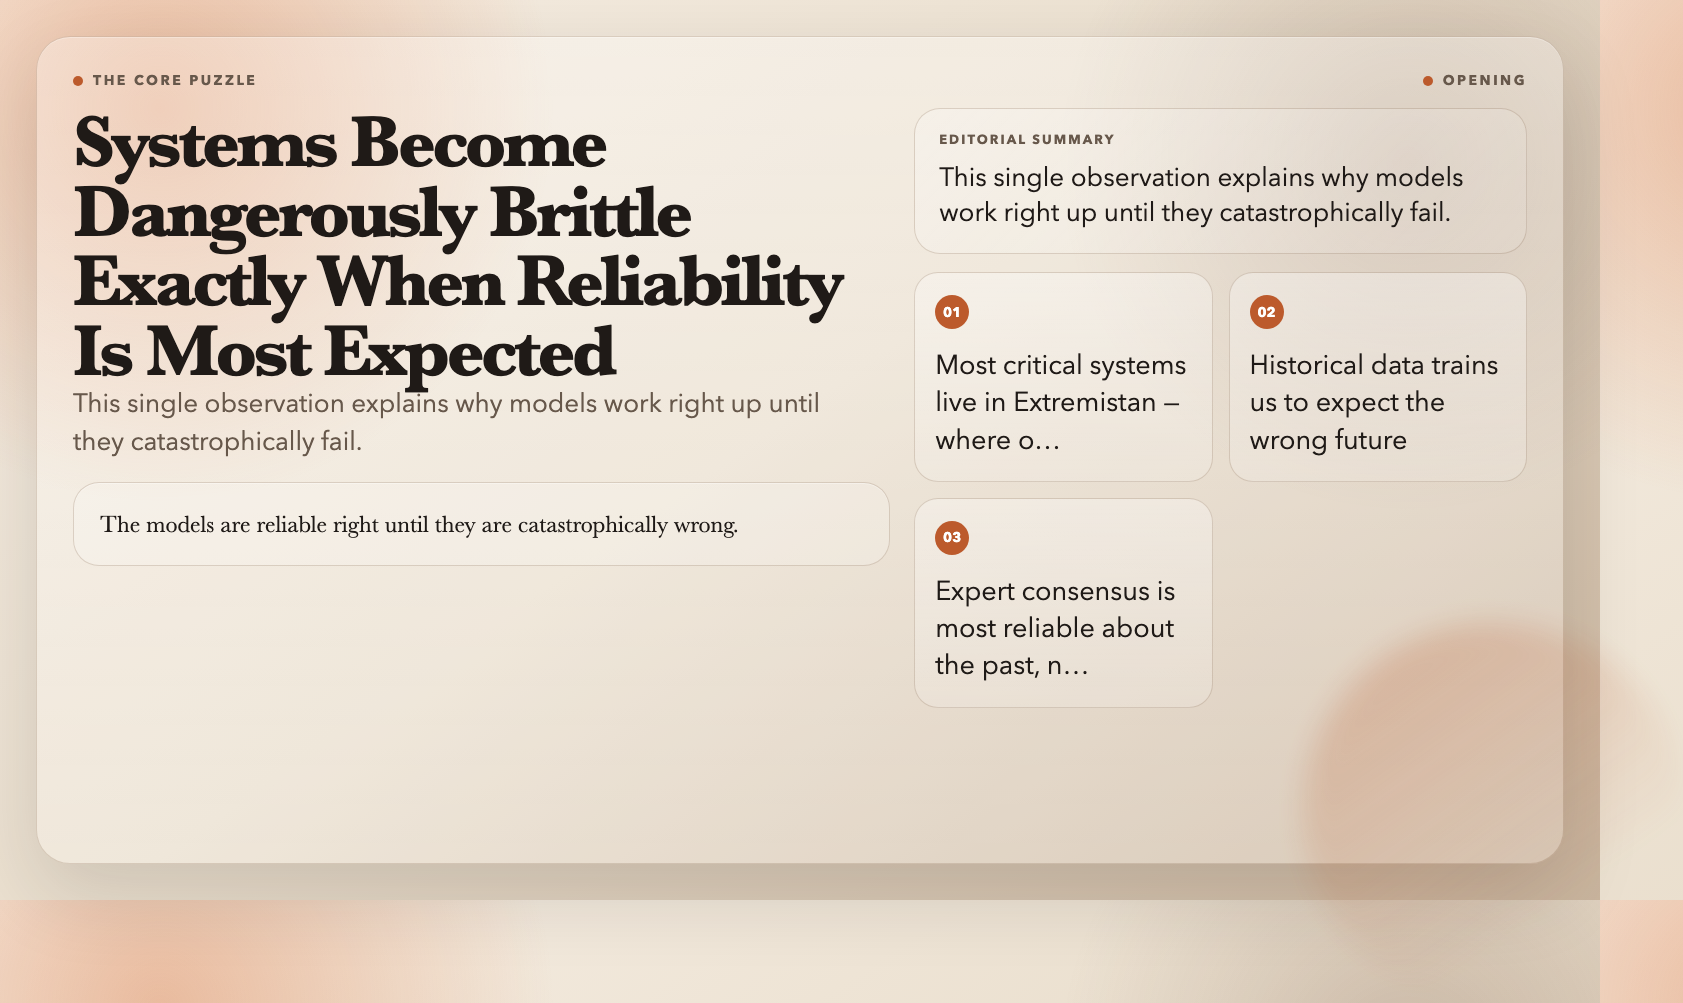
Meteorologists had the right physics and the wrong luck. This is the core puzzle of risk: systems built on reliable patterns become dangerously brittle at exactly the moments when reliability is most expected.
Nassim Nicholas Taleb spent two decades mapping this puzzle. Michele Wucker named its more common cousin — the risk we see coming and choose to sidestep. A team at Catania University won the Ig Nobel Prize for proving that luck outperforms talent in simulations. And Kate Raworth drew a甜甜圈 to challenge how economists measure prosperity.
Here are five free interactive tools that rewire how you think about risk, inequality, and decision-making.
1. The Turkey Problem: Why Every History Lesson Is a Trap
A turkey is fed for 1,000 consecutive days. Each feeding strengthens the same conclusion: the pattern is stable, tomorrow will resemble today.
The turkey’s confidence peaks on day 1,000.
On day 1,001, it is Thanksgiving.
Nassim Nicholas Taleb calls these Black Swans. Three properties: unpredictable, extreme impact, retrospectively explicable. The turkey has 1,000 days of evidence for a false model.
The Black Swan visualization at ElysiaTools runs this experiment live. You watch the turkey’s trust score climb with every feeding. Then you trigger Thanksgiving.
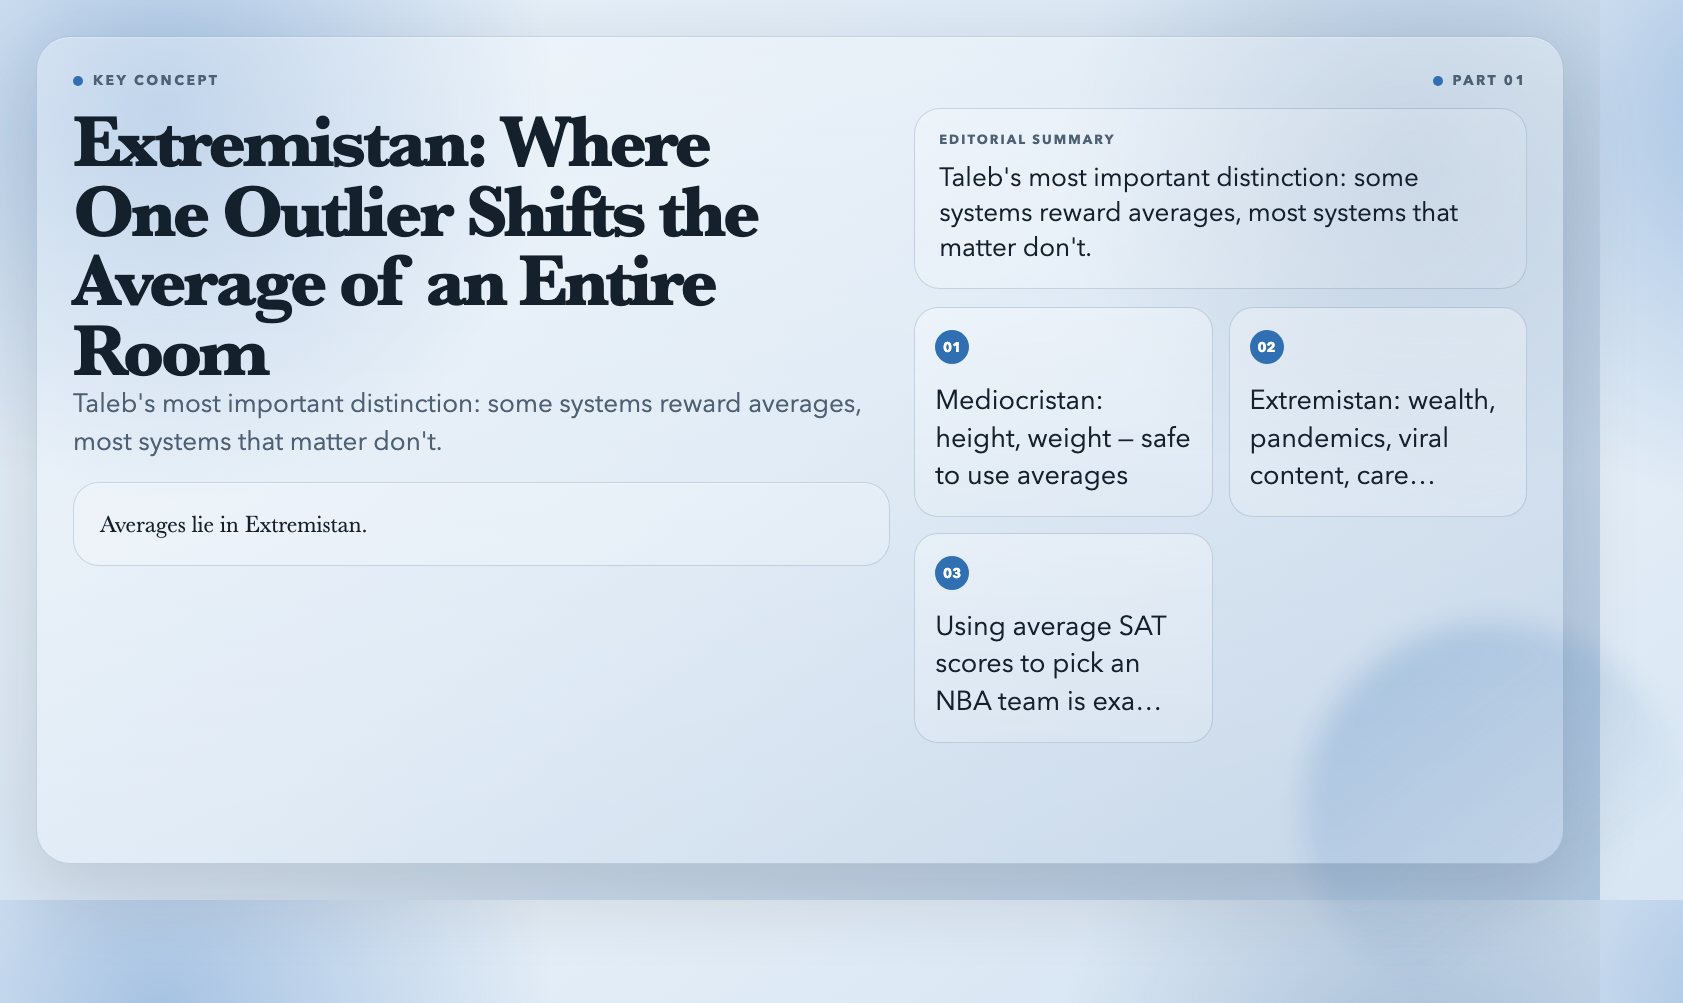
The more important lesson lives in Taleb’s distinction between two worlds:
– Mediocristan: One person’s height barely changes the average. Influenced by the collective. Safe to use averages.
– Extremistan: One person’s wealth shifts the average of an entire room. Dominated by outliers. Averages lie.
Markets. Pandemics. Viral content. Career success. Most systems that matter live in Extremistan. Relying on historical averages there is like using average SAT scores to select an NBA starting lineup.
Try it: Black Swan Theory Visualization
2. Gray Rhinos: The Charge You See Coming and Choose to Ignore
Black swans are genuinely unforeseeable. Gray rhinos are the opposite — obvious, probable, high-impact, and systematically ignored.
Michele Wucker coined the term after watching Greece’s debt crisis unfold: warning signs were published, models were clear, and politicians chose delay until options narrowed to bad and worse. She defines a gray rhino as a highly probable threat that institutions sidestep because addressing it would be costly, inconvenient, or politically uncomfortable.
Climate change is the canonical case. The International Energy Agency issued its first major warning in 2007. The IPCC published clarion calls throughout the 2010s. In 2024, the World Economic Forum rated climate inaction the top global risk by severity over the next decade. The investment required was large and immediate. The cost of inaction was deferred and diffuse. The rhino charged.
The Gray Rhino visualization on ElysiaTools makes this structural failure viscerally trackable. You watch momentum build across time. You see the window to act narrow — and then close.
Black swans demand robustness — systems that survive the unforeseeable. Gray rhinos demand courage — acting on the foreseeable before the window shuts.
Try it: Gray Rhino Theory Visualization
3. The Simulation That Won the Ig Nobel for Showing Talent Is Overrated
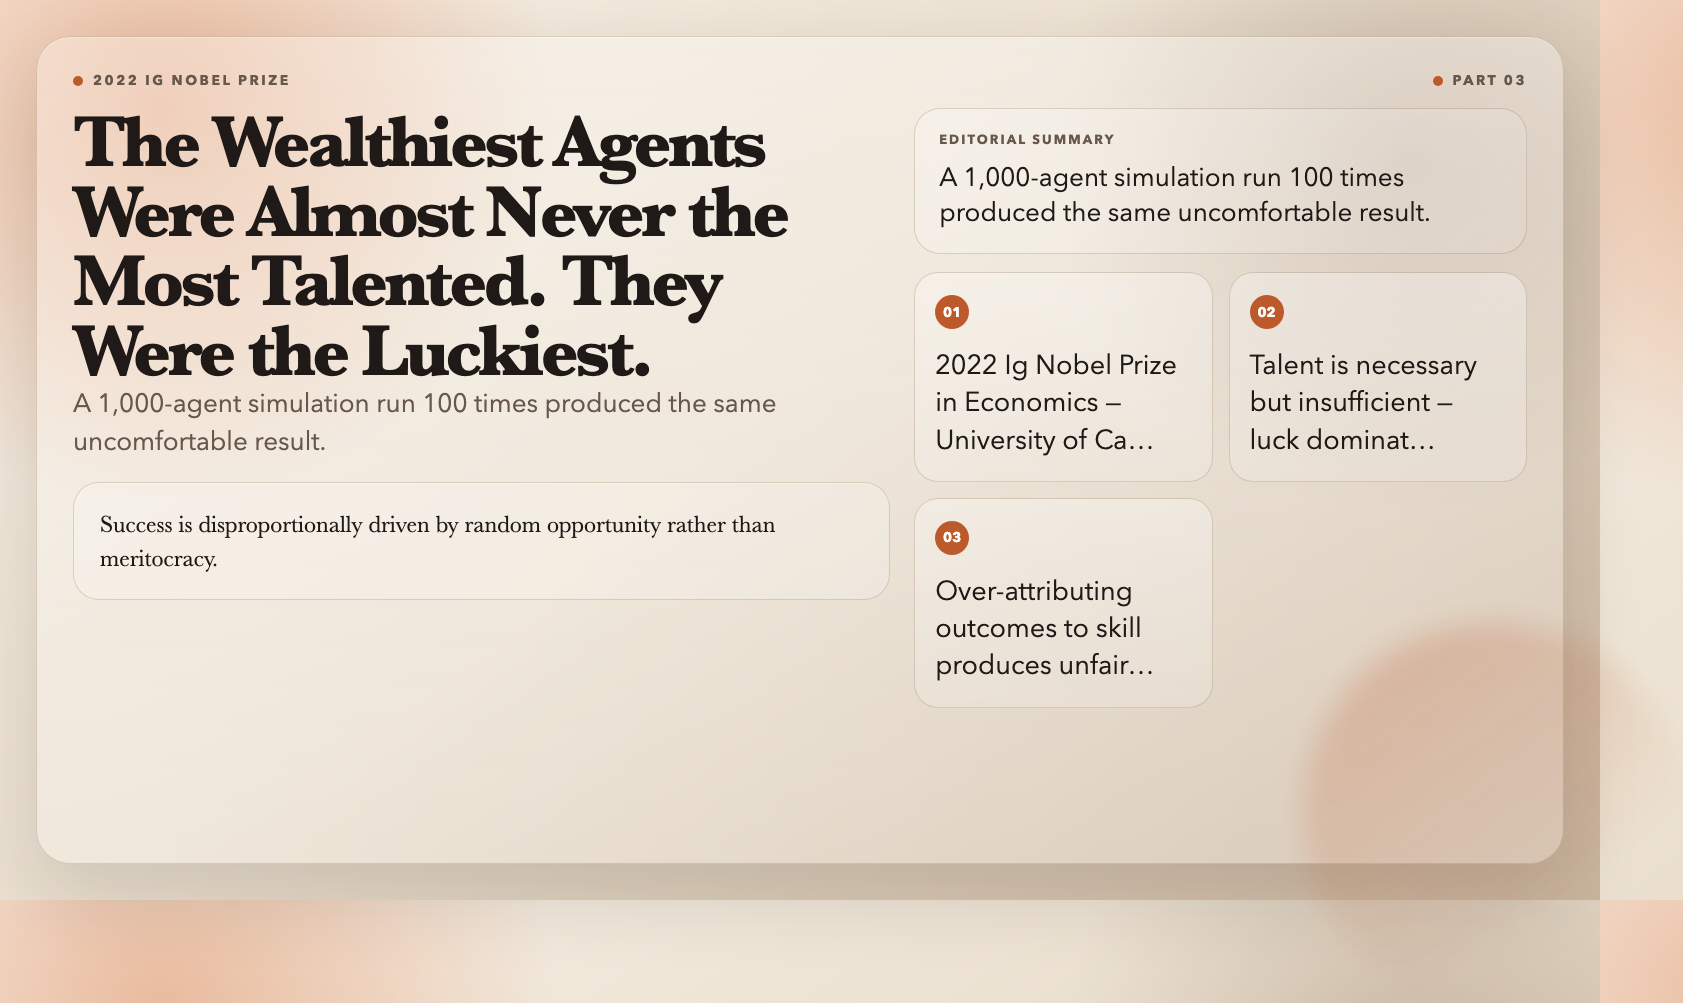
In 2018, Alessandro Pluchino and colleagues at the University of Catania ran a computer model with 1,000 agents, each assigned a random talent score. They ran 100 simulations. The result was consistent across every run: the wealthiest agents were almost never the most talented. They were the luckiest.
The 2022 Ig Nobel Prize in Economics went to this work. Its conclusion is uncomfortable: success is disproportionately driven by random opportunity rather than meritocracy. The simulation lets you adjust luck frequency, talent distribution, and environmental volatility — and watch how consistently the luckiest, not the ablest, rise to the top.
The implication is not that talent is irrelevant. It is that talent is necessary but insufficient. A system that celebrates pure meritocracy while ignoring structural luck produces outcomes that look remarkably like the opposite — and then cites the talent of winners as proof that the system works.
Over-attributing outcomes to skill — your own or anyone else’s — produces unfair judgment and dangerous overconfidence in roughly equal measure.
Try it: Talent vs Luck Visualization
4. Information Cascades: Why Crowds Collapse Into Catastrophe
In 1996, economists Bikhchandani, Hirshleifer, and Welch published a finding that should shake every boardroom: people make better decisions in isolation than in groups — even when individuals privately hold superior information.
The mechanism is individually rational and collectively destructive. Person A chooses Option 1. Person B sees A’s choice, infers strong information, and overrides their own private signal to follow. Person C watches A and B both choose Option 1, infers both must have strong signals, and follows despite a contradictory private signal. By Person N, everyone follows the crowd not because their own information supports it, but because everyone else’s visible choice implies information they do not individually possess.
This explains why markets collapse in orderly fashion (everyone sells because everyone sells), why mediocre startups attract sequential A-list investors, and why the most dangerous moment in any bull market is when fundamentals have clearly broken but price momentum is still climbing.
The Information Cascade Simulator at ElysiaTools lets you run this. Set private signal accuracy, watch beliefs update sequentially, observe when the cascade becomes fragile — and note how a single contrarian signal can collapse the whole structure.
Try it: Information Cascade Simulator
5. The Lorenz Curve: Why “Average” Income Tells You Nothing Useful
Here is a precise statement with real consequences: if Jeff Bezos walks into a bar, the average net worth of everyone inside rises by approximately $20 billion. The median barely moves.
This is not a joke about billionaires. It is a demonstration of why average statistics mislead in any system with extreme outliers — which describes most systems that matter: wealth, income distribution, city sizes, viral content.
The Lorenz Curve maps this precisely. It plots the cumulative share of income held by the cumulative share of the population. The further the curve bows from the diagonal of perfect equality, the more concentrated the wealth.
The ElysiaTools tool pairs the curve with the Gini Coefficient — a single number summarizing inequality. A Gini of 0 is perfect equality. A Gini of 1 means one person holds everything. The United States sits around 0.41; Denmark around 0.28; South Africa around 0.63. One extreme outlier — a single billionaire — bends the national average away from any reasonable description of typical welfare.
Try it: Lorenz Curve & Gini Coefficient
The Pattern Running Through All Five
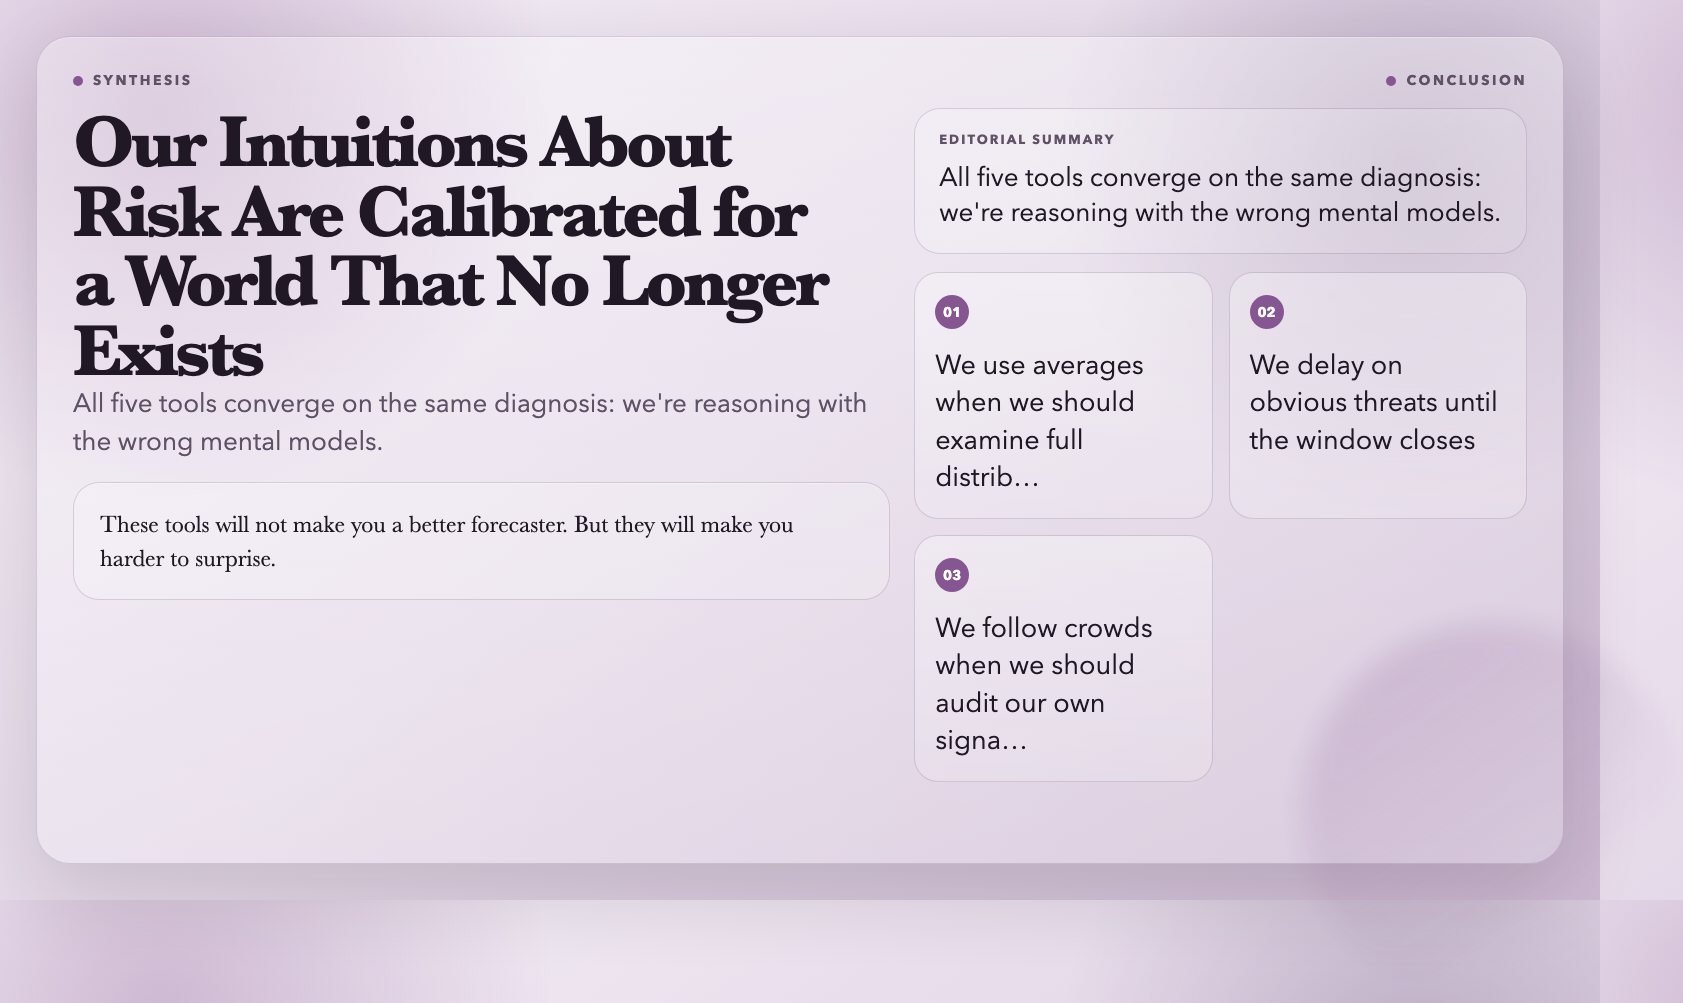
These five tools inhabit different domains. But they share a structural diagnosis: our intuitions about risk, fairness, and predictability are calibrated for a world that no longer exists.
We reason as if we live in Mediocristan. We use averages when we should examine distributions. We delay action on obvious threats until the window closes. We credit talent when we should also account for luck. We follow crowds when we should audit our own signals.
The honest implication: the expert consensus is most reliable about the recent past and least reliable about the future that matters most. These tools will not make you a better forecaster. But they will make you harder to surprise — and in a world that runs on Extremistan dynamics, that is the single most valuable intellectual edge you can build.