The 100-Year-Old Equation Decides Whether Carbon Capture Succeeds or Fails
Open your kitchen faucet. That charcoal filter inside? It’s adsorption in action. Molecules of contaminants stick to the surface of activated carbon like geckos on a ceiling. But here’s what most engineers don’t appreciate: the invisible math governing how that carbon grabs those molecules was worked out in 1918, and it determines whether the carbon capture system your company is betting billions on actually works.
The equation is called the Langmuir isotherm. And in the race to pull CO₂ from the atmosphere, understanding it isn’t optional — it’s everything.
What an Isotherm Actually Describes
An adsorption isotherm is a curve. It plots how much gas or liquid a solid surface can hold, against the concentration (or pressure) of that substance in the surrounding fluid, measured at constant temperature. The word “isotherm” literally means “same heat” — the temperature never changes during the measurement.
That’s the laboratory setup. But the curve it produces tells you something profound: how a material’s surface behaves. Does it grab molecules greedily even at low concentrations, then taper off as it fills up? Or does it sit nearly empty until high concentrations force molecules onto it? Each pattern maps to a different physical reality at the atomic scale.
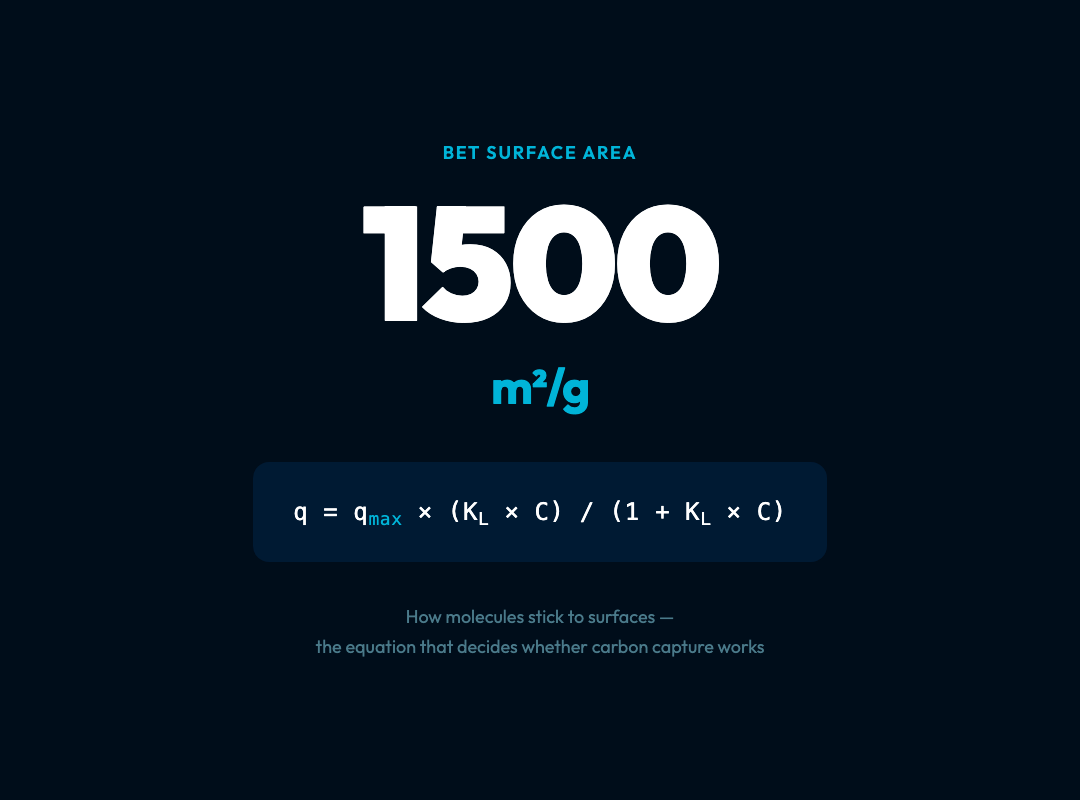
Langmuir derived his equation from four assumptions that sound almost too clean to be true: every adsorption site is identical, each site holds exactly one molecule, there’s no interaction between neighboring molecules, and the whole process reaches a dynamic equilibrium. From those four premises, a remarkably elegant formula emerges: q = q_max × (K_L × C) / (1 + K_L × C)

Where q is the amount adsorbed, q_max is the maximum capacity (a single complete monolayer of molecules), K_L is the Langmuir constant (a measure of how strongly the surface attracts the adsorbate), and C is the concentration.
At very low concentrations, this simplifies to a straight line — Henry’s law, where adsorption is proportional to pressure. At high concentrations, it plateaus at q_max. In between, it curves. The entire adsorption behavior of a material fits inside three parameters.
Why Freundlich Adds the Dimension Langmuir Misses
Langmuir’s model is beautiful. It’s also wrong in important ways.
Real surfaces aren’t homogeneous. Activated carbon has pores of different sizes. Zeolite crystals have defects. Metal-organic frameworks have irregular channels. On a heterogeneous surface, the strongest sites get occupied first, then the weaker ones. The adsorption energy isn’t constant — it decreases as coverage increases.
Freundlich proposed an empirical alternative that handles this: q = K_F × C^(1/n)
Where K_F is a capacity constant and n is an intensity parameter. When n > 1, adsorption is favorable. When n < 1, it’s unfavorable. The Freundlich equation fits data on non-ideal surfaces that Langmuir can’t describe.
But neither model handles multilayer adsorption well. That’s where BET comes in.
BET: The Equation That Measures Surface Area You Can’t See
The Brunauer-Emmett-Teller theory, developed in 1938, extended Langmuir to allow multiple molecular layers. The key physical insight: the first layer bonds strongly to the surface. Subsequent layers bond weakly to each other, with energy close to the heat of liquefaction.
BET gives us the equation for measuring the specific surface area of porous materials — one of the most fundamental characterization measurements in all of materials science. The standard BET surface area analysis uses nitrogen adsorption at 77 K. Researchers apply the BET equation to the linear region of the isotherm (relative pressure 0.05–0.30), extract the monolayer capacity, and convert it to surface area using the known cross-sectional area of a nitrogen molecule (0.162 nm²).
A high-quality activated carbon might have a BET surface area of 1,000–2,000 m² per gram. That means one gram of material has the internal surface area of roughly three football fields. The BET equation is what tells you that number.

The IUPAC Classification: Six Types, Six Material Stories
The International Union of Pure and Applied Chemistry classifies adsorption isotherms into six types. Each type correlates with a distinct pore structure and adsorption mechanism:
Type I is concave and plateaus quickly. This is microporous materials (< 2 nm pores) — the adsorbate fills the pores rather than forming a surface monolayer. Zeolites and some activated carbons show Type I behavior.
Type II is concave at low pressure then convex at high pressure. The inflection point marks the completion of the monolayer. This is non-porous or macroporous materials — Langmuir behavior transitions to multilayer adsorption.
Type III is convex from the start. The heat of adsorption is lower than the heat of liquefaction — weak surface interactions mean multilayer formation begins before the monolayer is complete.
Type IV shows hysteresis — the adsorption and desorption curves don’t coincide. This is the signature of mesoporous materials (2–50 nm pores), where capillary condensation causes the adsorption branch to rise steeply, then the desorption branch to follow a different path.
Type V combines weak interactions with mesoporosity — hysteresis appears but with a different shape than Type IV.
Type VI is layered and stepwise, representing uniform non-porous surfaces where each layer completes before the next begins.
If you run an adsorption experiment and see a Type IV isotherm with an H2 hysteresis loop (ink-bottle pores), you know your material has narrow-necked pores even if you’ve never looked at it under a microscope.
The Hysteresis Loop: A Window Into Pore Geometry
The hysteresis loop isn’t just an experimental curiosity. Its shape reveals pore geometry in detail.
The Kelvin equation governs capillary condensation: at a given vapor pressure, a concave meniscus condenses at a lower pressure than a convex meniscus evaporates. In cylindrical pores, evaporation occurs from the meniscus at the pore opening. In ink-bottle pores, evaporation requires the neck to empty first — at a different pressure than where condensation occurred in the wider body. This creates the hysteresis loop.
Engineers classify hysteresis loops as H1 through H4. H1 indicates cylindrical pores with uniform size. H2 indicates ink-bottle pores with narrow necks and wide bodies — common in many mesoporous silicas. H3 indicates slit-shaped pores, typical of layered clay materials. H4 indicates narrow slit pores, common in microporous carbons.
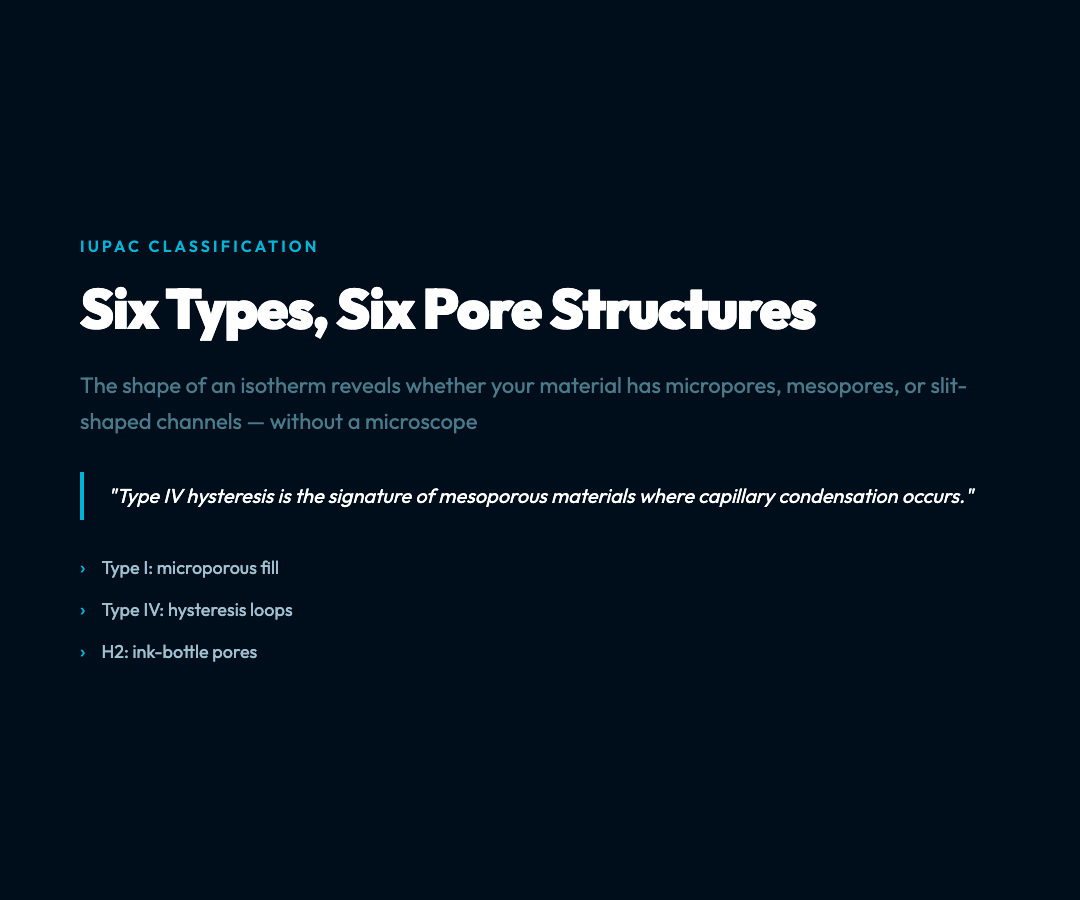
The practical implication: if your carbon capture material shows H2 hysteresis, you may have diffusion limitations. Molecules can get trapped in the wide body of an ink-bottle pore and not evaporate when you try to regenerate the material. That’s efficiency lost.
Real Applications: Where These Equations Decide Billions
Activated carbon filtration — Your drinking water filter, your fish tank filter, your industrial solvent recovery system. Activated carbon (500–1,500 m²/g) removes organic contaminants through physisorption. The Freundlich model often describes its behavior better than Langmuir because activated carbon surfaces are heterogeneous. Choosing the right carbon requires matching the isotherm model to the actual surface chemistry.
Gas storage — Adsorbed natural gas (ANG) technology stores methane at lower pressures than compressed natural gas by using porous carbon or MOFs. The storage capacity isn’t determined by the total surface area — it’s determined by the shape of the isotherm. A material with a steep rise at low pressure (high K_L in Langmuir) may store more usable gas than one with higher total capacity but a gradual slope.
Carbon capture — The technology that could reverse climate change runs on these equations. Solid sorbents — amine-functionalized materials, MOFs, zeolites — must adsorb CO₂ from flue gas (15% CO₂, 85% N₂) at one temperature, then release it at another. The selectivity of the material — how much CO₂ it grabs compared to N₂ — is encoded in the isotherm. A material that looks excellent in pure CO₂ tests may fail in real flue gas because its N₂ isotherm was never measured.
Pharmaceutical purification — Chromatography separates drug compounds using the same principles. The retention time of each compound depends on its adsorption isotherm. Getting the separation right requires knowing not just whether a compound adsorbs, but exactly how its adsorption changes with concentration — the curvature of the isotherm, not just its slope.
The Surface Area Measurement Behind Modern Catalysis
Every catalyst you use — in your car, in the chemical plant producing your plastics, in the refinery upgrading your gasoline — was characterized using BET before anyone trusted it enough to run a reaction.
A catalyst with 80 m²/g versus 120 m²/g of surface area may look similar in a bulk measurement. But if those surfaces have different pore size distributions — one is mostly macroporous, the other mesoporous — their catalytic performance can differ by an order of magnitude. The BET isotherm tells you the surface area. The isotherm type and hysteresis loop tell you the pore structure. Together, they let you engineer surfaces instead of just hoping the right catalyst lands in your reactor.
The Interactive Tool That Makes It Concrete
Adsorption isotherms are abstract until you manipulate them. The Adsorption Isotherms visualization at ElysiaTools lets you adjust Langmuir, Freundlich, BET, and Henry’s law parameters in real time, compare models on the same axes, and watch how the curves change as you tune each constant.
You can see how increasing K_L (binding affinity) steepens the low-concentration rise. How reducing q_max shifts the plateau downward. How Freundlich’s 1/n exponent controls whether the curve is nearly linear or highly curved. The hysteresis panel shows how different loop types map to different pore geometries — and why the same material can behave very differently depending on whether you’re loading or unloading.
It’s the kind of tool that makes the difference between memorizing formulas and understanding the physics.
The Equation That Will Determine Climate Outcomes
Right now, companies are building carbon capture facilities at scale. They’re betting that solid sorbents can pull CO₂ from the air or flue gas economically. The performance of those sorbents — how much they adsorb, how selectively, how easily they regenerate — is governed by adsorption isotherms developed between 1909 and 1938.
There is no climate model that doesn’t depend on these curves. There is no carbon capture optimization that doesn’t start with understanding whether your material follows Langmuir, Freundlich, BET, or some hybrid that doesn’t have a standard name yet.
Irving Langmuir, Herbert Freundlich, Brunauer, Emmett, and Teller never imagined their equations would be deployed against climate change. But they built the grammar. The sentence we’re writing now — in captured carbon and cleaned water and engineered catalysts — is being parsed in the language they gave us.