Why CO₂ Levels From 280 to 420 ppm Are Rewriting Earth’s Energy Budget
On a clear day, sunlight pours down on Earth at 1,361 watts per square meter. That energy does not accumulate forever — our planet must shed exactly as much heat as it absorbs, or it would cook. For over a century, physicists understood this balance perfectly. Then, in the 1980s, a team of scientists traced a small discrepancy — a persistent warming trend — to a subtle cause: humanity had been thickening an invisible blanket around the planet. That blanket is CO₂, and the story of how it works is one of the cleanest applications of thermodynamics you will ever encounter.
The Two-Sided Energy Ledger
Earth’s energy budget is governed by a deceptively simple equation. Solar radiation arrives at the top of the atmosphere — specifically 1,361 W/m² times the cross-sectional area of Earth, divided by the total surface area, which works out to roughly 340 W/m² averaged across the entire sphere. Of this incoming energy, about 30% is reflected back to space by clouds, ice sheets, and ocean surface — this is Earth’s albedo, a reflectivity of 0.30.
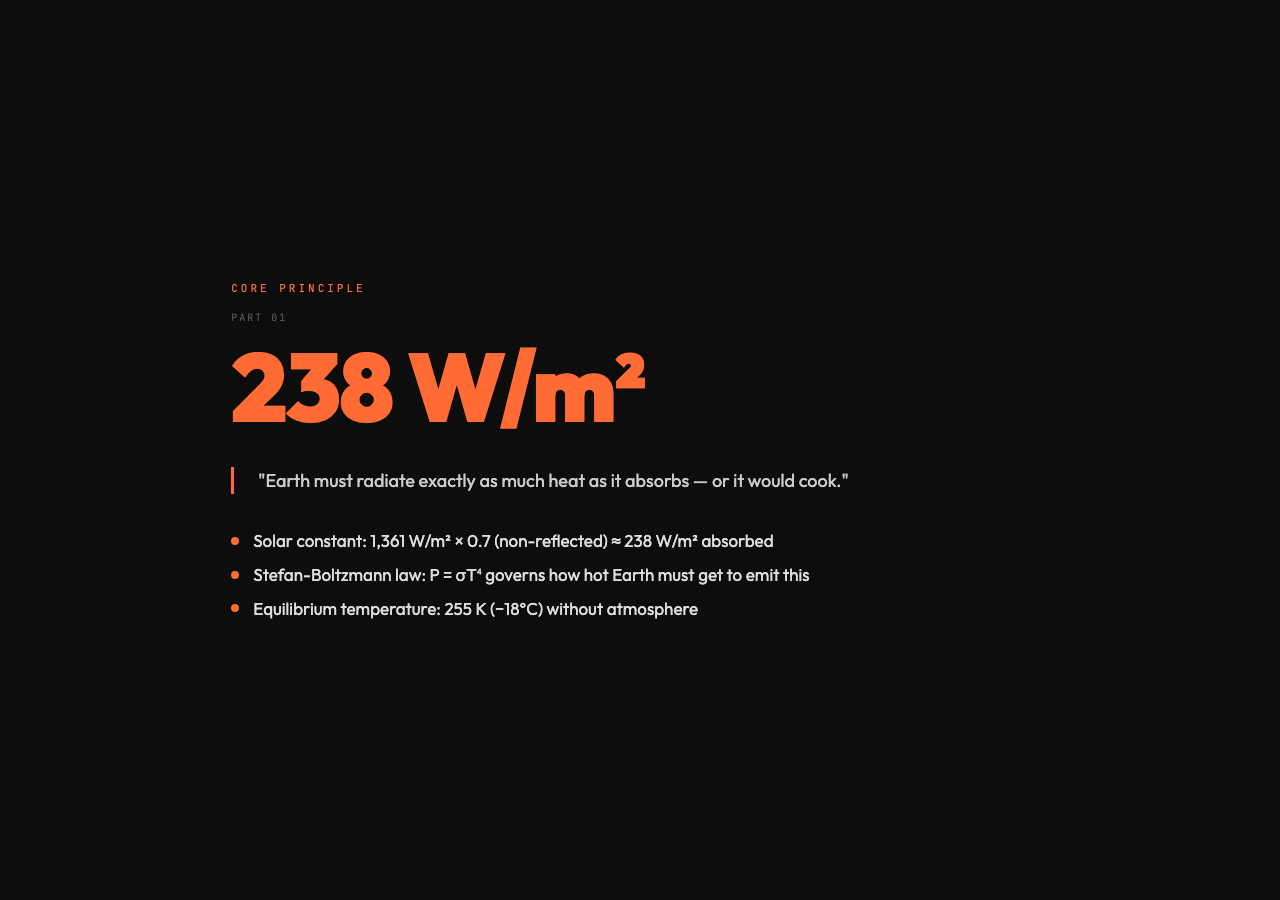
The remaining 70% — roughly 238 W/m² — is absorbed by the oceans, land, and atmosphere, warming the surface. To maintain thermal equilibrium, Earth must radiate an identical amount back out as infrared radiation. This outgoing heat follows the Stefan-Boltzmann law: the power emitted per unit area is proportional to the fourth power of temperature, with the constant of proportionality being σ = 5.67 × 10⁻⁸ W/m²/K⁴.
Solve that equation, and you get an equilibrium temperature of about 255 K (−18°C) — which is freezing. And yet the global average surface temperature is closer to 288 K (15°C). Something is holding heat back.
That something is the atmosphere itself.
The Atmospheric Blanket: Absorption and Re-Emission
Unlike a piece of metal that simply absorbs and conducts heat, a planet loses energy exclusively through electromagnetic radiation — in Earth’s case, infrared light at wavelengths around 10 micrometers. Certain gases in the atmosphere — CO₂, H₂O, CH₄, and O₃ — are partially opaque to this outgoing infrared radiation. They absorb some of the heat that tries to escape, then re-emit it in all directions: half going back down toward the surface, half going up toward space.
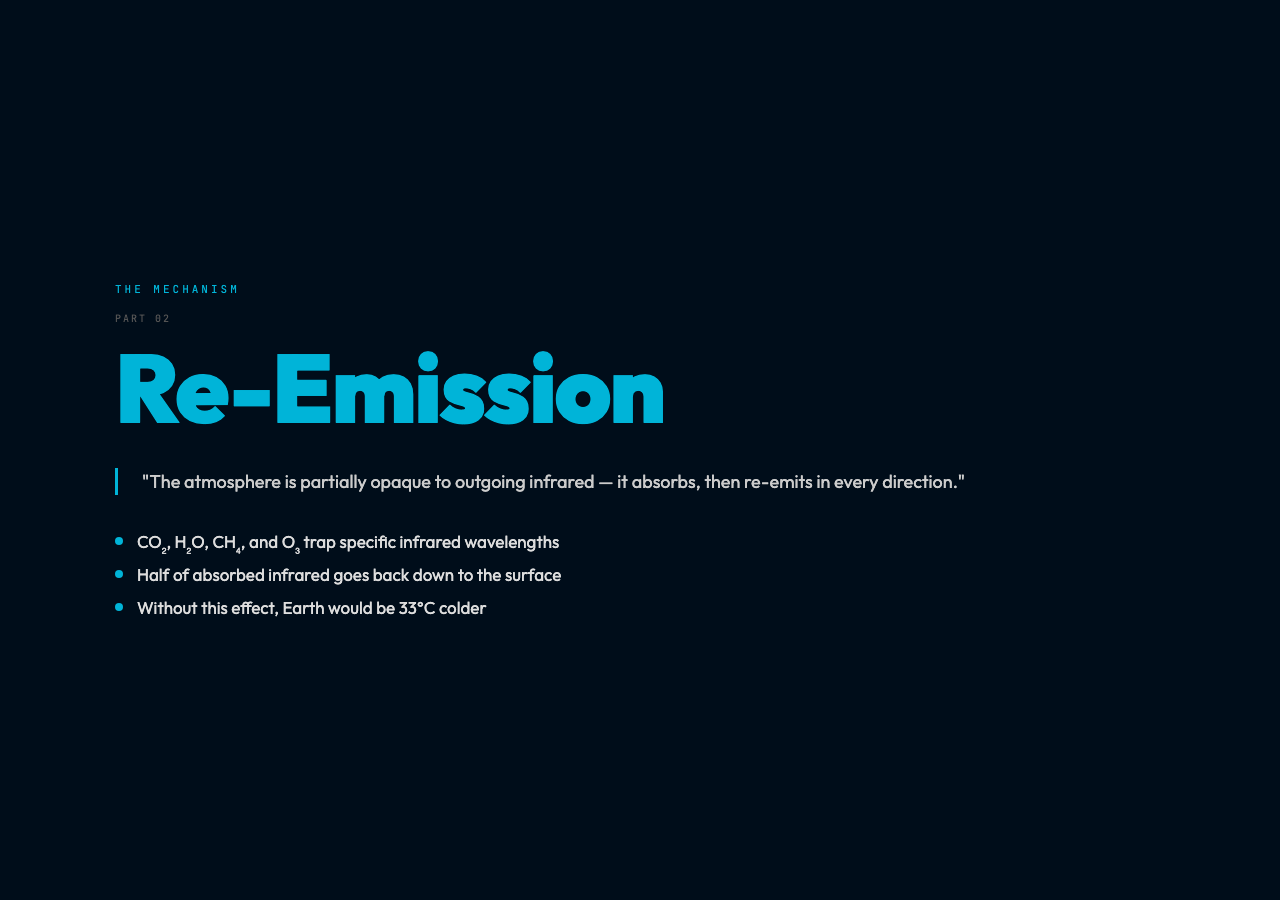
This is the greenhouse effect. Without it, Earth would be 33°C colder — an iceball. With it, we have a habitable world.
The mechanism is real and necessary. The problem arises when the blanket becomes too thick.
The CO₂ Control Knob: From 280 to 420 ppm
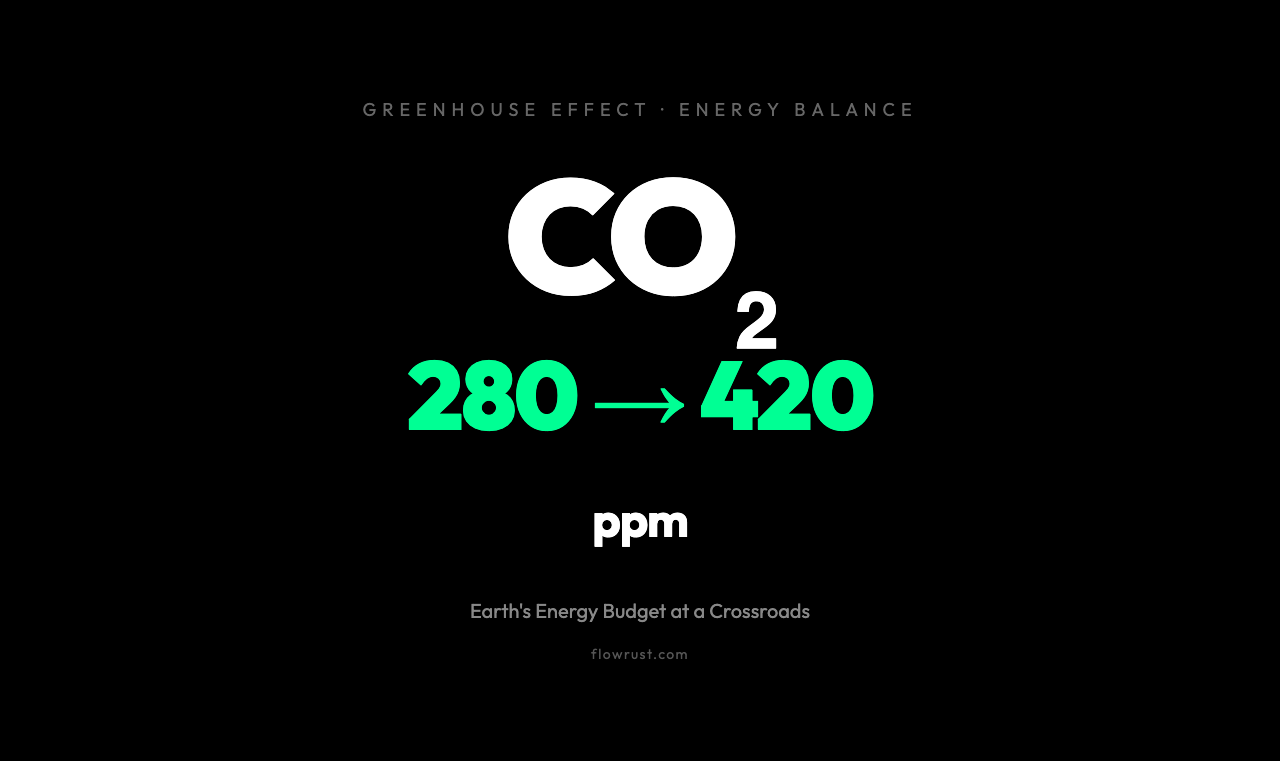
Carbon dioxide concentration is measured in parts per million (ppm) — molecules of CO₂ per million molecules of air. For most of human civilization, this value sat around 280 ppm. The industrial revolution, beginning around 1750, began adding CO₂ through burning fossil fuels. By 2024, the reading surpassed 420 ppm — a 50% increase.
The greenhouse-effect simulation models exactly this progression, with preset CO₂ levels at 280 ppm (pre-industrial), 420 ppm (current), 450 ppm (near-future scenario), 650 ppm, and 950 ppm (high-emission scenario). At each step, the simulation recalculates how much outgoing infrared radiation is trapped.
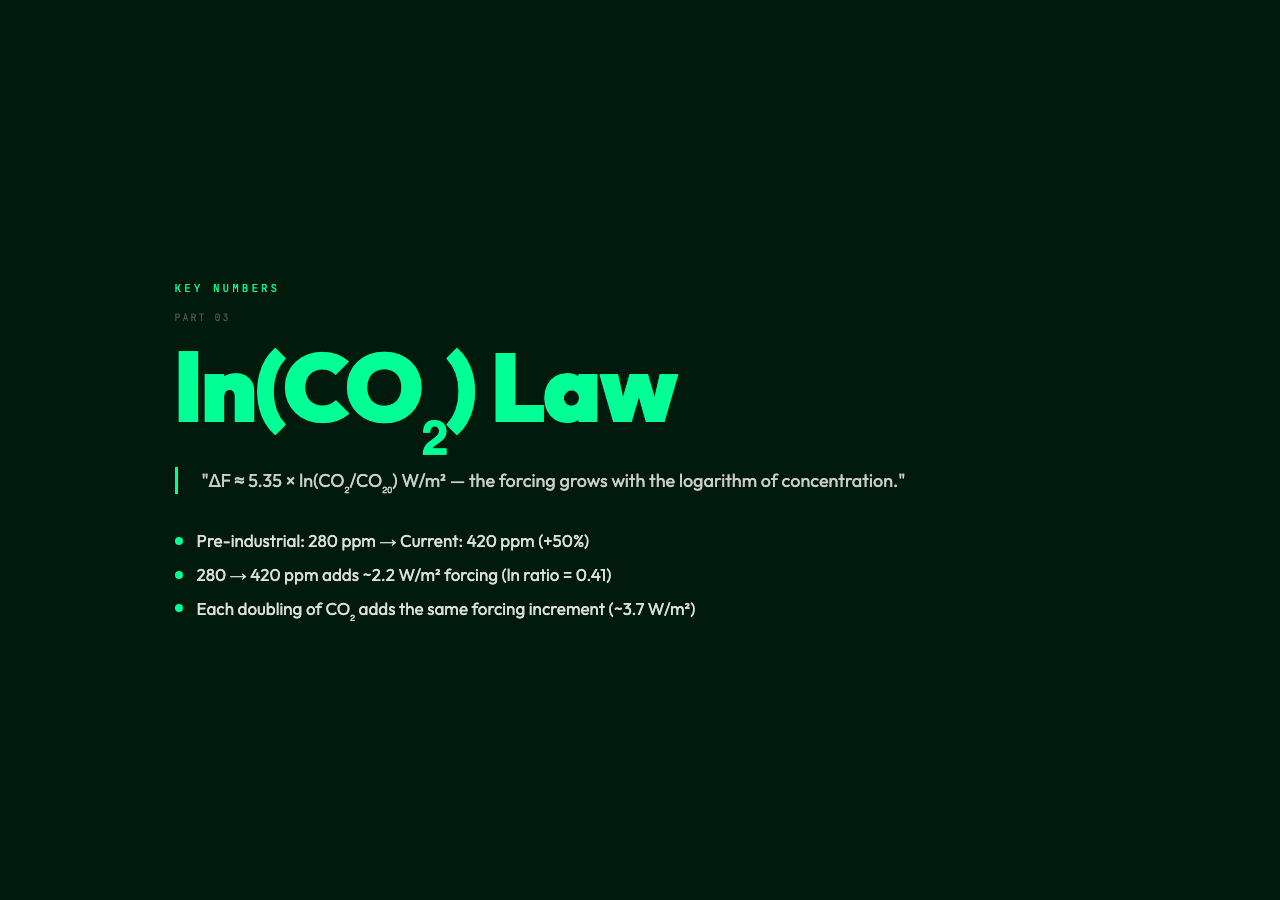
Here is the counterintuitive part: adding CO₂ does not simply scale the warming linearly. Each doubling of CO₂ concentration produces a logarithmic increase in radiative forcing — the technical term for the energy imbalance added to Earth’s budget. The relationship, derived from spectroscopic line absorption data, is:
ΔF ≈ 5.35 × ln(CO₂/CO₂₀) W/m²
At 280 → 420 ppm, ln(420/280) ≈ 0.41, giving a forcing of about 2.2 W/m². That does not sound like much. But the climate system accumulates this imbalance over decades, acting like a slow integrator — a constant 2 W/m² forcing over 30 years is the energy equivalent of detonating roughly 800,000 Hiroshima bombs per day, every day, for three decades. The heat has nowhere to go but into the oceans, ice sheets, and atmosphere.
What the Simulation Reveals
The interactive simulation lets you manipulate CO₂ concentration directly and watch the energy budget rebalance in real time. A few observations stand out from exploring the parameter space:
– At 280 ppm (pre-industrial): The outgoing infrared radiation and incoming solar absorption are in close balance. Surface temperature hovers around the historical global average. The infrared emission height — the altitude at which most radiation finally escapes to space — sits in the mid-troposphere.
– At 420 ppm (current): Noticeable shift in the infrared emission altitude upward by several hundred meters. More CO₂ means the “last escaping photon” is now emitted from higher, colder layers of the atmosphere. Because emitted power scales with T⁴, colder layers radiate significantly less energy than warmer layers — so even a small altitude shift translates to a measurable reduction in total outgoing flux.
– At 950 ppm (extreme scenario): The infrared emission layer pushes into the lower stratosphere. The greenhouse gas optical depth becomes so high that most photons are trapped much higher up. The warming signal becomes visually dramatic in the simulation — surface temperature projections shift by 4–8°C above the pre-industrial baseline, depending on feedback loops.
One detail the simulation handles carefully: water vapor feedback. As the atmosphere warms from CO₂ forcing, evaporation increases, adding more water vapor (a powerful greenhouse gas itself) to the air. This amplifies the original CO₂ forcing by a factor of roughly 1.5–2× — a feedback loop that climate models must include to match observations.
Why This Is Worth Understanding
The greenhouse effect is not a controversial theory. It is undergraduate atmospheric physics — the same equations that appear in standard textbooks on heat transfer and radiative processes. What is politically charged is the policy response, not the science.
Understanding the mechanism directly from the underlying physics — Stefan-Boltzmann, radiative forcing, logarithmic CO₂ response — cuts through a lot of noise. You do not need to trust a model or an institution. The numbers are spectroscopic constants that have been measured in laboratories since the 19th century. The only question is how much additional CO₂ humans will add to the atmosphere, and how the slow-feedback systems (ice sheets, forest dieback, permafrost methane release) will respond.
The simulation lets you run those scenarios yourself, adjust CO₂, and watch the budget rebalance. The physics is in full view, and it does not require a PhD to read.